ISABELA FONSECA
GENE EXPRESSION PROFILE IN GYR AND CROSSBREED DAIRY COWS WITH MASTITIS
Thesis presented to the Universidade Federal de Viçosa, as part of the requirements of the Genetics and Breeding Graduate Program for the attainment of the title Doctor Scientiae.
VIÇOSA
ACKNOWLEDGEMENTS
I thank to God for the strength and courage to move forward.
I would like to thank Universidade Federal de Viçosa and the Genetics and Breeding Program for providing me the opportunity to conclude my post-graduate education. I am also grateful to CNPq and CAPES for the financial support.
I would like to thank my adviser Prof. Simone for her guidance and support throughout my academic life and confidence on my work. I am also very grateful to
my co-adviser Dr. Marta for her encouragement that has been shaped my scientific endeavors and invaluable guidance that were essential for enriching my knowledge. I would also like to thank my co-adviser Dr. Fernando for his help and suggestions in the experiments.
I am grateful to members of my thesis reading committee Dr. Wagner Arbex, Dr. Wanessa Carvalho and Dr. Marcos Marcondes for spending their time on careful reading of my thesis as well as for their valuable comments.
Many thanks to Embrapa Dairy Cattle and all my friends of Molecular Genetics Laboratory who always cheered me up.
Summary
ABSTRACT ...v
RESUMO... vii
GENERAL INTRODUCTION ... 1
References ... 3
CHAPTER 1 ... 5
Abstract ... 5
Introduction ... 6
Material and Methods ... 8
Experimental animals ... 8
Inoculation and collection of the samples ... 9
Isolation of RNA and quality control ... 10
Large-scale gene expression experiments ... 10
Validation of the genes differentially expressed by real-time PCR ... 11
Construction and analysis of the gene networks ... 13
Results ... 14
Discussion ... 17
References ... 31
CHAPTER 2 ... 38
Abstract ... 38
Introduction ... 39
Material and Methods ... 41
Results ... 42
Discussion ... 43
References ... 48
CHAPTER 3 ... 52
Abstract ... 52
Introduction ... 52
Gene expression and networks ... 53
Methods used to identify gene networks ... 54
Application of gene networks to identify new candidate genes ... 56
Studies of networks applied to dairy cattle breeding ... 58
References ... 59
ABSTRACT
FONSECA, Isabela Fonseca, D.Sc., Universidade Federal de Viçosa, February, 2014. Gene expression profile in gyr and crossbreed dairy cows with mastitis. Adviser: Simone Eliza Facioni Guimarães. Co-advisers: Marta Fonseca Martins and Fernando Flores Cardoso.
Among the potential public health problems of animal production, infectious-contagious diseases stand out. Mastitis is among the main diseases affecting dairy cattle. It is an inflammatory response in the mammary gland caused by an influx of somatic cells, composed mainly of neutrophils, macrophages and lymphocytes. The
speed and efficacy of the host’s immune response to the invasive pathogen affects
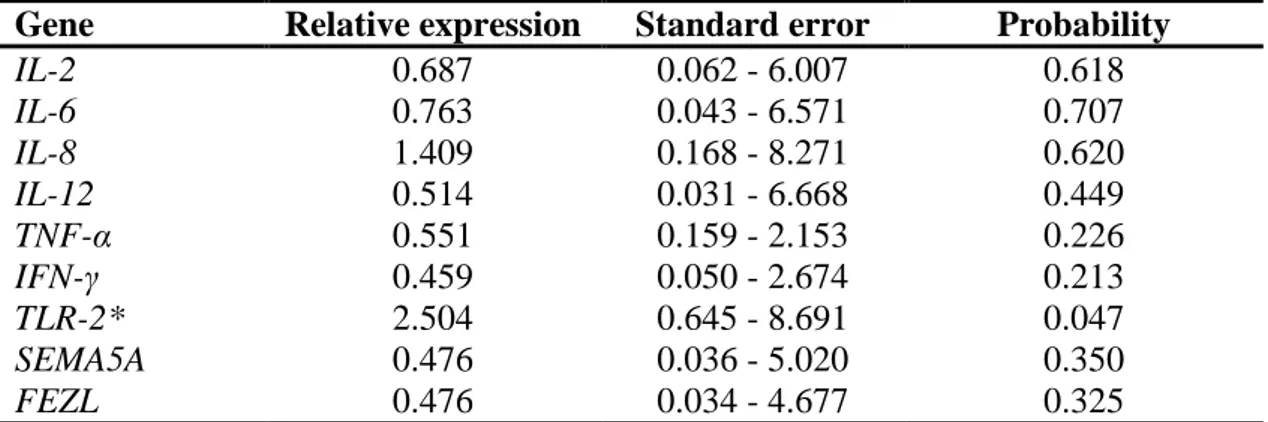
the establishment, persistence and severity of the infection. To characterize the gene expression and response mechanism to mastitis in crossbreed dairy cows and Gyr breed, we carried out a transcriptome study of the cells present in the milk from 20 crossbreed dairy cows with natural infection and 17 Gyr cows artificially infected with Streptococcus agalactiae. The group of crossbreed animals was composed of 10 animals free of infection and 10 with clinical mastitis. This group we quantified the relative expression of the genes IL-2, IL-6, IL-8, IL-12, IFN- , TNF-α, TLR-2,
SEMA5A, and FEZL using the real-time PCR method. Among these genes, the TLR-2
of the pathogen. The IL-1 gene showed peak expression 4 hours after inoculation, while the CD40 and INHBA genes maintained their expression throughout the
experimental period. The IL-12 and IL-17 genes showed the highest expression rates 24 hours after inoculation in relation to hour 0, with an increase in the level of expression by more than a factor of 20. Comparison of the gene expression between the inoculated and non-inoculated quarters showed greater expression in nine genes in the inoculated quarters. Analyses of gene networks revealed three modules with distinct characteristics 24 hours after inoculation and showed that some mechanisms are altered in Gyr dairy cows after infection of the mammary gland by Strep. agalactiae. However, it is important to emphasize that these results can not be
RESUMO
FONSECA, Isabela Fonseca, D.Sc., Universidade Federal de Viçosa, Fevereiro, 2014. Perfil de expressão gênica em vacas gir e mestiças com mastite. Orientadora: Simone Eliza Facioni Guimarães. Co-orientadores: Marta Fonseca Martins e Fernando Flores Cardoso.
Dentre os problemas sanitários na produção animal, as doenças infectocontagiosas são as que mais se destacam, sendo a mastite uma das principais doenças em gado de leite. Esta se caracteriza por uma resposta inflamatória na glândula mamária na qual ocorre um influxo de células somáticas compostas principalmente por neutrófilos, macrófagos e linfócitos. A rapidez e a eficácia da resposta imune do hospedeiro
contra o patógeno invasor afeta o estabelecimento, a persistência e a gravidade da infecção. Com o objetivo de caracterizar a expressão gênica em animais mestiços e Gir Leiteiro em resposta à mastite foi realizado um estudo de transcriptoma de células presentes no leite de 20 animais mestiços com infecção natural e de 17 vacas Gir infectadas artificialmente com Streptococcus agalactiae. O grupo de animais mestiços era composto por 10 vacas hígidas e 10 vacas com mastite clínica. Neste grupo foi avaliada a expressão relativa dos genes IL-2, IL-6, IL-8, IL-12, IFN- , TNF-α, TLR-2, SEMA5A e FEZL por meio da metodologia de PCR em Tempo Real. Dentre estes genes, o TLR-2 foi 2,5 vezes mais expresso nos animais com mastite (P < 0,05). Já as amostras do grupo de animais Gir, composto por 17 vacas em lactação, tiveram a expressão avaliada pela técnica de microarranjo e validada por PCR em Tempo Real. Neste caso foram coletadas amostras de leite antes da inoculação (tempo 0), 4, 9 e 24 horas após a inoculação da bactéria em um dos quartos e nos tempos 0 e 24 horas em um dos quartos não inoculado. Foram observados 32 genes diferencialmente expressos entre os tempos 0 e 4 horas após a inoculação pela técnica de microarranjo. A validação destes resultados por PCR em Tempo Real foi feita para os genes AATK, CCL2, CCL20, CD40, CSF2, IL-1 , INHBA e NOS2A. Além destes oitos genes, outros seis tiveram sua expressão avaliada por PCR em Tempo Real, apesar de não terem apresentado diferença significativa pela técnica de microarranjo (IL-12, IL-17, TLR-2, TLR-4, GRO-α e TGF- 1). Dos 14 genes analisados por PCR em Tempo Real, todos apresentaram diferença de expressão
significativa em relação ao tempo 0, sendo que a maior parte apresentou expressão máxima 24 horas após a inoculação do patógeno. O gene IL-1 apresentou pico de
expressão 4 horas após a inoculação, enquanto que os genes CD40 e INHBA mantiveram sua expressão alta por todo o período do experimento. Os genes IL-12 e IL-17 foram os que apresentaram maiores taxas de expressão 24 horas após a
GENERAL INTRODUCTION
Dairy farming is one of Brazil’s most important agribusiness activities. In recent years, with the improvement in economic conditions and expansion of the middle class, the agricultural sector has shown strong growth, especially the dairy segment. Between 2000 and 2011, output of milk in the country grew 62.4%, surpassing the mark of 32 billion liters per year. According to the latest figures,
Brazil is the world’s fourth leading producer of milk, only behind the United States,
India and China. Besides this, it is also in fourth place in consumption of fluid milk, at 10.9 billion liters in 2012 (http://www.cileite.com.br/content/panorama-do-leite). Even with the strong domestic consumption of milk and other dairy products, since 2004 Brazil has been a net exporter of these products, attesting to the productive capacity of its dairy farmers.
Despite the statistics showing the constant evolution of the milk production
chain, in recent years the nation’s dairy sector has been facing new competitive
challenges and reduced profit margins, requiring increasingly efficient production systems. The effort to increase the productivity of herds mainly involves genetic improvement and adequate nutrition. The adaptation of animals for diverse environments has been pursued by crossing different breeds or subspecies (Bos taurus and Bos indicus), to obtain animals with good productivity that are also
adapted to the country’s range of climate conditions. Zebu breeds (B. indicus) and
how much these breeds have been gaining importance for the Brazilian dairy industry.
However, it is not enough just to increase the milk production to maintain the
sector’s productivity. Three is also a need to improve installations, worker training,
zootechnical and genetic methods, public policies and animal health. On the matter of animal health, mastitis is the main disease in economic terms. Besides reducing milk yield and quality (in terms of nutritional parameters and contamination by pathogens and antibiotic residues), it increases costs for labor and treatment and requires discarding substantial quantities of milk. Beyond the economic impact, mastitis is also of great concern in terms of animal welfare, because it causes fever, swelling of the udder and even locomotion difficulties (Contreras & Rodríguez, 2011).
According to Cassol (2010), the losses attributed to this disease amount to approximately US$ 200 for each affected cow, 70% of which is due to reduced production of mammary quarters with subclinical mastitis; 14% caused by devaluation of animals due to functional reduction of the afflicted quarters or early retirement or death of the animal; 8% due to the milk that must be discarded because of alterations and/or presence of antibiotic residues after treatment; and 8% from treatment costs, among them veterinarians’ fees and the cost of drugs. Therefore, a better understanding of this disease is important to find solutions to these problems.
Due to the high prevalence of mastitis in national herds, in Brazil it is estimated that lost production could occur between 12 and 15%, which means a total of 4.8 billion liters/year compared to annual production of 32 billion liters (Pritchett et al, 2005; Kelton 2006; FAO, 2013).
genes that impart resistance through the selection of more resistant animals is a practice that should be encouraged.
One of the techniques employed to select resistant animals is the use of molecular markers in genetic improvement programs. Various strategies can be applied to identify these markers, among which studies of gene expression stand out. These studies generate knowledge about the biochemical and genetic mechanisms of resistance by clarifying the actions of the respective genes. Therefore, it is important to identify and characterize the gene expression in animals with mastitis for subsequent use of this information to aid the search for genes that can be tested and validated as markers of such physiological conditions. Research groups in Brazil and elsewhere in the world have been using molecular genetic methods for prospection and isolation of genes associated with resistance to diseases and better quality of bovine products (Denis et al., 2006; Lahouassa et al., 2007; Petzl et al., 2008). In recent years, new methods to indentify genes of interest by means of gene networks have become available (Chen et al., 2008; Reverter & Fortes, 2013). However, all these studies to characterize gene expression in cows with mastitis have used taurine animals. Thus, the use of zebu and crossbreed animals is important, since the existing references are scarce and limited in scope.
The objective of this study was to assess the gene expression in response to mastitis in crossbred (Holstein x Gyr) and Gyr Dairy cows.
References
Cassol, D.M.S.; Sandoval, G.A.F.; Pericole, J.J.; Gil, P.C.N.; Marson, F.A. Introdução Agentes da Mastite Diagnóstico e Tratamento. A Hora Veterinária, Ano 29, n° 175, maio /junho 2010.
Chen Y, Jun Zhu J, Lum PY, Yang X, Pinto S, MacNeil DJ, Zhang C, Lamb J, Edwards S, Sieberts SK, Leonardson A, Castellini LW, Wang S, Champy MF, Zhang B, Emilsson V, Doss S, Ghazalpour A, Horvath S, Drake TA, Lusis AJ, Schadt EE. Variations in DNA elucidate molecular networks that cause disease. Nature, v. 452, n. 7186, p. 42-435, 2008.
Contreras, G.A.; Rodríguez, J.M. Mastitis: Comparative Etiology and
Epidemiology. Journal of Mammary Gland Biology and Neoplasia, v. 16, p. 339-56, 2011.
different in mammary gland secretions of lactating and drying off cows. Veterinary Immunology and Immunopathology, v. 114, p. 111-120, 2006.
FAO (2013). Disponível em:
http://www.cileite.com.br/sites/default/files/2013_02_PanoramaLeite.pdf. Acesso em 14 fev. de 2014.
Ferreira, M.B.D.; Lopes, B.C.; Ledic, I.L.; Fernandes, L.O.; Ribeiro, S.A.
Características reprodutivas de touros da raça Gir. Revista Gir Leiteiro, n.7, p.30-38, 2007.
Kelton, D.F. Epidemiology: a foundation for dairy production medicine. Veterinary Clinics of North America: Food Animal Practice, v. 22, p. 21-33, 2006
Lahouassa, H.; Moussay, E.; Rainard, P.; Riollet, C. Differential cytokine and chemokine responses of bovine mammary epithelial cells to Staphylococcus aureus and Escherichia coli. Cytokine, v.38, p.12-21, 2007.
Panorama do Leite: boletim eletrônico mensal. Coordenadores: Kennya Beatriz Siqueira e Rosangela Zoccal. Juiz de Fora: Embrapa Gado de Leite, v. 6, n. 78, maio 2013. Disponível em:
<http://www.cileite.com.br/sites/default/files/2013_05_PanoramaLeite_0.pdf>. Acesso em: 16 jan. de 2014.
Petzl, W.; Zerbe, H.; Gunther, J.; Yang, W.; Seyfert, H.; Nurnberg, G.; Schuberth. H. Escherichia coli, but not Staphylococcus aureus triggers an early increased
expression of factors contributing to the innate immune defense in the udder of the cow. Veterinary Research, v. 39, p. 18, 2008.
Pritchett, J.; Thilmany, D.; Johnson, K. Animal Disease Economic Impacts: A Survey of Literature and Typology of Research Approaches. International Food and Agribusiness Management Review, v. 8, p. 23-45, 2005.
Reverter, A.; Fortes, M.R.S. Building single nucleotide polymorphism-derived gene regulatory networks: Towards functional genome-wide association studies. Journal of Animal Science, v. 91, p. 530-6, 2013.
CHAPTER 1
Gene expression profile in zebu dairy cows infected with Streptococcus
agalactiae
I. Fonsecaa, F. F. Cardosob, R. H. Higac, P. F. Giachettoc, H. M. Brandãod, M. A. V. P. Britod, M. B. D. Ferreirae, S. E. F. Guimarãesa, M. F. Martinsd
a
Departamento de Zootecnia, Universidade Federal de Viçosa, 36571-000, Viçosa, MG, Brazil.
b
Embrapa South Animal Husbandry & Sheep, 96401-970, Bagé, RS, Brazil. c
Embrapa Agriculture Informatics, 13083-886, Campinas, SP, Brazil. d
Embrapa Dairy Cattle, 36038-330, Juiz de Fora, MG, Brazil. e
Epamig, 38001-970, Uberaba, MG, Brazil.
Corresponding author: Marta Fonseca Martins E-mail: [email protected]
Abstract
Mastitis is an inflammatory response in the mammary gland caused by an influx of somatic cells, composed mainly of neutrophils, macrophages and lymphocytes. The speed and efficacy of the host’s immune response to the invasive pathogen affects the establishment, persistence and severity of the infection. To characterize the gene expression and response mechanism to infection by Streptococcus agalactiae in zebu dairy cows of the Gyr breed, we carried out a transcriptome study of the cells present in the milk from 17 animals. Milk samples were collected before inoculation (hour 0) and 4, 9 and 24 hours after inoculation of the bacteria into one of the quarters and at 0 and 24 hours from one of the quarters not inoculated. The transcriptome analysis
technique. Of the 14 genes analyzed by real-time PCR, all showed a significant difference in expression for at least one of the comparisons between times. This
analysis indicated an increase in the expression of all the genes that presented a significant difference in relation to hour 0, with most of them presenting maximum expression 24 hours after inoculation of the pathogen. The IL-1 (interleukin 1 ) gene showed peak expression 4 hours after inoculation, while the CD40 (CD40 molecule) and INHBA (inhibin beta A) genes maintained their expression throughout
the experimental period. The IL-12 (interleukin 12) and IL-17 (interleukin 17) genes showed the highest expression rates 24 hours after inoculation in relation to hour 0, with an increase in the level of expression by more than a factor of 20. Comparison of the gene expression between the inoculated and non-inoculated quarters showed greater expression in nine genes in the inoculated quarters. Analyses of gene networks revealed three modules with distinct characteristics 24 hours after inoculation and showed that some mechanisms are altered in Gyr dairy cows after infection of the mammary gland by Strep. agalactiae.
Keywords: Gyr, immune response, mammary, mastitis
Introduction
Mastitis is an inflammatory response of the mammary gland caused by
metabolic and physiological changes, traumas, or more frequently by environmental or contagious pathogenic microorganisms (Oviedo-Boyso et al., 2007), including gram-negative and gram-positive bacteria, mycoplasmas and algae (Zadoks et al., 2011). This inflammatory response is characterized by an influx of somatic cells composed mainly of neutrophils, macrophages and lymphocytes (Rainard and Riollet
β00γ), in which the speed and efficacy of the host’s immune response against the invasive pathogen affects the establishment, persistence and severity of the infection (Bannerman 2009). Besides the economic impact of this disease, due to alterations in the milk composition, reduced milk production and treatment costs, among others, it also is cause for concern regarding animal welfare and human health (Contreras and Rodríguez 2011).
In bovines, mastitis is the only disease associated with infection by Streptococcus agalactiae, a gram-positive bacterium that is only transmitted
1997). Because of the great importance as a pathogen causing mastitis, in 2011 the first sequence was published of the complete genome of a strain of Strep. agalactiae
(FSL S3-026) isolated from a cow with clinical mastitis (Richards et al., 2011). Nevertheless, although in recent years a large variety of immunological profiles and associated responses have been described after infection of the mammary gland with gram-positive (Alluwaimi et al., 2003; Denis et al., 2006) and gram-negative bacteria (Lahouassa et al., 2007; Petzl et al., 2008), no article has specifically analyzed the response profile of zebu animals (Bos taurus indicus) when infected by Strep. agalactiae.
Among the zebuine breeds, the Gyr breed is particularly well adapted to Brazilian environmental conditions. For this reason, it has been intensely used in crosses, and is the preferred breed for the formation of crossbred dairy herds in Brazil, responsible for roughly 70% of the country’s milk production (Embrapa Gado de Leite 2005). Data from the Brazilian Association of Artificial Insemination show that in 2011 the number of semen doses sold from Gyr Dairy sires was second among dairy breeds in Brazil, only behind the Holstein breed, with this number having
increased 5β% between β009 and β011. Nevertheless, despite this breed’s
importance to the dairy industry, few studies have been published identifying genes capable of conferring resistance to mastitis in animals other than taurine breeds (Bos taurus taurus). There are indications of the existence of differences in the response
profile to clinical mastitis among Gyr, Holstein and mestizo animals (Fonseca et al., 2009, 2011). Besides this, one of the main results of the Bovine HapMap Consortium 2009 was confirmation that cattle are divided into three main groups: European, Indian and African. For this reason, the response profile to various diseases in dairy cattle should be studied among different groups and breeds, so that these responses can be adequately compared to verify the similarities, differences, response mechanisms and possible particularities of prognosis and treatment.
immune response have been indicated as likely candidates for understanding resistance and susceptibility to mastitis (Alluwaimi et al., 2003; Oviedo-Boyso et al.,
2007; Fonseca et al., 2009, 2011). An ample analysis of the orchestrated interaction of cytokines and chemokines during mastitis caused by a specific pathogen can help to better understand the regulation of the immune response in the udder to this pathogen (Schukken et al., 2011). Therefore, the identification of factors that contribute to the predisposition of the mammary gland to mastitis will facilitate the development of new strategies to control this disease, such as identification of genes that can be used as markers for resistance to mastitis in animal breeding programs.
To contribute to this effort, we applied the microarray and real-time PCR techniques for the main purpose of characterizing the gene expression in cells present in the milk of Gyr cows artificially infected with Strep. agalactiae. The aim of this characterization is to identify the genes responsible for conferring resistance to mastitis and understanding its regulation, for a better comprehension of the physiopathology of this disease. This knowledge can be used for more efficient treatment, especially in B. taurus indicus animals, where the references are scarce and limited in scope.
Material and Methods
Experimental animals
To select the animals of the experimental group, 105 Gyr dairy cows from the Getulio Vargas experimental farm of the Minas Gerais Agricultural Research Company, located in Uberaba (Minas Gerais, Brazil), were assessed regarding their history of mastitis between 2003 and 2007, order of calving and somatic cell count (SCC). Besides this, the animals were submitted to a series of three microbiological exams, and only the cows that presented a negative result to Strep. agalactiae on all three tests were selected, for a total of 17 animals, with different calving orders and at least 80 days of lactation.
Inoculation and collection of the samples
Before experimentally induced intramammary infection, the 17 cows were
submitted to clinical examination of the udder and the strip cup test after the first milking (procedure modified from Grönlund et al., 2006 and Lee et al., 2006). The cows were inoculated with strain 8137 of Strep. agalactiae, isolated in a pure culture
from the milk of a cow with subclinical mastitis sensitive to -lactam antibiotics, belonging to the microorganism collection of Embrapa Gado de Leite. The bacteria were seeded in plates containing blood agar medium, prepared with 5% defibrinated sheep blood, and afterward were transferred to brain heart infusion broth (BHI). To prepare the inoculum, the culture was diluted in 1X PBS (2.7 mM KCl; 2 mM KH2PO4; 137 mM NaCl; 10 mM Na2HPO4 pH 7.4) to a final concentration of 100 CFU/mL. The bacterial suspension was inoculated only in one mammary quarter of each cow (IQ-inoculated quarter). The other quarters were inoculated with sterile 1X PBS (NIQ-non-inoculated quarter). Milk samples were taken from the IQ before inoculation (time 0) and 24 hours after inoculation to perform the SCC and microbiological examination, to confirm the infection, and at 0, 4, 9 and 24 hours for extraction of RNA. Milk samples were also collected from the NIQ at 0 and 24 hours from each animal for RNA extraction. The milk samples were placed in isothermal boxes with ice for transport to the laboratory.
To minimize the adverse effects and assure the welfare of the animals, they
Isolation of RNA and quality control
The total RNA was extracted from the lysed milk cells with the RNeasy Mini
Kit (Qiagen, Valencia, CA, USA), like as Leutenegger et al. (2000) and Lee et al. (2006). Aliquots of 15 mL of milk were centrifuged at 6,000 g for 10 min at room temperature. The pellets were washed twice in 7.5 mL PBS, ressuspended and lysated with 350 mL of lysis buffer according to the manufacturer's recommendations. After this step, the lysates were kept at -80°C until RNA extraction. Digestion with DNase I (Qiagen) was performed to remove any contamination with genomic DNA. The concentrations of the samples were determined with a NanoDrop ND-1000 spectrophotometer (NanoDrop Technologies, Wilmington, DE, USA) and the quality of the total RNA was evaluated with an Agilent 2100 Bioanalyzer (Agilent, Palo Alto, CA, USA). As a procedure for standardization of RNA quality control, the average value of RIN (RNA integrity number) was 8. All the samples were stored at -80 ºC until use.
Large-scale gene expression experiments
Aliquots of the total RNA quantified and evaluated to assure integrity were hybridized with an Affymetrix GeneChip Bovine Genome Array chip (Affymetrix, Santa Clara, CA, USA). This chip contains over 23,000 bovine transcripts (the complete list can be accessed at http://www.affymetrix.com/support/technical/
byproduct.affx?product=bovine). A GeneChip 3000 7G scanner (Affymetrix) was used to capture the images corresponding to the signal intensity from the hybridization, operated with the GeneChip Command Console software, and the Expression Console software(Affymetrix) was used to determine the hybridization quality. Computational packages from R (R Development Core Team, 2012) were used to search for differentially expressed genes. The affy, simpleaffy and affyQCReport packages, part of the Bioconductor project (Gentleman et al., 2004),
available at http://bioconductor.org/biocLite.R, were used for quality control of each chip. Besides this, to achieve greater quality control and for pre-processing (transformation, background correction and summarization), of the data from the GeneChip, the RMAExpress freeware was used, available at http://rmaexpress.bmbolstad.com.
as well as those that presented low correlation of the level of expression with other arrangements of the same experimental treatment) were eliminated from the analysis.
Tests were performed to compare the level of gene expression of the animals at each sampling time, for a total of six contrasts for the IQ (0 h x 4 h; 0 h x 9 h; 0 h x 24 h; 4 h x 9 h; 4 h x 24 h; 9 h x 24 h) and the interaction between treatment and expression of a determined gene was analyzed using the Maanova package (Wu et al., 2003). These analyses relied on the mixed model approach in two steps proposed by Wolfinger et al. (2001), with array and sample as random effects and treatment (time after infection), gene and gene by treatment interaction as fixed effects. The significance tests were based on a t-test regularized by applying the James-Stein concept (Cui et al., 2005) with critical values defined by 500 permutations of the data. The p-values were then adjusted to control the rate of false discoveries by the method of Storey (2002).
Finally, to visualize the gene expression profiles of the genes differentially expressed over time (0, 4, 9 and 24 hours), we constructed a Heatmap of the summarized expressions of each gene at each of the times using the R software and its Heatplus package (http://www.bioconductor.org/packages/2.10/bioc/html/ Heatplus.html). The summarized expression of each gene was obtained by using the median value corresponding to each of the times, rescaled to have mean zero and standard deviation of one. To construct the hierarchical cluster of genes, associated
with the Heatmap, we used absolute correlation as the measure of dissimilarity and the average linkage clustering strategy.
Validation of the genes differentially expressed by real-time PCR
Among the genes identified as differentially expressed in the microarray experiment, we selected eight for validation by real-time PCR because they perform important functions in the immune response (AATK - apoptosis-associated tyrosine kinase; CCL2- chemokine C-C motif ligand 2; CCL20 - chemokine C-C motif ligand
20; CD40 - CD40 molecule; CSF2 - colony stimulating factor 2; IL-1 - interleukin 1 ; INHBA - inhibin beta A; and NOS2A - nitric oxide synthase 2A). Besides these eight genes, we evaluated the expression of six others by real-time PCR, even though they did not present a significant difference by the microarray technique (IL-12 - interleukin 12; IL-17 - interleukin 17; TLR-2 - Toll-like receptor 2; TLR-4 - toll-like
factor 1). We analyzed these genes’ expression because according to some
published articles, they can have important functions in the immune response to
mastitis (Riollet et al., 2006; Lahouassa et al., 2007; Oviedo-Boyso et al., 2007). For the real-time PCR, the first strand cDNA was synthesized with the SuperScript III First-Strand Synthesis System for RT-PCR (Invitrogen, Carlsbad, CA, USA), which includes RNase H. Reverse transcription was carried out on a control sample, which contained a mix of all the RNA samples extracted and all the components of the kit, except the SuperScript III RT enzyme, to confirm the absence of any contamination by genomic DNA during the real-time PCR. The cDNA synthesized was then stored at -20 ºC until use.
The real-time PCR reactions were performed with the SYBR Green PCR Master Mix kit (Applied Biosystems, Foster City, CA, USA). The reactions were performed twice for each sample and amplified with the 7300 Real-Time PCR System (Applied Biosystems). Each reaction contained cDNA, a pair of primers (a concentration was optimized for each target) and PCR Master Mix in a final volume
of β5 μL. A mixture containing all the PCR components, without cDNA, was used as
a negative control for each reaction, besides the reverse transcription control, in which the sample that did not contain the SuperScript III RT enzyme was used as a template in the real-time PCR. The amplification conditions were 2 minutes at 50 ºC, 10 minutes at 95 ºC, followed by 40 cycles of 15 seconds at 95 ºC and 1 minute at 60
ºC. At the end of each reaction, a denaturation curve was plotted to assure that each reaction produced a single fragment, that is, the curve contained only one dissociation peak.
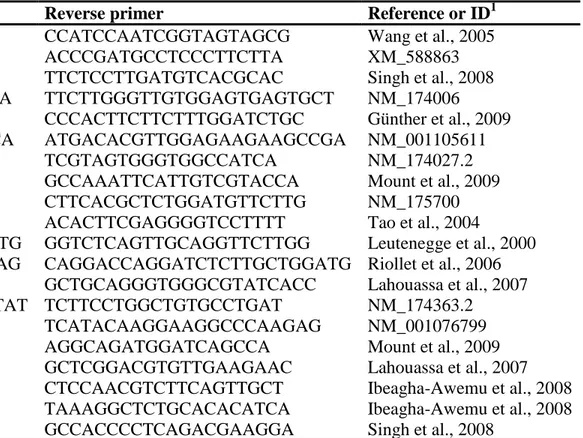
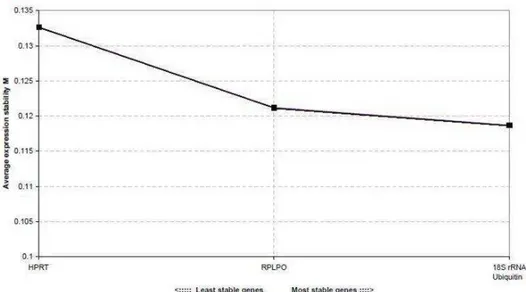
The primers used to evaluate the expression of the genes are listed in Table 1. They were designed using the Primer Express program (Applied Biosystems) from the sequences obtained in the GenBank (http://www.ncbi.nlm.nih.gov) or data in the literature. The genes GAPDH (glyceraldehyde-3-phosphate dehydrogenase), -actin, 18S rRNA, Ubiquitin, RPLP0 (ribosomal protein large P0) and HPRT
(hypoxanthine-guanine phosphoribosyltransferase) were tested for endogenous control. All the endogenous controls were evaluated regarding the shape of the
two endogenous controls considered the most stable were Ubiquitin and RPLP0, as can be seen in Figure 1.
By the real-time PCR technique, besides the contrasts in the microarray analyses for the IQ (0 h x 4 h; 0 h x 9 h; 0 h x 24 h; 4 h x 9 h; 4 h x 24 h; 9 h x 24 h), three other contrasts were considered for the NIQ (0 h NIQ x 0 h IQ; 0 h NIQ x 24 h NIQ; 24 h NIQ x 24 h IQ). The cycle threshold (Ct) data obtained during the real-time PCR were exported to an Excel spreadsheet and analyzed with the REST 2009 program, developed by M. Pfaffl (Munich Technical University) and Qiagen, to obtain data on reaction frequency and to compare the difference in expression between treatments. This program can be downloaded from http://www.qiagen.com/products/rest2009software.aspx#Tabs=t2 and permits analysis of the differential expression with efficiency correction for each gene and with normalization for more than one endogenous control, besides being adequate for data whose variance can be large and that are not normally distributed. The coefficient of variation of the duplicates of the Ct of each sample did not exceed 5% and the amplification efficiency of all the genes considered in this study were close (data not shown).
Construction and analysis of the gene networks
The data obtained from the hybridization of the microarrays were also
analyzed using the Weighted Gene Co-expression Network Analysis (WGCNA) method (Langfelder and Horvath 2008). WGCNA is a method that identifies correlation patterns between genes and has been widely used to find clusters (called modules) of highly correlated (or co-expressed) genes, which can be involved in a single biological process. Therefore, the groups of genes that are differentially co-expressed or genes that are differentially connected between two groups are identified. These changes in the co-expression or connectivity pattern can correspond to a response to environmental variations or physiological disturbances.
R software, and then these networks were compared to identify the modules not conserved between the two groups.
Results
The microbiological analysis of the milk samples from all the animals revealed the presence of Strep. agalactiae in the IQ 24 hours after intramammary inoculation, and there was a sharp increase in the SCC between 0 and 24 hours, which can be observed in Figure 2, supported by the Mann-Whitney test with P < 0.001. These results assure that the experimental infections were successful. Furthermore, all the cows presented clinical mastitis 24 hours after intramammary inoculation.
Of the 68 RNA samples extracted, 48 were selected according to the RNA quality for hybridization in the microarray chips. Of these, 21 were considered of poor or marginal quality regarding the percentage of present transcripts, background level, integrity of the endogenous control genes and RNA degradation, according to the statistics generated by the Bioconductor and RMAExpress packages. Hence, just 27 arrays that have passed all quality control checks were considered in the subsequent statistical analyses, remaining 12, eight, four and three chips for times 0, 4, 9 and 24 hours, respectively.
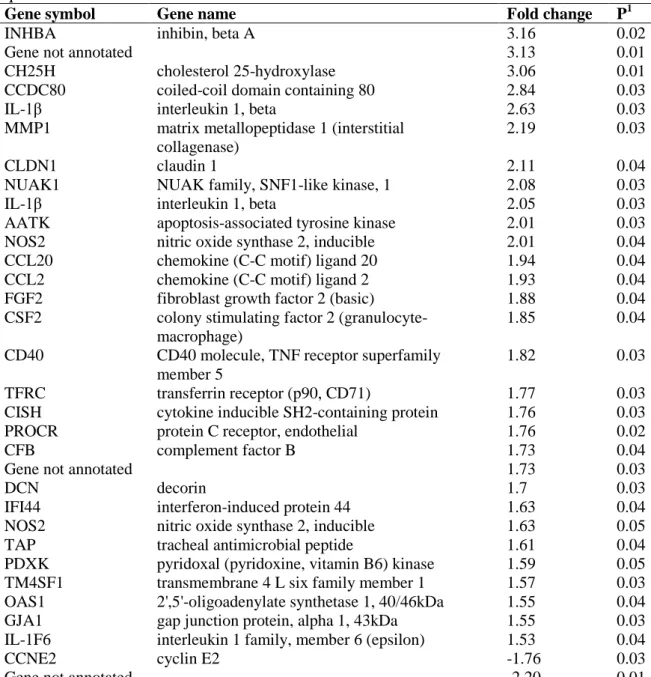
All told, 32 transcripts presented difference in the expression level (P < 0.05)
in the IQ when analyzed by the microarray technique. However, differences in the expression level were only identified between 0 and 4 hours of the IQ samples, as can be observed in Table 2.
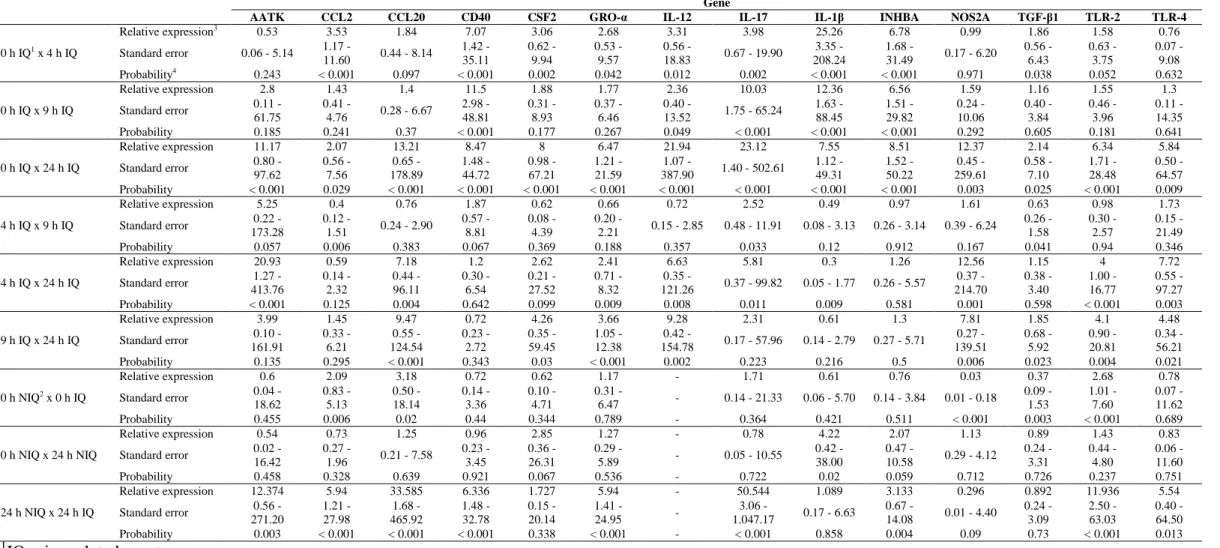
In the real-time PCR analysis, all the genes presented a significant difference (P < 0.05) in at least one of the comparisons made, as shown in Table 3. Besides this, the genes presented a similar expression profile by microarray and real-time PCR, i.e., the eight genes with significant expression difference by microarray had their expression increased at 4 hours in relation to hour 0, a condition confirmed by the real-time PCR technique in the samples collected from the IQ.
characteristics. Those in the first module (BTG3, CD3E, MBD1, CHIC2, PLXNA3, MOCS3, NEIL1, VPS45 and BCL2) were related to apoptosis and to antigen
recognition. The second module was enriched in inflammatory mediators, including genes considered to be markers of mastitis (FGL1, GJA1, F2RL1, PTPRF, S100A2, TGF- β), while the third module included genes involved in cell division and inflammatory responses (CD97, MAD2L1, ZFP106, CDKN2C, LOC514364, NOP14, PCBD1, LOC100139798, AP1S1, EDN1, IL-1 , ANXA11).
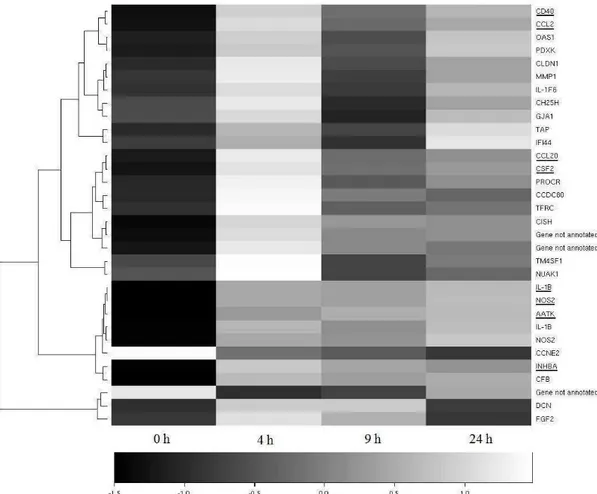
Figure 3 contains the Heatmap of the expression profiles of the differentially expressed genes, obtained by the microarray technique. As can be observed, the greatest expression difference among the genes identified by this technique occurred in the first four hours after infection, with the majority of the genes being upregulated at hour 4. In general, the differentially expressed genes showed an increase in expression in the first four hours after inoculation, and soon afterward the level of expression declined, in some cased gradually, such as DCN (decorin) and FGF2 (fibroblast growth factor 2), and in others abruptly, like CH25H (cholesterol
25 hydroxylase) and GJA1 (gap junction protein alpha 1). Other genes maintained relatively constant expression level after the four-hour mark, such as IL-1 and NOS2.
In the present study, we noted that NOS2A gene’s expression is altered following experimentally induced infection by Strep. agalactiae, with the expression
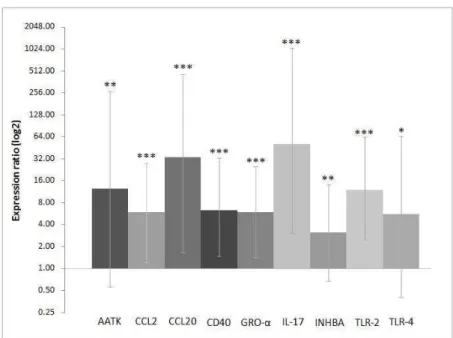
Among the differentially expressed genes by the real-time PCR, both the TLR-2 and TLR-4 genes showed a significant increase in the expression level (about
six-fold) between 0 and 24 hours (P < 0.001 and P < 0.01, respectively), as can be observed in Figure 4b and Table 3. This difference also was observed between 4 and 24 hours, with the same probability values, and also between 9 and 24 hours (P < 0.01 and P < 0.05, respectively), showing there was a gradual increase in the expression of these genes up to 24 hours after inoculation of the pathogen (Figure 4b). This situation is even more evident when comparing the NIQ with the IQ in Figure 5, in both cases 24 hours after inoculation, showing greater expression of TLR-2 and TLR-4 in the IQ (P < 0.001 and P < 0.05, respectively), i.e., at the
infection site.
In general there was an increase in the expression of TGF- 1 at all times analyzed in relation to hour 0, with a significant difference (P < 0.05) in the 0 h x 4 h and 0 h x 24 h contrasts for the IQ (Table 3). At 9 hours, there was a decline in the levels of TGF- 1, which then increased at 24 hours, a fact shown by the twofold
increase in this gene’s expression (P < 0.05 - Figure 4b and Table 3). For this reason, there was downregulation between 4 and 9 hours (P < 0.05) and no significant difference between 0 and 9 hours (P > 0.05).
We noted a significant twofold increase in the expression of IL-1 gene by the microarray technique 4 hours after inoculation (P < 0.05 - Table 2), a finding validated by real-time PCR, in which IL-1 presented 25 times greater expression in the same time frame (P < 0.001 - Table 3). However, this difference in the level of expression diminished with time passed thereafter, being 12 times higher after 9 hours (P < 0.001) and 8 times higher after 24 hours (P < 0.001) (Table 3 and Figure 4a). Therefore, between 4 hours and 24 hours after inoculation, the expression of IL-1 decreased by a factor of 3 (P < 0.01), but it was still 8 times higher than before experimentally induced intramammary infection. We also noted a difference in the expression of this cytokine between hours 0 and 24 from the samples collected from the NIQ (approximately four times greater, P < 0.05 - Table 3). However, the difference was greater (about eight times) in the milk from the IQ (P < 0.001), showing that the main expression of IL-1 occurs at the infection site (Figure 4a and Table 3).
nearly all the contrasts (P < 0.05), except between 9 and 24 hours, despite showing a trend to continue increasing (Table γ and Figure 4b). This cytokine’s expression
increased up to 23 times between 0 and 24 hours in the IQ samples (P < 0.001), but this gene did not present a significant difference in the microarray analyses.
We noted that the expression of GRO-α increased at hour 4 in relation to hour 0 and at hour 24 in relation to hours 0, 4 and 9, with the greatest difference being between 0 and 24 hours, in which the expression was nearly seven times higher (P < 0.001 - Table 3 and Figure 4a). Another cytokine, IL-12, presented increased expression by real-time PCR at hours 4, 9 and 24 in relation to hour 0 and at hour 24 in relation to hours 4 and 9. Only not presenting a significant difference (P > 0.05) between hours 4 and 9 (Table 3 and Figure 4b). Along with IL-17, IL-12 was one of the cytokines that presented the highest expression levels at hour 24, about 22 times higher than at hour 0 (P < 0.001).
Both the microarray and real-time PCR analyses revealed variations in the expression of the mRNA from the chemokines CCL2 and CCL20 (Tables 2 and 3). The expression profile of CCL2 was very similar to that of TGF- 1, with reduced expression at hour 9 in relation to the base level of this chemokine, but with predominance of higher expression levels in relation to hour 0 during the entire period of the experiment (Figure 4a). A similar profile was also observed for the CCL20 gene, but its peak expression occurred at hour 24, while the peak of CCL2
happened at hour 4 (Figure 4a).
In general we observed a significant difference (P < 0.05) in the expression of five genes among the samples from the IQ and NIQ before inoculation (Table 3 and Figure 6) and nine genes considered in this study 24 hours after inoculation between the IQ and NIQ (Table 3 and Figure 5).
Discussion
network analysis show there are mechanisms that were altered in the Gyr cows after infection of the mammary gland by Strep. agalactiae.
Toll-like receptors play a major role in the innate immunity of the mammary gland against pathogenic microorganisms. The discovery these receptors and their function in the immune response opened a new field of study to better understand the primary immune response of the mammary gland (Schukken et al., 2011). These Toll-like receptors, located in the endosomal membrane, recognize the structures of lipopolysaccharides (LPS), peptidoglycan (PGN) and lipoteichoic acid (LTA), which constitute the pathogen-associated molecular patterns (PAMPs) of both gram-positive and gram-negative bacteria. TLR-4 recognizes LPS from gram-negative bacteria while TLR-2 recognizes the LTA and PGN present in gram-positive bacteria, such as Strep. agalactiae (Oviedo-Boyso et al., 2007). Recognition of the pathogen is the critical first step to mount an effective immune defense against the invading microorganism (Rinaldi et al., 2010). When activated, each TLR triggers a signaling route, leading to activation and development of a specific immune response
to each pathogen (O’Neill β006), increasing the expression of these types of
receptors (Petzl et al., 2008). In the mammary gland, the immune system cells, together with the epithelium cells, are activated through recognition of the PAMPs of the invading microorganism via TLRs (Rainard and Riollet 2006; Griesbeck-Zilch et al., 2008). As in the present study, Goldammer et al. (2004) found an increase in the
expression of both TLR-2 and TLR-4 in udders infected with Staphylococcus aureus, a gram-positive bacterium, as is Strep. agalactiae and suggested that the expression of these two receptors is regulated jointly during the start of the immune response in the udder. Other authors have also observed an increase in the expression of TLR-2 and TLR-4 in mammary tissue after experimental in vivo infection with Escherichia coli (Petzl et al., 2008), and when mammary cells are exposed in vitro to E. coli
inactivated by heat (Griesbeck-Zilch et al., 2008). The activation of Toll-like receptors leads to the expression of inflammatory cytokines and other mediators involved in the immune response, cell differentiation and apoptosis (Ibeagha-Awemu et al., 2008; Yang et al., 2008; Cates et al., 2009).
of NOS2A in mammary tissue infected by Staph. aureus, while Günther et al. (2009) noted the same effect when the infection was caused by E. coli. The CD40 gene is a
member of the superfamily of tumor necrosis factor (TNF) receptors and codifies a protein cell membrane receptor that has a synergetic role in the signaling triggered by Toll-like receptors. Because this gene is a co-stimulator of both T and B lymphocytes, our result can indicate that these lymphocytes were stimulated during the experimental period. Other studies have shown that the interaction between CD40 and its ligand (CD154) is an essential mechanism to activate regulatory B cells, i.e., producers of IL-10 (Mauri and Bosma 2012). In cattle, the B cells stimulated via CD40 and in the presence of TGF- and IL-2 increase the production of IgA (Estes et al., 1998), an important antibody isotype that is responsible for immunity of the mucosa, of which the lactating mammary gland is part (Fagarasan and Honjo 2004; Brandtzaeg, 2010).
Although inflammation is an essential component of the host’s response to
intramammary infection, a prolonged inflammatory response can damage the mammary secretory epithelium and cause a permanent reduction in milk production (Long et al., 2001; Paape et al., 2003). In this context, the participation of anti-inflammatory cytokines such as IL-10 and members of the TGF- family (Grutz 2005) is extremely important to minimize the effects of inflammatory cytokines. In agreement with our results, Chockalingam et al. (2005) noted an increase in the
expression of the protein TGF- 1 in milk from cows with udders infected with E. coli, while Bannerman et al. (2005) found the same effect when the mastitis was
2011). For this reason, we expected there to be an increase in the expression of this gene with the increase in the number of somatic cells.
The INHBA gene is a ligand of the TGF- superfamily (Gaddy-Kurten et al., 1995) and also has a function related to apoptosis, as does the AATK gene. Sheffield (1997) found that induction of apoptosis in the mammary gland after experimental infection with Strep. agalactiae, could explain the increase in the expression of these genes. It is known that damage to the mammary tissue can be induced by apoptosis or necrosis (Zhao and Lacasse 2008), and curiously, when there is an increase in the number of apoptotic cells there is also a higher proliferation of epithelial cells, which can be a mechanisms to maintain alveolar integrity (Kerr and Wellnitz 2003).
IL-1 is one of the most important inflammatory cytokines because it acts as a mediator of both the systemic and local immune response (Schukken et al., 2011). Our results shows the importance of this cytokine in the immediate response to mastitis in Gyr dairy cows, with its expression peaking four hours after infection. These results are in agreement with the findings of Strandberg et al. (2005) who showed that the expression of the mRNA of IL-1 increased rapidly in the first two hours after in vitro stimulation of mammary epithelial cells by LPS or LTA. However, this level remained relatively stable thereafter until the cells were stimulated by LPS (a component of gram-negative bacteria) and reduced gradually when they were stimulated by LTA (present in gram-positive bacteria such as Strep. Agalactiae). Lahouassa et al. (2007) also observed peak expression of IL-1 in the first hours after infection (3 hours) when mammary epithelial cells were stimulated with different strains of Staph. aureus. However when these cells were stimulated in vitro with E. coli, the peak expression of this cytokine occurred at 24 hours
prostaglandins and leukocytes, which increase the inflammatory reaction at the site (Oviedo-Boyso et al., 2007).
According to Kolls et al. (2008), pro-inflammatory cytokines like IL-1 can facilitate induction of the TH17 response, which in turn induces the antimicrobial response by epithelial cells and recruits neutrophils and dendritic cells. The TH17 cells, when in contact with antigens at the infection site, are stimulated to synthesize and release cytokines such as IL-17. Originally IL-17 was considered to be a cytokine able to induce inflammation mediated by neutrophils only in acquired immunity, but today it is considered very important both in innate and acquired immunity (Matsuzaki and Umemura 2007). The pro-inflammatory nature of this cytokine has been related to various inflammatory reactions, and in the mammary gland of cattle it is possibly related to the recruitment of neutrophils in the presence of chronic infection caused by Staph. aureus (Riollet et al., 2006). In vivo studies conducted by Tao and Mallard (2007) also show the transcription of IL-17 induced by Staph. aureus in mammary gland cells. Other cytokine, the IL-12, a mediator between innate and acquired immunity, is produced by T lymphocytes and dendritic cells. This protein regulates the differentiation of T lymphocytes and acts as an endogenous adjuvant in the recruitment of neutrophils, which upon arriving at the infection site phagocytose the invading bacteria and release antibacterial peptides, among other compounds (Oviedo-Boyso et al., 2007). Our results corroborate the
idea that IL-17 and IL-12 also have a pro-inflammatory function during bovine mastitis caused by Strep. agalactiae in zebu animals
IL-17 induces cells such as fibroblasts, epithelial cells and keratinocytes to secrete various cytokines, among them CSF, that stimulates the bone marrow to increase the production of neutrophils and macrophages (Ye et al., 2001); and
GRO-α (Riollet et al., β006) which acts to mobilize neutrophils and is produced by a
variety of cells after stimulation with LPS, IL-1 and TNF. Lahouassa et al. (2007) also observed an increased expression of GRO-α in mammary epithelial cells stimulated with different strains of Staph. aureus and E. coli. However, the peak production of this cytokine observed by those authors happened 3 hours after infection with the different strains of Staph. aureus and 24 hours after infection by E. coli, a similar pattern to that found here with Strep. agalactiae, in which the peak
response to mastitis, making it necessary to study the gene expression in response to mastitis caused by different species of pathogens, both in taurine and zebuine
animals.
Chemokines are a specific class of cytokines that mediate the recruitment of effector cells to the inflammation site. CCL2 is the key chemokines for recruitment of monocytes which compose the second line of cellular immune defense. It is important for innate immunity and also helps initiate the humoral immune response (Schukken et al., 2011). Only a few studies have reported inflammation induced by the increased expression of CCL2 in the udder and mammary epithelial cells (Strandberg et al., 2005; Lutzow et al., 2008; Mount et al., 2009). The present study presents the first report of an increase in the expression of this gene during mastitis caused by Strep. agalactiae in zebuine cattle. CCL20 is a chemokine that interacts with the CCR6 receptor (Schutyser et al., 2003) and the CCL20-CCR6 pair is responsible for the chemoattraction of immature dendritic cells, T effector cells and B cells. The recruitment of these cell types provides the link to the humoral immune response (Schukken et al., 2011). Other studies have also revealed an increase in the expression of CCL20 in the udder and mammary epithelial cells infected by E. coli (Günther et al., 2009, 2010).
There was clear individual variation among the animals, because some presented much greater changes in the number of somatic cells than others. This
reason for the difference in expression between the inoculated and non-inoculated quarters at hour 0. In turn, the difference in the expression of the genes considered in
this study 24 hours after inoculation between the IQ and NIQ can be an indication that the genes AATK, CCL2, CCL20, CD40, GRO-α, IL-17, INHBA, 2 and TLR-4 are mainly expressed at the infection site, at the place of action of their products.
During bacterial infection of the bovine mammary gland, a large number of leukocytes migrate to the udder to establish the response against the pathogen. However, the population of leukocytes that mediate this immune response is not yet well defined (Schukken et al., 2011). Studies of gene expression related to the immune response can help to better characterize this population and to understand how the host responds to a determined pathogenic microorganism. Besides this, the protective immunity of the bovine mammary gland against natural infection by bacteria is relatively brief, only lasting a few weeks (Suojala et al., 2008; Schukken et al., 2009). This incapacity of long-term defense against natural infection poses a significant challenge to the development of effective vaccines against mastitis (Schukken et al., 2011). Once again, the knowledge generated by studies of the expression of candidate genes can help in the selection of better adapted and more productive animals, enabling a reduced need to administer drugs, with consequent reduction of production costs and levels of contamination of dairy products and the environment.
In this study it was possible to verify changes in the expression of at least 14 genes related to the immune response of zebuine animals against mastitis caused by Strep. agalactiae. These genes can play important roles in fighting intramammary
infection and maintaining the tissue during infection. However, besides carrying out proteomic studies, it is necessary to validate these results in other biological models to identify which tissues and mechanisms are involved in the response to infection. After this validation, the gene structure will be more useful in the identification of marker SNPs for the phenotypes for resistance and susceptibility to mastitis in Gyr animals.
Acknowledgments
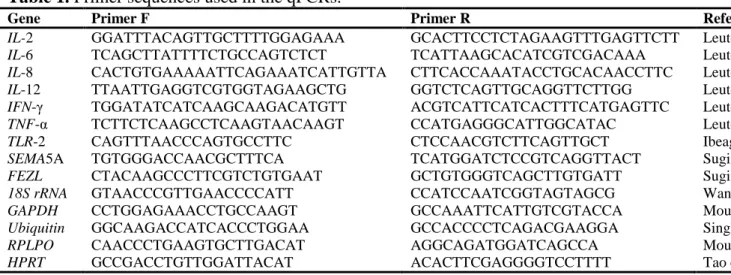
Table 1. Sequences of primers employed in the real-time PCR
Gene Forward primer Reverse primer Reference or ID1
18S rRNA GTAACCCGTTGAACCCCATT CCATCCAATCGGTAGTAGCG Wang et al., 2005
AATK TGGTGGCCGTGTCCTTCT ACCCGATGCCTCCCTTCTTA XM_588863
-actin CGCACCACTGGCATTGTCAT TTCTCCTTGATGTCACGCAC Singh et al., 2008
CCL2 AGTCACCAGCAGCAAGTGTCCTAA TTCTTGGGTTGTGGAGTGAGTGCT NM_174006
CCL20 CAGCAAGTCAGAAGCAAGCAA CCCACTTCTTCTTTGGATCTGC Günther et al., 2009
CD40 AGGGCACCTTGAATACAGACACCA ATGACACGTTGGAGAAGAAGCCGA NM_001105611
CSF2 CTCGCCTGAAGCTGTACAAGAA TCGTAGTGGGTGGCCATCA NM_174027.2
GAPDH CCTGGAGAAACCTGCCAAGT GCCAAATTCATTGTCGTACCA Mount et al., 2009
GRO-α CGCCTGTGGTCAACGAACT CTTCACGCTCTGGATGTTCTTG NM_175700
HPRT GCCGACCTGTTGGATTACAT ACACTTCGAGGGGTCCTTTT Tao et al., 2004
IL-12 TTAATTGAGGTCGTGGTAGAAGCTG GGTCTCAGTTGCAGGTTCTTGG Leutenegge et al., 2000
IL-17 AGATATCCCTCTGTGATCTGGGAAG CAGGACCAGGATCTCTTGCTGGATG Riollet et al., 2006
IL-1 CTCTCACAGGAAATGAACCGAG GCTGCAGGGTGGGCGTATCACC Lahouassa et al., 2007
INHBA GGAGGGCAGAAATGAATGAACTTAT TCTTCCTGGCTGTGCCTGAT NM_174363.2
NOS2A TTGATTGCACCGCTTGGA TCATACAAGGAAGGCCCAAGAG NM_001076799
RPLPO CAACCCTGAAGTGCTTGACAT AGGCAGATGGATCAGCCA Mount et al., 2009
TGF- 1 CCTGAGCCAGAGGCGGACTAC GCTCGGACGTGTTGAAGAAC Lahouassa et al., 2007
TLR-2 CAGTTTAACCCAGTGCCTTC CTCCAACGTCTTCAGTTGCT Ibeagha-Awemu et al., 2008
TLR-4 ACTGCAGCTTCAACCGTATC TAAAGGCTCTGCACACATCA Ibeagha-Awemu et al., 2008
Ubiquitin GGCAAGACCATCACCCTGGAA GCCACCCCTCAGACGAAGGA Singh et al., 2008
1
Table 2. Genes differentially expressed by the microarray technique in the inoculated quarters
Gene symbol Gene name Fold change P1
INHBA inhibin, beta A 3.16 0.02
Gene not annotated 3.13 0.01
CH25H cholesterol 25-hydroxylase 3.06 0.01
CCDC80 coiled-coil domain containing 80 2.84 0.03
IL-1 interleukin 1, beta 2.63 0.03
MMP1 matrix metallopeptidase 1 (interstitial collagenase)
2.19 0.03
CLDN1 claudin 1 2.11 0.04
NUAK1 NUAK family, SNF1-like kinase, 1 2.08 0.03
IL-1 interleukin 1, beta 2.05 0.03
AATK apoptosis-associated tyrosine kinase 2.01 0.03
NOS2 nitric oxide synthase 2, inducible 2.01 0.04
CCL20 chemokine (C-C motif) ligand 20 1.94 0.04
CCL2 chemokine (C-C motif) ligand 2 1.93 0.04
FGF2 fibroblast growth factor 2 (basic) 1.88 0.04
CSF2 colony stimulating factor 2 (granulocyte-macrophage)
1.85 0.04
CD40 CD40 molecule, TNF receptor superfamily member 5
1.82 0.03
TFRC transferrin receptor (p90, CD71) 1.77 0.03
CISH cytokine inducible SH2-containing protein 1.76 0.03
PROCR protein C receptor, endothelial 1.76 0.02
CFB complement factor B 1.73 0.04
Gene not annotated 1.73 0.03
DCN decorin 1.7 0.03
IFI44 interferon-induced protein 44 1.63 0.04
NOS2 nitric oxide synthase 2, inducible 1.63 0.05
TAP tracheal antimicrobial peptide 1.61 0.04
PDXK pyridoxal (pyridoxine, vitamin B6) kinase 1.59 0.05
TM4SF1 transmembrane 4 L six family member 1 1.57 0.03
OAS1 2',5'-oligoadenylate synthetase 1, 40/46kDa 1.55 0.04
GJA1 gap junction protein, alpha 1, 43kDa 1.55 0.03
IL-1F6 interleukin 1 family, member 6 (epsilon) 1.53 0.04
CCNE2 cyclin E2 -1.76 0.03
Gene not annotated -2.20 0.01
1
Table 3. Relative expression by the real-time PCR technique
Gene
AATK CCL2 CCL20 CD40 CSF2 GRO-α IL-12 IL-17 IL-1β INHBA NOS2A TGF-β1 TLR-2 TLR-4
0 h IQ1 x 4 h IQ
Relative expression3 0.53 3.53 1.84 7.07 3.06 2.68 3.31 3.98 25.26 6.78 0.99 1.86 1.58 0.76
Standard error 0.06 - 5.14 1.17 -
11.60 0.44 - 8.14
1.42 - 35.11 0.62 - 9.94 0.53 - 9.57 0.56 -
18.83 0.67 - 19.90
3.35 - 208.24
1.68 -
31.49 0.17 - 6.20
0.56 - 6.43 0.63 - 3.75 0.07 - 9.08
Probability4 0.243 < 0.001 0.097 < 0.001 0.002 0.042 0.012 0.002 < 0.001 < 0.001 0.971 0.038 0.052 0.632
0 h IQ x 9 h IQ
Relative expression 2.8 1.43 1.4 11.5 1.88 1.77 2.36 10.03 12.36 6.56 1.59 1.16 1.55 1.3
Standard error 0.11 -
61.75
0.41 -
4.76 0.28 - 6.67
2.98 - 48.81 0.31 - 8.93 0.37 - 6.46 0.40 -
13.52 1.75 - 65.24
1.63 - 88.45 1.51 - 29.82 0.24 - 10.06 0.40 - 3.84 0.46 - 3.96 0.11 - 14.35
Probability 0.185 0.241 0.37 < 0.001 0.177 0.267 0.049 < 0.001 < 0.001 < 0.001 0.292 0.605 0.181 0.641
0 h IQ x 24 h IQ
Relative expression 11.17 2.07 13.21 8.47 8 6.47 21.94 23.12 7.55 8.51 12.37 2.14 6.34 5.84
Standard error 0.80 -
97.62 0.56 - 7.56 0.65 - 178.89 1.48 - 44.72 0.98 - 67.21 1.21 - 21.59 1.07 -
387.90 1.40 - 502.61
1.12 - 49.31 1.52 - 50.22 0.45 - 259.61 0.58 - 7.10 1.71 - 28.48 0.50 - 64.57
Probability < 0.001 0.029 < 0.001 < 0.001 < 0.001 < 0.001 < 0.001 < 0.001 < 0.001 < 0.001 0.003 0.025 < 0.001 0.009
4 h IQ x 9 h IQ
Relative expression 5.25 0.4 0.76 1.87 0.62 0.66 0.72 2.52 0.49 0.97 1.61 0.63 0.98 1.73
Standard error 173.28 0.22 - 0.12 - 1.51 0.24 - 2.90 0.57 - 8.81 0.08 - 4.39 0.20 - 2.21 0.15 - 2.85 0.48 - 11.91 0.08 - 3.13 0.26 - 3.14 0.39 - 6.24 0.26 - 1.58 0.30 - 2.57 0.15 - 21.49
Probability 0.057 0.006 0.383 0.067 0.369 0.188 0.357 0.033 0.12 0.912 0.167 0.041 0.94 0.346
4 h IQ x 24 h IQ
Relative expression 20.93 0.59 7.18 1.2 2.62 2.41 6.63 5.81 0.3 1.26 12.56 1.15 4 7.72
Standard error 1.27 -
413.76 0.14 - 2.32 0.44 - 96.11 0.30 - 6.54 0.21 - 27.52 0.71 - 8.32 0.35 -
121.26 0.37 - 99.82 0.05 - 1.77 0.26 - 5.57
0.37 - 214.70 0.38 - 3.40 1.00 - 16.77 0.55 - 97.27
Probability < 0.001 0.125 0.004 0.642 0.099 0.009 0.008 0.011 0.009 0.581 0.001 0.598 < 0.001 0.003
9 h IQ x 24 h IQ
Relative expression 3.99 1.45 9.47 0.72 4.26 3.66 9.28 2.31 0.61 1.3 7.81 1.85 4.1 4.48
Standard error 161.91 0.10 - 0.33 - 6.21 124.54 0.55 - 0.23 - 2.72 0.35 - 59.45 1.05 - 12.38 154.78 0.42 - 0.17 - 57.96 0.14 - 2.79 0.27 - 5.71 139.51 0.27 - 0.68 - 5.92 0.90 - 20.81 0.34 - 56.21
Probability 0.135 0.295 < 0.001 0.343 0.03 < 0.001 0.002 0.223 0.216 0.5 0.006 0.023 0.004 0.021
0 h NIQ2 x 0 h IQ
Relative expression 0.6 2.09 3.18 0.72 0.62 1.17 - 1.71 0.61 0.76 0.03 0.37 2.68 0.78
Standard error 0.04 -
18.62 0.83 - 5.13 0.50 - 18.14 0.14 - 3.36 0.10 - 4.71 0.31 -
6.47 - 0.14 - 21.33 0.06 - 5.70 0.14 - 3.84 0.01 - 0.18
0.09 - 1.53 1.01 - 7.60 0.07 - 11.62
Probability 0.455 0.006 0.02 0.44 0.344 0.789 - 0.364 0.421 0.511 < 0.001 0.003 < 0.001 0.689
0 h NIQ x 24 h NIQ
Relative expression 0.54 0.73 1.25 0.96 2.85 1.27 - 0.78 4.22 2.07 1.13 0.89 1.43 0.83
Standard error 0.02 -
16.42
0.27 -
1.96 0.21 - 7.58
0.23 - 3.45
0.36 - 26.31
0.29 -
5.89 - 0.05 - 10.55
0.42 - 38.00
0.47 -
10.58 0.29 - 4.12
0.24 - 3.31 0.44 - 4.80 0.06 - 11.60
Probability 0.458 0.328 0.639 0.921 0.067 0.536 - 0.722 0.02 0.059 0.712 0.726 0.237 0.751
24 h NIQ x 24 h IQ
Relative expression 12.374 5.94 33.585 6.336 1.727 5.94 - 50.544 1.089 3.133 0.296 0.892 11.936 5.54
Standard error 0.56 -
271.20 1.21 - 27.98 1.68 - 465.92 1.48 - 32.78 0.15 - 20.14 1.41 -
24.95 -
3.06 -
1.047.17 0.17 - 6.63
0.67 -
14.08 0.01 - 4.40
0.24 - 3.09 2.50 - 63.03 0.40 - 64.50
Probability 0.003 < 0.001 < 0.001 < 0.001 0.338 < 0.001 - < 0.001 0.858 0.004 0.09 0.73 < 0.001 0.013
1
IQ = inoculated quarter. 2
NIQ = non-inoculated quarter. 3
Numbers greater than 1 = higher expression at the second time; numbers less than 1 = higher expression at the first time. 4
Fig. 1 Estimate of the M stability of the five genes tested as endogenous controls
carried out in geNorm. In this analysis, the variation of expression and stability of each gene were calculated, given by an M stability value, which is inversely proportional to the variation in expression of the particular gene.
Fig. 2 Result of the somatic cell count (SCC) of the 17 cows at the time of
Fig. 3 Heatmap of the expression profiles of the differentially expressed genes by the
microarray technique. The darker color represents the downregulated genes and the lighter color the upregulated genes. The underlined genes are those whose expression was validated by real-time PCR.
Fig. 4 Ratio of the gene expression at 4, 9 and 24 hours after inoculation of the strain
Fig. 5 Expression level of the genes with statistical difference 24 hours after
inoculation with the Streptococcus agalactiae strain from the inoculated quarter (IQ) in relation to the non-inoculated quarter (NIQ) (* P < 0.05; ** P < 0.01; *** P < 0.001).
Fig. 6 Level of expression of the genes with statistically significant differences
References
Alluwaimi, A.M., Leutenegger, C.M., Farver, T.B., Rossitto, P.V., Smith, W.L.,
Cullor, J.S., 2003. The cytokine markers in Staphylococcus aureus mastitis of bovine mammary gland. J. Vet. Med. B. Infect. Dis. Vet. Public Health. 50, 105-111.
Bailey, M., Plunkett, F.J., Rothkötter, H.-J., Vega-Lopez, M.A., Haverson, K., Stokes, C.R., 2001. Regulation of mucosal immune responses in effector sites. Proc. Nutr. Soc. 60, 427-435.
Bannerman, D.D., Paape, M.J., Lee, J.W., Zhao, X., Hope, J.C., Rainard, P., 2004a. Escherichia coli and Staphylococcus aureus elicit differential innate immune
responses following intramammary infection. Clin. Diagn. Lab. Immunol. 11, 463-472.
Bannerman, D.D., Paape, M.J., Goff, P.P., Kimura, K., Lippolis, J.D., Hope, J.C., 2004b. Innate immune response to intramammary infection with Serratia marcescens and Streptococcus uberis. Vet. Res. 35, 681-700.
Bannerman, D.D., Chockalingam, A., Paape, M.J., Hope, J.C., 2005. The bovine innate immune response during experimentally-induced Pseudomonas aeruginosa mastitis. Vet. Immunol. Immunopathol. 107, 201-15.
Bannerman, D.D., Paape, M.J., Chockalingam, A., 2006. Staphylococcus aureus intramammary infection elicits increased production of transforming growth
factor-alpha, beta1, and beta2. Vet. Immunol. Immunopathol. 112, 309-315. Bannerman, D.D., 2009. Pathogen-dependent induction of cytokines and other
soluble inflammatory mediators during intramammary infection of dairy cows. J. Anim. Sci. 87, 10-25.
Brandtzaeg, P., 2010. The mucosal immune system and its integration with the mammary glands. J. Pediatr. 156, S8-15.
Cates, E.A., Connor, E.E., Mosser, D.M., Bannerman, D.D., 2009. Functional characterization of bovine TIRAP and MyD88 in mediating bacterial lipopolysaccharide-induced endothelial NF- kappaB activation and apoptosis. Comp. Immunol. Microbiol. Infect. Dis. 32, 477-90.
Contreras, G.A., Rodríguez, J.M., 2011. Mastitis: Comparative Etiology and Epidemiology. J. Mammary Gland Biol. Neoplasia. 16, 339-56.
Cui, X.G., Hwang, J.T.G., Qiu, J., Blades, N.J., Churchill, G.A., 2005. Improved statistical tests for differential gene expression by shrinking variance components estimates. Biostatistics. 6, 59-75.
Denis, M., Parlane, N.A., LacyHulbert, S.J., Summers, E.L., Buddle, B.M., Wedlock, D.N., 2006. Bactericidal activity of macrophages against Streptococcus uberis is different in mammary gland secretions of lactating and drying off cows. Vet. Immunol. Immunopathol. 114, 111-120.
Embrapa Gado de Leite. 2005. Sistema de Produção. Accessed Apr. 29, 2012. http://sistemasdeproducao.cnptia.embrapa.br/FontesHTML/Leite/LeiteRecriadeN ovilhas/racas.htm
Estes, D.M., Tuo, W., Brown, W.C., Goin, J., 1998. Effects of type I/type II interferons and transforming growth factor- on B-cell differentiation and proliferation: definition of costimulation and cytokine requirements for immunoglobulin synthesis and expression. Immunology. 95, 604-611.
Fagarasan, S., Honjo, T., 2004. Regulation of IgA synthesis at mucosal surfaces. Curr. Opin. Immunol. 16, 277-283.
Fonseca, I., Silva, P.V., Lange, C.C., Guimarães, M.F.M., Weller, M.M.C.A., Sousa, K.R.S., Lopes, P.S., Guimarães, J.D., Guimarães, S.E.F., 2009. Expression
profile of genes associated with mastitis in dairy cattle. Genet. Mol. Biol. 32, 776-781.
Fonseca, I., Antunes, G.R., Paiva, D.S., Lange, C.C., Guimarães, S.E.F., Martins, M.F., 2011. Differential expression of genes during mastitis in Holstein-Zebu crossbreed dairy cows. Genet. Mol. Res. 10, 1295-1303.
Fuller, T.F., Ghazalpour, A., Athen, J.E., Drake, T.A., Lusis, A.J., Horvath, S., 2007. Weighted gene coexpression network analysis strategies applied to mouse weight. Mamm. Genome. 18, 463-472.
Gaddy-Kurten, D., Tsuchida, K., Vale, W., 1995. Activins and the receptor serine kinase superfamily. Recent Prog. Horm. Res. 50, 109-129.