M
ASTER OF
S
CIENCE IN
FINANCE
M
ASTERS
F
INAL
W
ORK
PROJECT
EQUITY RESEARCH
:
DAIMLER AG
FREDERICO BRITO DA COSTA BARBOSA DE SOTOMAYOR
S
UPERVISOR
:
C
LARA RAPOSO
Abstract
Daimler AG is an international German company that operates on the automotive
industry, being a worldwide leader in manufacturing trucks and the tenth in passenger
cars. The company is a world leader as a premium brand with sales accounting for
3,37 million of vehicles in 2018.
The main objective of this project is to evaluate Daimler AG shares and calculate the
company value, according to the structure and recommendations of CFA Institute. The
reason behind the choice of this company is mainly justified by my interest in the
automotive industry as well as the curiosity obtain by a brief work experience in this
company. This report was written on July 30
th, 2019, in accordance with public
information, meaning that any information available after this reference date will not be
considered on this valuation.
In accordance with the Discount Cash Flow method, the price target was €44.45 on
the reference date with a down potential of 5.91%. In order to support the valuation, a
Comparable multiples method analysis was conducted, which generated a more
pessimistic scenario with a down potential of 20.61%. The auto industry market is
under a strong uncertainty, where a number of big firms are restructuring their portfolio
in a suddenly way. With this is mind and also with the evaluation made on Daimler AG,
it was considered a high-risk investment, where my recommendation for the company
is to Reduce.
JEL classification: G10; G32; G34;
Keywords: Equity Research; Evaluation; Daimler AG; Auto industry; Leader;
Price-Target; Risk
Resumo
A Daimler AG é uma empresa alemã internacional que opera sobre a indústria
automóvel, sendo a maior fabricante de camiões no mundo e a décima maior em
automóveis de passeiros. A empresa ocupa uma posição líder no mundo como marca
premium de automóveis com vendas de 3,37 milhões de veículos em 2018.
O objetivo deste projeto é avaliar o valor das ações da Daimler AG e calcular o valor
da empresa, obedecendo à estrutura e recomendações do CFA Institute. O motivo
pela escolha da empresa deve se ao interesse pela indústria automóvel assim como
pela curiosidade ganha aquando uma breve experiência profissional na mesma. Este
relatório foi elaborado a 30 de julho de 2019 de acordo com informação pública, na
medida em que, qualquer informação disponibilizada após esta data de referência não
estará considerada na avaliação.
De acordo com o método de avaliação Discounted Cash Flow, o preço-alvo na data
de referência foi de €44.45 com um potencial de descida de 5.91%. De forma a dar
suporte à avaliação, o método de avaliação comparável através de múltiplos
representou um cenário mais pessimista com uma potencial descida de 20.61%. A
indústria automóvel encontra-se perante uma forte incerteza no seu mercado, onde
todas as grandes empresas estão a mudar o seu portfolio de forma repentina. Foi
considerado, com o sustento também da avaliação feita à Daimler AG, um risco de
investimento elevado donde a minha recomendação para as ações da empresa é de
reduzir.
Classificação JEL: G10; G32; G34
Acknowledgements
This challenge is a desirable achievement that would not have been possible without
the help and support of a group of people of were present during this journey.
To my supervisor, Clara Rapouso, my gratitude for being always present to guide and
encourage throughout this Equity Research.
A big thank you to my family that gave me the opportunity to complete my master’s
degree at ISEG and for all the daily support and motivation.
To my girlfriend, Rita Carvalho, who has always been present to help me overcome all
my goals and believes.
Index
Abstract
i
Resumo
ii
Acknowledgements
iii
Index
iv
List of Figures
v
List of Tables
vi
1.
Research Snapshot
1
2.
Business Description
2
3.
Management and Corporate Governance
5
4.
Industry Overview and Competitive Positioning
6
5.
Investment Summary
10
6.
Valuation
11
7.
Financial Analysis
13
8.
Investment Risks
14
Appendix A: Balance Sheet Statement
16
A-1: Projected Balance Sheet Statement
16
A-2: Common-Size – Projected Balance Sheet Statement
17
Appendix B: Income Statement
18
B-1: Projected Income Statement
18
B-2: Common-Size – Projected Income Statement
18
Appendix C: Cash Flow Statement
19
Appendix 4: Key Financial Ratios
20
Appendix 8: Forecasting Assumptions
21
Appendix 9: Business and Corporate Structure
25
Appendix 9: Porter’s Five Forces
26
Appendix 10: DCF Analysis
26
Appendix 11: Sensitivity Analysis
27
List of Figures
Figure 1: Historical Stock Price
1
Figure 2. Employees by region
2
Figure 3. Daimler Unit Sales by segment
2
Figure 4. Daimler Revenue by region
3
Figure 5. Unit sale structure of Mercedes-Benz cars
3
Figure 7. Strategy Structure
3
Figure 6. Unit sale structure of Daimler trucks
3
Figure 8. Company setup
4
Figure 9. Fit for Leadership Strategy
4
Figure 10. Shareholder Structure
5
Figure 11. Governance structure
5
Figure 12. Compliance Management System (CMS)
5
Figure 13. Passenger car registration
6
Figure 14. Variation GBP to Euro
6
Figure 15. % of variation of passenger car registration
6
Figure 16. Real GDP Growth Forecast 2012-2022
7
Figure 17. Automotive sector trends
7
Figure 18. Passenger electric car sales (thousands)
8
Figure 19. Plug-in car sales (thousands)
8
Figure 20. Hydrogen fuel cell production vehicles (thousands)
8
Figure 21. Daimler vision for 2050
9
Figure 22. Porter’s Five Forces
10
Figure 23. Revenue Forecast
11
Figure 24. Investment in R&D and PP&E
11
Figure 25. Debt analysis (in thousands)
13
Figure 26. Return on assets and equity ratios
13
Figure 27. Revenue of Mercedes-Benz cars (in millions) and unit sales
14
List of Tables
Table 1. Daimler Market Data 30/07/2019
1
Table 2. Daimler Target Prices (2019YE)
1
Table 3. Daimler’s Brief Profile
2
Table 4. Passenger car production by region in 2018
7
Table 5. Daimler vs competitor’s unit sales
9
Table 6. Debt analysis (1)
12
Table 7. Debt analysis (2)
12
Table 8. WACC Assumptions
12
Table 9. Forward Multiple analysis
13
Daimler AG
(2019YE Price Target of €44.45 (-5.91%), with Low Risk; Recommendation is to reduce)
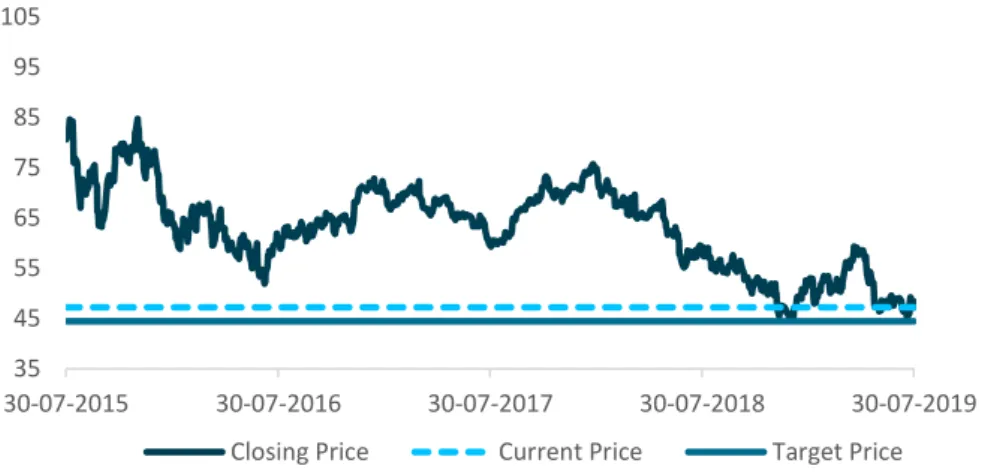
Based on the analysis conducted on Daimler AG, the outcome is a REDUCE recommendation at 30 July of 2019 with price target of €44.45 for 2019YE, representing a downside potential of 5.91%, using the Discounted Cash Flow Method. The use of relative valuation demonstrated a more pessimistic scenario, in which the target price is €37.50 generating a SELL recommendation with a downside potential of 20.61% with Low risk. With the constant uncertainty in the automotive market and the change to alternative powered vehicles the risk to invest in this market increases as well as opportunities.
Figure 1: Historical Stock Price
Well established player in the automotive market
Daimler is most known for his Mercedes-Benz brand, however the company is an overall global brand with strong diversified portfolios across different divisions besides automotive, such as Vans, Trucks, Buses and Financial services. Besides the uncertainty in the market, the company is showing back to back increases on revenues every year, reaching a total of almost 3,4 million vehicles sold in 2018.
New corporate strategies and leadership
Since May 2019, Ola Källenius is the new chairman of Daimler AG. With this change in command, a global reorganization of the company will take place which will involve 800 subsidiaries in more than 60 countries. This will put Mercedes-Benz AG ahead of Mercedes-Benz Cars and Mercedes-Benz Vans divisions, while the division of Daimler Trucks and Buses divisions will be managed by Daimler Truck AG.
High Investment in Research & Development
The investment in R&D is, nowadays one of the top figures to identified if a company is getting prepared for the future. In the past 4 years Daimler almost duplicated the money invested in R&D reaching 9.1 billion in 2018. The objective is that by the year 2025, the sales of electric vehicles account for 25% of the company sales overall.
35 45 55 65 75 85 95 105 30-07-2015 30-07-2016 30-07-2017 30-07-2018 30-07-2019
Closing Price Current Price Target Price
1.
Research Snapshot
Daimler AG
Reduce
Recommendation
30 July 2019Portugal
Table 1. Daimler Market Data 30/07/2019
Market Profile
Closing Price (30 July) €47.24
52 weeks price range €44.77 - €59.34
Shares Outstanding 1,070 billion
Volume 9,244,811
1-year return 12.10
Market Capitalization 50,54 billion
P/E 6.8
Source: Reuters, students estimates
Table 2. Daimler Target Prices (2019YE)
Valuation Price Target
Current Stock Price
(30-07-2019) €47.24
DCF €44.45
EV / Sales €37.50
Company Profile
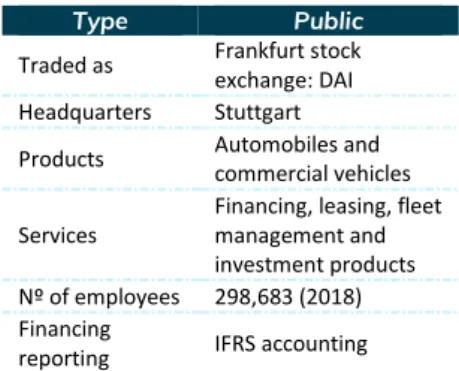
Best known as the manufacturer of the luxurious Mercedes-Benz, Daimler AG is a German company with headquarters in Stuttgart. Daimler AG is a world leader in manufacturing commercial vehicles and one of the biggest producers of premium cars. Beside automobiles Daimler AG manufactures trucks, vans, busses and provides financial services. With its origins tracing back to 1886, when the company was grounded by its founders Gottlieb Daimler and Carl Benz, later they merged with Chrysler Corporation in 1998. In 2007 Daimler declared the sale of Chrysler to a private equity announcing Daimler AG as the new company title.
Today Daimler AG operates all around the world selling vehicles and services and have production facilities in Europe, North and South America, Asia and Africa, being present in the Frankfurt stock exchange – Table 3.
The structure of Daimler was recently revised and improved (2019 annual shareholders meeting) to prepare the company for the challenges and opportunities of the new automotive era. The new structure divides Daimler in three companies (Daimler Mobility AG, Daimler Truck AG and Mercedes-Benz AG), however the responsibility to exercise corporate governance, strategy and management functions and provide cross-divisional business services lies with the parent company Daimler AG. The primary divisions of Mercedes-Benz AG are passenger cars, which include Mercedes-bens cars & vans, Smart, Maybach, AMG, Mercedes Me and EQ but also commercial cars.
In order to complement the manufacturing business, Daimler Financial Services provides financing, leasing, investment products, fleet management and brokerage of credit cards and insurance, as well as innovative mobility services.
As of December 31, 2018 Daimler’s employees totaled to 298,683, a 3.2% increase from previous year (289,321), mostly due from the result of the positive overall business situation – Figure 2
The unit sales of the company overall have increased in 2018, Mercedes-Benz cars sold a record of 2,4 million cars maintaining its position as the leading premium brand. The highlights of the year (2018), were the launch of the first all-electric Mercedes-Benz car, the EQC and the increase focus on the smart electric, which doubled the sales from 2017 – Figure 3
The Mercedes-Benz vans also reached a new record with 421,000 sales (5% increase from 2017) marked with the increase number of orders for the new Sprinter, where Amazon alone ordered 20,000 units.
Regarding Daimler trucks, the launch of the new Mercedes-Benz Actros set the scale in order to increase 10% in sales versus the year 2017. The grow was solid in Europe, but it was in North America, Latin America and Asia where the growth was significantly.
Daimler buses also increase its sales by almost 10%, the launch of the eCitaro which offers an effective solution for improving air quality in cities, was one of the reasons that justified this upward trend in sales.
When comparing the numbers of Daimler’s unit sales with the Global unit sales growth in 2018, the company from Germany increased by 2.4% while the global car
2.
Business Description
Figure 3. Daimler million sales by segment
Source: Daimler AG Annual Report 2018
0.4% 9.9% 5.1% 7.7% -3000, 00% -2500, 00% -2000, 00% -1500, 00% -1000, 00% -500,00% 0,00% 500,00% 0 5 10 15 20 25
Cars Trucks Vans Buses
x 1 0 0 0 0 0 2017 2018 % change
Table 3. Daimler’s Brief Profile
Type Public
Traded as Frankfurt stock
exchange: DAI
Headquarters Stuttgart
Products Automobiles and
commercial vehicles Services
Financing, leasing, fleet management and investment products
Nº of employees 298,683 (2018)
Financing
reporting IFRS accounting
Source: Company Data
Figure 2. Employees by region
Source: Company Data 58% 14% 9% 4% 3%2%10% Germany Rest of EU USA Brazil Japan China Other 298,683
sales decreased by 0.5% (source: Jato), enhancing the gain of market power of Daimler.
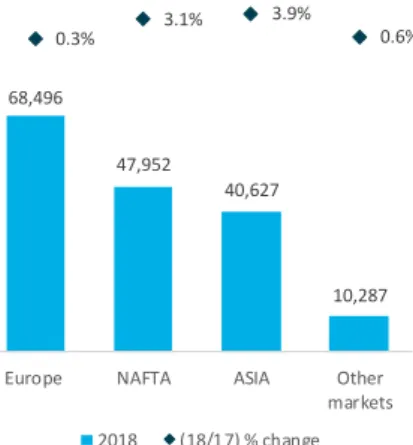
Daimler revenue showed an upward trend comparing to last year (2017), where the economic growth was close to 3.4%. Europe is Daimler’s biggest market, however due to the current economy with the decreased of foreign trade, was unable to continue the development of 2017 and grew less than 0.3% - Figure 4. On the other hand the US economy with the help of fiscal policies, made Daimler revenue of NAFTA region to reach 3.1% of increase in revenue when comparing with the year 2017. Although Daimler revenue from Asia reached 3.9% increase, it was smaller than 2017 since China economic growth slowed due to low credit growth.
Regarding unit sale structure, Europe is also ahead, representing 41% of Mercedes-Benz cars sold in 2018 (Figure 5), followed by Asia with 39% and NAFTA with 16%. Daimler Trucks, besides being a part of the same company, have a completely different structure, with the American Region (NAFTA) representing more than one third of sales. Europe fells short with just 17% and Asia increasing every year, with 32% in 2018 – Figure 6.
Company Strategies
Daimler is currently facing the biggest transformation in its history by implementing the “Mercedes-Benz” growth strategy 2020 (5C strategy) – Figure 7. The objective of this strategy is to prepare the company for the challenges and opportunities associated with the new age of mobility. This strategy is supported by four components (Figure 7) that establish the conditions needed to ensure the focus on the requirements of the costumer:
1) Strengthening Daimler’s CORE business is the goal based on the global growth in all vehicle segments. Mercedes-Benz cars will focus on different technological approaches in a market moving to emission-free driving. These strategies pass from improving modern combustion engines, expanding hybridization and emission-free vehicles with batteries and fuel cell. Daimler trucks set the target to achieve permanent savings of 1,4 billion euros by 2019 with projects such as the product program in Brazil and vehicle connectivity in São Bernardo do Campo and Juiz de Fora. Regarding Mercedes-Benz vans the objective is digitize the global manufacturing operations by 2025 and in order to achieve it, Daimler is focusing on market strategies for global growth, product strategies for expanding the portfolio and future initiatives. Daimler buses are following the same line as the vans, focusing also on increasing efficiency on several manufacturing locations and development expertise in the fields of electric mobility, connectivity and autonomous driving. The financial services will, by the end of July 2019, be called Daimler Mobility AG and will continue to grow around the world. In the end of the year (2018) about half of the vehicles delivered by Daimler are financed or leased by Daimler financial services, and Daimler’s strategy is to improve the digitalization of its processes in order to see this number growth even higher.
2) Continuing to be a leading company in CASE (connected, Autonomous, Shared&Services, Electric) fields which means leading in new future fields, such as driving and safety systems for automated autonomous driving, digitization and connectivity. Mercedes-Benz cars will keep investing on a more intuitive Mercedes-Benz User Experience (MBUX) which is a technology in an infotainment that increases the user experience and adapts
Figure 4. Daimler Revenue by region
Source: Daimler AG Annual Report 2018
68,496 47,952 40,627 10,287 0.3% 3.1% 3.9% 0.6% -50.00% -40.00% -30.00% -20.00% -10.00% 0.00% -10,000 10, 000 30, 000 50, 000 70, 000 90, 000
Europe NAFTA ASIA Other
markets
2018 (18/17) % change
Figure 5. Unit sale structure of Mercedes-Benz cars
Source: Daimler AG Annual Report 2018 41% 16% 39% 4% Europe NAFTA ASIA Other markets
Figure 7. Unit sale structure of Daimler trucks
Source: Daimler AG Annual Report 2018 17% 7% 37% 32% 7% EU30 Latin America NAFTA ASIA Other markets
Figure 6. Strategy Structure
to suit their needs. The focus autonomous driving is accelerating with various partnerships being made like HERE for high-resolution digital maps and with Bosch for the joint development of technology for fully automated driving and driverless vehicles. Regarding Daimler trucks the objective is to create a seamless transport logistics system, being the first manufacturer to offer partially automated driving. Daimler buses intends to invest in bringing together all of its current and future digital services on the OMNIplus ON digital portal (to ensure customers to keep moving in safety). Daimler is continuing to invest in developing the business with fleets of automated and autonomous vehicles by partnership with car2go (flexible car-sharing services)
3) In order to adapt the corporate CULTURE, Daimler will continue to focus on promoting the development of innovations through the use of modern techniques such as scrumming and design thinking. The development and implementation of new business ideas and innovations help the creation of digital solutions.
4) The focus on the costumer and market structure (COMPANY) will have a considerable change by 2019 (Figure 8), where Mercedes-Benz cars and vans will be incorporated into Mercedes-Benz AG. The Daimler Trucks and Buses divisions will be named Daimler Truck AG with the objective of making them more independent. Daimler Mobility AG will be the new name for Daimler Financial Services.
Fit for leadership strategy
The world is changing rapidly as well as the way work is done, the way information is obtained, and communication is made. Everything is taking place in real time, becoming faster and more direct.
It’s important in these days to sense the new megatrends (Big Data, Digitalization, Artificial Intelligence, etc) early and understand their implications quickly and powerfully. The same situation happens with the search for new competitors, especially those that offer an innovative substitute product such as Tesla, Uber, Google, etc. With all this is mind, Daimler redesigned the “fit for leadership” program that focus on establishing a new management culture with knowledge and preparation for the new future in order to ensure the future success of the company – Figure 9.
Mercedes-Benz IO and new showroom’s
In 2017, Daimler set up the world's first digital competence center and elected Portugal has the “driver” to this hub. The principal objective is to develop Daimler’s worldwide e-commerce platform as well as the implementation of new services and the expansion of business models. The new subsidiary will focus on developing customer-oriented solutions and improving customer experience with digital channels.
The digitalization is changing the way the business is done and costumers around the world expect to be able to interact online with their brands anywhere and at any time. Daimler’s estimates that, by 2025, 25% of the vehicles sold will be online. Besides this estimate, Daimler wants to continue to invest in stands with the program “Best Customer Experience 4.0”. The idea is to transform each stand in a point of experience with the use of new technologies to make easier and intensive the contact between clients and products.
Figure 8. Company setup
Source: Company Data
Figure 9. Fit for Leadership Strategy
Source: Company Data
New Megatrends New Competitors Daimler Strategy
Shareholder Structure
On March 2019, Daimler share capital amounts to €3,07 billion which comprise of 1,069 million shares outstanding. Daimler’s has a broad shareholders base which can count with almost 1.0 million shareholders. Tenaciou3 Prospect Investment Limited currently owns 9.7% of the company’s shares, becoming Daimler AG’s largest individual shareholder since February 2018. Accounting with 6.8% of the total shares outstanding is the Kuwait Investment Authority (KIA), followed by Renault-Nissan with 3.1% - figure 10.
The board of management remuneration is categorized in three components: the fixed base salary and the annual bonus each comprise approximately 30% of the target remuneration, while the other 40% correspond to the variable component of remuneration with a long-term incentive effect.
3.
Management and Corporate Governance
Corporate Management
The Board of Management of Daimler AG is responsible, according with the objectives of the company, to direct, coordinate and control the business activities. Ola Källenius is Daimler’s newest chairman. In May of 2019 the former CEO, Dieter Zetsche, stepped down after leading the company for the past thirteen years. This change of command was made in response to challenges presented by the transformation of the automotive industry, since Ola Källenius was overseeing the research and development department.
Corporate Governance
In order for Daimler to continue its success and increasing the trust from clients and investors, needs to keep having a transparent and responsible corporate governance. Daimler is obligated to apply a dual management system, where the Board of Management has the duty to manage the company and the Supervisory Board guides the Board of Management (Figure 11).
The Board of Management has the obligation to prepare the financial statements, the consolidated interim reports, and other reports for the company and the group. The Supervisory Board besides monitor and advising the Board of Management, reviews the annual financial statements and revise the objectives outlined to report to the annual shareholders meeting.
Compliance Management System (CMS)
Compliance means acting in conformance with laws and regulations, and Daimler’s objective is to ensure that all employees work in conformance with these laws and regulations. Daimler’s compliance promotes rule-based behavior using a set of principles and measures (Figure 12). The objective of these principles is, among others, to avoid inappropriate or illegal behavior from the employees, conformance with laws and regulations and reduce compliance risks and prevent violations of regulations and laws.
Having Daimler a financial institution, the need to be aware and prevent anti-financial crime is obvious, so there is a compliance goal that as the objective of preventing money laundering. This objective is achieved with the implementation of anti-money laundering measures that are defined and updated every year. The implementation of anti-money laundering (AML) and counter terrorist financing (CTF) policies serves
Figure 10. Shareholder Structure
Source: Company Data 9% 7%3% 60% 21% Tenaciou3 Prospect Investment Limited Kuwait Investment Authority Renault-Nissan Institutional investors Retail investors
Figure 11. Governance structure
Source: Company Data
Figure 12. Compliance Management System (CMS)
to prevent not only the negative impact on society but also a possible long-term damage to Daimler’s reputation.
The Human rights compliance is a fundamental component of responsible corporate governance for Daimler. There is a constant expansion for the Human Rights Respect System (HRRS) that follows a set of standards and guidelines for environmental protection, safety, business ethics and working conditions.
The automotive industry, despite trending towards efficiency and sustainability, is worth more than 250 billion dollars worldwide. There is an enormous car culture across the globe making this industry a key engine of a macroeconomic growth. This industry it’s not just selling cars, it involves also areas such as manufacturing, repair and design. It also links to other sectors, having and important multiplier factor in the economy.
The number of passenger car registrations decreased by 0.5% in 2018 to 79 million (Figure 13), justified by the political changes in key markets (Brexit) and introduction of some complex environmental regulations. Since the financial crisis in 2008, the auto market has recovered almost 100%, currently facing a number of different trends such as electric, hydrogen and self-driving vehicles.
Industry Overview: European Union
The highly uncertain outcome of Brexit remains the key risk in the economy. The GBP is decreasing to history minimums (Figure 14), mainly because of the Brexit situation, according to a study made by Deloitte the CFO’s of the major companies in England are responding to this threat with their companies most defensive strategy. These strategies were last use in the financial crises of 2008 and the result is mainly the cost reduction and cash control.
The European Commission forecasts for GDP Growth, inflation and unemployment in Europe are expected to be stable until 2020 which is positive signal considering that all of these variables are in a good position. The number of passenger cars registrations remain stable in 2018, however the variation each year has been decreasing since 2016 (Figure 15) representing that the market is slowing down. On other prospective, 2018 marks the 5-consecutive year of positive variation. Regarding fuel types it’s possible to see a drop of close to 18.3% in diesel vehicles, justified with the diesel crises which led to an increase of registrations of petrol-fueled vehicles by 12.8% and an increase of 30.4% of alternative powered vehicles.
Industry Overview: America
During 2018 the world economy faced a loss momentum that was driven in 2017, despite of the global real GDP growth remains the same at 3.8%. The main reason behind this loss is the implementation of tariffs by major economies, such as the United States. Despite of the actions mentioned, the US economy growth considerably in 2018 justified with tax cuts that stimulated demand, which made the US federal reserve to raise the policies of interest rates. As a result the US dollar appreciated against most of the other currencies. A few financial crises in South America are getting quite significant, Argentina with the drop of pesos by close to 80% in the past 5 years. Another financial crisis to notice is in Venezuela, that with
4.
Industry Overview and Competitive Positioning
Figure 13. Passenger car registration
Source: IHS, ACEA-ACEA Economic and Market Report Q4 2018
73,4 77,3 79,6 79,0 72 73 74 75 76 77 78 79 80 81 2015 2016 2017 2018 Milion registrations
Figure 14. Variation GBP to Euro
Source: XE currency 1,1 1,2 1,3 1,4 1,5 jan /1 5 m a i/1 5 se t/ 1 5 jan /1 6 m a i/1 6 se t/ 1 6 ja n /1 7 m a i/1 7 se t/ 1 7 jan /1 8 m a i/1 8 se t/ 1 8 78,96
Figure 15. % of variation of passenger car registration
Source: IHS, ACEA-ACEA Economic and Market Report Q4 2018
-3% 2% 7% 12% 2016 2017 2018 EURO N.A ASIA
the election of President Maduro the economy is freefalling, registering a global real GDP drop of 18%.
In the United States, Donald Trump administration claimed in 2018 that the US relies too much on foreign steel and metals. This are the raw materials to produce cars, so there could happen a taxation on foreign steel and aluminum, which will be led to US companies to buy them locally to avoid taxes. The result should mean that car companies would pull up the prices on their finished products, hurting the consumers, that represent a market share of 18% of passenger cars registrations in the world.
Industry Overview: Asia
The economic growth of Asia and Pacific regions has been the strongest in the world registering an average of 5.5% real GDP growth in the past 6 years (Figure 16) and according to IMF this growth will continue for the next 6 years (until 2022).
The main driver of the Asian economy is exports, especially in China, but considering the constant appreciation of the local currency against most currencies in the rest of the world, there is possibility that Chinese products will be more expensive. If the government does not intervene, it’s likely to occur a drop in the demand of Chinese exportations.
China is the leading country in car registrations in the world, accounting with almost 37 million registers, that represent a market share of 29% in the world. However the variation of registrations has been stable for the past 3 years, due to incentives of the government to face environmental problems. On the other hand, the demand for plug-in cars is registering a giant leap, with the growth in sales accounting an average of 100%.
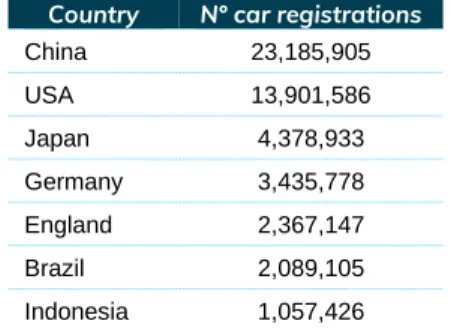
Analyzing the overall situation of passenger cars production, it’s possible to see and with no surprise, that China has the leading position, representing almost 30% of world production – Table 4. Besides Germany is the home country for a lot of car brands, the country represents only 4% of the world production of passenger cars. The production of cars in emerging markets is increasing at a high speed, with Indonesia and Thailand as a reference (7.3% increase from 2017 to 2018).
Industry trends
The idea to make everyone’s life easier is the need that every customer wants. A vehicle is now more than just a way of transport, it’s a social participation and shapes cities and landscapes. Putting this topic in perspective, the automotive market today, shapes to become more electrified, autonomous and connected. With megatrends such as urbanization, climate, demographic and technological change, the usage behavior is changing to adapt. According to a study made by PWC, in the year 2030, 55% of all new car sales in Europe will be fully electrified representing an obvious trend. Facing the same path as electric vehicles is the autonomous driving, that brings a lot of benefits to costumers such as less time driving in traffic situations, increase in safety and sustainability.
With the car ownership becoming less important as a status symbol, the use of car sharing is becoming more popular and there is much more to invest in this area, for example matching the autonomous driving with car sharing.
These topics mentioned (electrified, autonomous and shared) will lead to an increase in the need to innovate. Typically a car model changes every 6 years and have a “facelift” (same model but with small changes) every 3 years. This timeline is also changing considering that a car with 6 years is far from being updated.
Figure 17. Automotive sector trends
Source: Student analysis
Figure 16. Real GDP Growth Forecast 2012-2022 Source: IMF -3,0% -1,0% 1,0% 3,0% 5,0% 2012 2014 2016 2018 2020 2022
Asia and Pacific Europe
North America South America
Table 4. Passenger car production by region in 2018
Country Nº car registrations
China 23,185,905 USA 13,901,586 Japan 4,378,933 Germany 3,435,778 England 2,367,147 Brazil 2,089,105 Indonesia 1,057,426
Source: IHS, ACEA-ACEA Economic and Market Report Q4 2018
Personal mileage is expected to increase by 23% until 2030, and also 40% of the mileage driven will be covered by autonomous vehicles, justified by all the trends above mentioned.
Electric mobility
The global electric automotive market, in 2017, was valued at $118,8 billion and is expected to reach $567,2 billion by 2025. With the constant increase regarding environment issues, electric vehicles are privileged. The year 2018 was marked by a record for the sale of electric vehicles. Passenger electric cars registered 1,26 million sales in 2018 (Figure 18), increasing by 74% from the previous year. This increase can be explained with several factors, starting with the release of the model 3, by tesla, that boosted the sales in the United States. Also, electric cars gained more visibility in the Chinese market due to the promotion by local governments to deal with environmental issues. Since Europe felt, and is still felting, a crisis in diesel vehicles, that alone helped to raise awareness among consumers about the benefits of driving an electric car.
Plug-in vehicles deliveries account for 2,1 million units in 2018, which represents a 64 % increase comparing with 2017. These vehicles include BEV (Battery Electric Vehicle) and PHEV (Plug-in Hybrid Electric Vehicle), the difference between the two is that PHEV has both a battery and a normal petrol or diesel engine, while BEV is just an electric vehicle powered by a battery. In the past three years (2016-2018) the amount of sales of plug-in vehicles increase more than 400%, representing a market full of opportunities – Figure 19.
Considering the increasing demand for electric cars and the local government support all around the world and Daimler plans to expand its range of electric vehicles over the coming years. Daimler is expecting to launch more than 10 all-electric cars across all segments, assuming that all-electric cars will account for close to 25% of Mercedes-Benz car sales by the year 2025. One of the main objectives for Daimler is facing one the biggest costumers that clients have today, which is the low number of charging infrastructure. Daimler, with the help of some of its partners, are investing in the establishment of more charging points across all Europe, specifically in the major highways. They are also investing more than €10 billion in the development of battery production and expanding the current electric fleet.
With the production of electric vehicles (consolidated under the new EQ brand), the expansion of production of batteries and all other factors mentioned, Daimler is ensuring that it can face possible changes in demand regarding electric vehicles.
Hydrogen
Besides battery electric vehicles, there only exists one more zero-emission alternative which is hydrogen-powered fuel cell passenger cars. The answer to why this topic deserves an analysis, can be address by understanding that it’s a market valued at $193,8 million in 2017 and projected to reach more than $10,000 million by 2023.
There is no doubt that with the increase proportion of renewable energy, hydrogen will be crucial in the overall energy system making it attractive for the mobility sector, has showed in a prediction by HIS automotive in 2017 (Figure 20).
This sort of technology uses hydrogen fuel for motive power by burning hydrogen in a combustion engine or by reacting it with oxygen in a fuel cell. Alongside with electric power, hydrogen can be produced using wind, solar, nuclear energy, etc. which is enough to separate oil from transport, ending up opening opportunities to improve energy security. This all and all is a strong contribution to the
Figure 18. Passenger electric car sales (thousands) Source: EV-volumes 391 727 1.261 0 200 400 600 800 1.0 00 1.2 00 1.4 00 2018 2017 2016
Figure 19. Plug-in car sales (thousands) Source: EV-volumes 430 640 980 0 200 400 600 800 1.000 1.200
Jan-Abr May-Aug Set-Dez Months
2016 2017 2018
Figure 20. Hydrogen fuel cell production vehicles (thousands)
Source: IHS Automotive
1 5 9 15 24 47 72 0 10 20 30 40 50 60 70 80 2015 2017 2019 2021 2023 2025 2027
decarbonization of road transport. It’s important to notice that refueling a hydrogen tank only takes minutes whereas fully charging a battery can take hours.
Daimler stated that “The potential of fuel cell technology, and of hydrogen for energy storage, is beyond question. Hydrogen plays a major role in the discussion of ways in which to reach worldwide climatic target”. The EQ brand is well known by now in the automotive sector, with battery technology, but Daimler keeps investing in fuel cell technology. With the experience gained in the past years, Daimler created the new model GLC F-CELL which is first electric vehicle featuring fuel cell and plug-in hybrid technology. This model is the first in the world where a lithium-ion battery is used as an additional energy source.
The major opportunities for Daimler to invest in this market, besides the already mentioned like short refueling time, are for example less weight added for energy stored and zero tailpipe emissions. Overall, if some challenges can be faced like initial low utilization of refueling stations raises fuel cost, Daimler is getting well prepared to achieve the predictions made for 2050 (Figure 21).
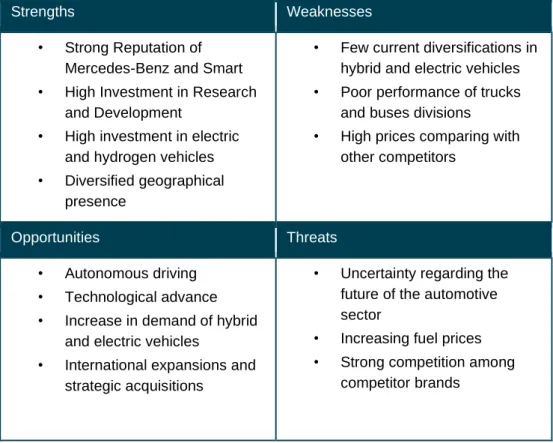
SWOT
Figure 21 summarizes Daimler’s strengths, weakens, opportunities and threats (SWOT analysis). The main strength of Daimler relies on being a market leader in premium vehicles, regarding unit sales is number 10 in the world but still ahead of its main competitor’s – Table 5. The weakness focusses more on the few diversifications of hybrid and electric vehicles on Daimlers portfolio. The possibility of investing in new technologies represents an obvious opportunity in order for Daimler to be ahead in the market. The company faces threats concerning the high competition in the market and its constant uncertainty.
Strengths Weaknesses
• Strong Reputation of Mercedes-Benz and Smart • High Investment in Research
and Development
• High investment in electric and hydrogen vehicles • Diversified geographical
presence
• Few current diversifications in hybrid and electric vehicles • Poor performance of trucks
and buses divisions • High prices comparing with
other competitors
Opportunities Threats
• Autonomous driving • Technological advance • Increase in demand of hybrid
and electric vehicles
• International expansions and strategic acquisitions
• Uncertainty regarding the future of the automotive sector
• Increasing fuel prices • Strong competition among
competitor brands
Figure 21. SWOT analysis
Figure 21. Daimler vision for 2050
Source: Company Data
Table 5. Daimler vs competitor’s unit sales Toyota 8,091,277 Volkswagen 6,746,204 Ford 5,329,290 Honda 4,966,037 Nissan 4,750,863 Hyundai 4,076,913 Chevrolet 3,881,747 Suzuki 3,046,585 Kia 2,638,782 Mercedes 2,551,806
Porter’s five forces
• Threat of New Entrants (2) – Daimler has a strong market recognition in the premium segment which is one of the main reasons why this threat is low. With the constant need to evolve and to be technological updated, a high investment in research and development is required in the automotive industry as well as a large investment in mass production.
• Threat of New Substitutes (3) – A substitute product for Daimler includes mainly other means of transportation such as the increase of people using public transportation or other vehicles that does not give the amount of satisfaction and luxury than driving a Mercedes-Benz. There is also a possibility to appear a substitute vehicle created by a company rival however, considering that Daimler invests a considerable amount in R&D, has a little edge in this matter.
• Competitive Rivalry (5) – Daimler faces a highly competitive market in the premium car segment. To face this constant threat, there is a need to be updated regarding the latest technology trends in order to not fall short with is main rivals such as BMW and Audi. With the excessive amount invested in R&D, there still exists few electric vehicles in Daimlers portfolio making this threat considerably high. Besides its main competitors, there also exists a number of brands that are gaining value in the premium car segment such as Lexus, Volkswagen and Volvo.
• Bargaining Power of Suppliers (3) –With a long relationship with suppliers of raw materials and parts, Daimler has a strong negotiation power, which is also supported by the high number of options that currently has in the market. Being Daimler a luxury car brand, it has certain worries regarding the quality of their products making the list of possible suppliers smaller. This last concern is what makes this threat moderate.
• Bargaining Power of Costumers (4) – Considering that exists a high number of substitutes the costumer has a reasonable bargaining power, on the other hand the loyalty that is showed is also high. The power of costumers is also related with the brand’s image, considering that owning a Mercedes-Benz gives a high status for the costumer. Additionally, the constant need to innovate is a key feature for Daimler considering that the time and effort it takes to gain loyalty is high but the time and effort to lose it is low.
Daimler AG valuation price is €44.45 at 30 of July 2019YE with the use of two valuation methods. With the use of Discounted cash flow method (DCF), Daimler’s target price is €44.45 with downside potential of 5.91% representing a REDUCE recommendation. Regarding the relative valuation, the scenario was different giving a more pessimistic scenario in which the target price is €37.50 generating a SELL recommendation with a downside potential of 20.61%. The forecast for Daimler’s valuation was with a timeline of 4 years, between 2019 and 2022.
With this analysis it’s possible to give a sell recommendation with medium risk, but with the high uncertainty in the market and the current development of new trends, new competitors and new challenges, the reduce recommendation is considered to be more appropriate.
5.
Investment Summary
Figure 22. Porter’s Five Forces
Source: Student Analysis 0 1 2 3 4 5Rivalry Threat of new entrants Threat of substitutes Power of suppliers Power of buyers
Daimler is an automotive engineering company that engages in the production and distribution of cars, trucks, and vans. The Company also provides financial and other services relating to its automotive businesses and is expected to keep the leading position of premium car brand in the world. With the volatility increase in the automotive market regarding the entrance of new alternative source engines, Daimler is expecting to invest more than €10 billion developing battery production and fuel cell technology. The business in some countries in South America, such as Argentina and Venezuela are falling apart due to political and economic uncertainty. Somehow similar path is happening in England with Brexit bringing a lot of uncertainty regarding the possible outcome making the investors insecure.
Valuation Methods
The method used was the DCF (discounted cash flow) to determine Daimler firm value. This method was chosen because the capital structure of the firm will change in the next years and the basis was Daimler’s consolidated financial reports between 2014 and 2018. The main objective is to forecast Daimler’s free cash flows for four years, between 2019 and 2022 in order to obtain a valuation price. Being a method preferred by analyst and investors worldwide the valuation was made analyzing Daimler’s free cash flows (FCF’s) and using the adjusted present value. The WACC model (Weighted average cost of capital) was used since the company has a debt-to capital ratio constant over time (Damodaran, 2002). This model is also supported by Goedhart, that stated that the WACC model should be used when valuating firms with several businesses, which is the case of Daimler (cars, vans, trucks, buses and financial services). The WACC model uses a constant tax rate to estimate the tax-shield, opposing with the APV model that uses period-by-period.
To support the valuation of the DCF method, a computation of a relative valuation was also made. A relative valuation as the goal to compare values of similar companies in the market assuming that substitutes and comparative assets should have the same price (Baker and Ruback, 1999). The first objective is to search for a peer group composed by companies with a similar business than Daimler, then a comparison is made on the multiples in order to identify and analyze differences.
Revenues
Considering that Daimler offers a broad portfolio of vehicles, the forecast of sales revenues is complex. With the increase in sales of electric vehicles, Daimler is and will continue to diversify its portfolio, making a forecast of strong sales for the upcoming years. Regarding revenues of combustion vehicles, despite the sales in the industry decreases in the past year, justified with electric vehicles, the sales of Daimler increased by 2.4%, which proves the strong performance of the brand. With the launch of the new EQ model in the beginning of 2019 and more upcoming electric vehicles Daimler assumes that by 2025 25% of sales are electric. A historical data for the past 5 years proved that Daimler revenues increased by an average of 6,7%. China is the main driver for Mercedes-Benz sales, and it will continue to be with the government incentives for electric vehicles, continuing the current market share. To support the assumption, a deeper analysis was made regarding Daimler sales and current market share. The main challenge in the automotive industry is regarding the amount of technology that a vehicle has, which is something that budget vehicles are increasing quite significantly. This puts pressure in premium brands, such as
6.
Valuation
Figure 23. Revenue Forecast
Source: Students analysis 140.000 160.000 180.000 200.000 220.000 2017 2018 2019F 2020F 2021F 2022F
Figure 24. Investment in R&D and PP&E
Source: Students analysis 3.000 4.000 5.000 6.000 7.000 8.000 9.000 10.000 2014 2015 2016 2017 2018 Investment in PP&E Investment in R&D
Mercedes, to always be ahead of competitors in order to different themselves. Daimler is increasing every year the amount invested in research and development and property plant and equipment in order to be ahead of competitors in an upcoming future (Figure 24)
Net Debt
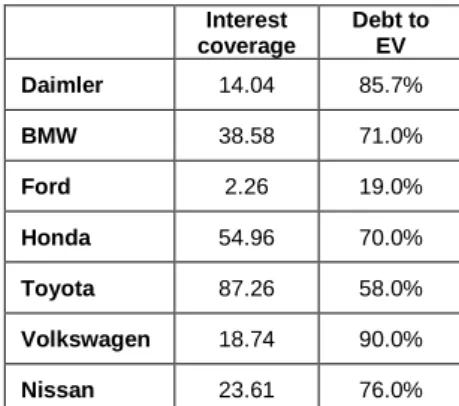
Daimler’s net financial debt is expected to reach €100 billion in 2019, which is mainly comprised with the issuance of bonds and bank credit with interest rates approximately 1.6% and 2.8% respectively. When analyzing the selected peer’s group (Table 6), is possible to note that Daimler is the second most indebted company in book value terms, which can bring a lot of uncertainty to investors. In market value terms the situation is the same (Table 7), being very above the average of the peer group with an interest coverage lower than the peer group and with a debt to enterprise value higher.
The same path is followed when analyzing the how easily can Daimler pay interest of its outstanding debt, with an interest coverage of 14.04 quite below the average. Finally, the ability to pay short term obligations (current ratio) is also low comparing to the peer group. Debt to assets and debt to enterprise value should in the upcoming years improved considering that is expected a growth in the company value and Daimler don’t intend to issue more debt, maintaining the credit rating at grade A. CAPEX, Depreciation & Amortization
Capex is related with the amount invested by Daimler, especially in new projects. Considering that the automotive industry is facing a complete change with new technologies and also BEV and PHEV vehicles, the amount of capital expenditures is clearly expected to increase. The electrification of the portfolio and digital connectivity are the company’s main growth targets. Considering that the amount invested in PP&E, capitalized development cost and other financial investments, is almost the same every year, the predictions were calculated using historical data. Depreciations, Amortizations, Provisions and Impairment were calculated using an average of the historical data.
WACC Assumptions
The cost of equity was computed using the WACC method (Weighted average cost of capital) to estimate the costs to finance investments threw equity or debt.
The risk-free rate used was the yield to maturity of Germany government bonds with 10 years maturity and the value obtained was 0.24%. Considering that daimler is based in Germany, being a mature market and having a credit ranking of AAA, the country risk premium is 0%. The marked risk premium represents the total equity risk of the countries where the firm has operations and the value considered was 5.96%, achieved through the support of Damodaran calculations (1 jan of 2019). To evaluate the stocks volatility it’s necessary to calculate the systematic risk also known as Beta. The leverage beta was obtained multiplying the unlevered beta (retrieved from Damodaran 2019) of 0.34 by the marginal tax rate of 10.15 and the net debt divided to equity ratio. Daimler’s leverage beta was 0.88 and consequently the expected cost of equity was 5.59%.
Daimler’s cost of Debt was assumed at 4.18% taking in consideration Damodaran’s computations for auto & truck industry. The tax margin of 10.15% followed the same assumption take the cost of debt.
Table 6. Debt analysis (1)
Debt to Assets Current ratio Daimler 51.5% 1.24 BMW 41.3% 1.18 Ford 60.1% 2.00 Honda 35.9% 1.23 Toyota 38.8% 1.04 Volkswagen 42.0% 1.13 Nissan 42.4% 1.50
Source: Wall Street Journal
Table 8. WACC Assumptions
Cost of equity
Risk Free Rate 0.2%
Country Risk Premium 0.0%
Market Risk Premium 6.0%
Beta Levered 0.90
Cost of Equity 5.6%
Cost of Debt
Cost of Debt 4.2%
Marginal Tax Rate 10.1%
After-tax cost of debt 3.8%
Capital Structure
Weight of Equity 31.3%
Weight of Debt 68.7%
WACC 4.33%
Source: Students analysis
Table 7. Debt analysis (2)
coverage Interest Debt to EV Daimler 14.04 85.7% BMW 38.58 71.0% Ford 2.26 19.0% Honda 54.96 70.0% Toyota 87.26 58.0% Volkswagen 18.74 90.0% Nissan 23.61 76.0%
According to the variables mentioned the WACC determined was 4.33%, which underlines the company’s capital source. It was assumed to be stable for the forecasted years. According to IMF World Economic Outlook 2019, the terminal growth rate was assumed as 1.40%, value based on the forecasted Real GDP growth rate for Germany in 2022F.
Selection of Peers
The selection of a Peer group for Daimler financial analysis was conducted using a three-step method. Starting with companies that have the automotive and financial division and account for revenues more than €90 million. Finally an analysis is made regarding profitability indicators comparison which led to the final peer selection of Fiat, Honda, Toyota, Nissan and BMW. After analyzing different variables to conduct the valuation, it was concluded that the enterprise value to sales was the most accurate in order to don’t generate disrupted numbers– Table 9.
Relative Valuation
A relative valuation was performed in order to support the results obtained by the WACC model. The forward multiple EV/Sales was able to achieve a target price of €37.50 representing a downside potential of 20.61%. This multiple also states a SELL recommendation.
The EV/EBITDA, EV/EBIT and Price to Earnings (P/E) multiples were not used to calculate Daimler stock value since inaccuracy of comparable would affect the stock value.
The predictions for Daimler’s financial positions are optimistic, although some challenges are also projected. The company is switching their portfolio to electric vehicles, however, is still behind some competitors in the industry which will create some threats in the near future.
Debt to Equity ratio
When comparing the company’s total debt with their total assets, it’s possible to see that Daimler’s has a predicted average of 2.9 meaning that creditors own more than investors of every dollar of the company’s assets. The justification is in the amount of net debt that is predicted (Figure 25) that is going to increase over the years with constant investment in research in development of new power sources.
ROA and ROE
The return on equity measures Daimler’s net profit returned in relation to shareholder equity, meaning how profit can it be for its investor’s. Daimler currently has a ROE close to 11.5% (Figure 26) predicted to increase in upcoming years meaning that the amount generated for each dollar of common stockholder’s equity facing net income will increase.
Divisions forecast
With the increase of electric vehicles, the forecast of sales for Daimler vehicles are going to increase overall. The Mercedes-Benz cars are expecting to reach 3
million-7.
Financial Analysis
Table 10. EV/SALES - Price Target
Comparable Price Target - EV/SALES
EV/Sales Peer 0.82
Sales Daimler 167,362
Firm Value Daimler 161,077
Net Debt -119,569
Minority 1,386
Number of Shares 1,070
Equity Value Daimler 40,122
Price Target 37.50
Source: Wall Street Journal and Students analysis
Table 9. Forward Multiple analysis
Peer Average Daimler EV/EBITDA 5,4 9,6 EV/EBIT 10,9 15,0 P/E 9,1% 6,8% EV/Sales 0,8 1,0
Source: Wall Street Journal and Students analysis
Figure 25. Debt analysis (in thousands)
Source: Students analysis
80 € 100 € 120 € 140 € 160 € 180 € 2018 2019F 2020F 2021F 2022F
Debt NET DEBT
Figure 26. Return on assets and equity ratios 4,16% 2,69% 3,54% 16,3% 11,5% 14,0% 2017 2018 2019F 2020F 2021F 2022F ROA ROE
unit sales in the year 2022, the same year where Daimler stated that 25% of sales should be all electric vehicles – Figure 27. With the constant increase in revenue forecasted it’s possible to assume that the future for this brand is safe, keeping the current strong market share in the world. Daimler Vans are underperforming recently but the expectations are that the situation will reverse, the same with Daimler financial services. Both trucks and buses will continue to keep their momentum with the new generation of autonomous vehicles being produced, which in division is a remarkable change.
Risks to Price Target
In order to access the investment risks on the Daimler target price, a sensitivity analysis was conducted. The variables used were the weighted average cost of capital (WACC) and the percentage of terminal growth. By analyzing table XX it’s possible to understand that both variables are crucial for the price target and a small change can shift the recommendation given.
Ch ang es in W AC C
Changes in Terminal Growth
44.45 0.50% 0.80% 1.10% 1.40% 1.50% 1.60% 1.70% 3.7% 36.13 49.60 66.18 87.09 95.32 104.34 114.26 3.9% 27.44 39.21 53.51 71.23 78.12 85.61 93.79 4.1% 19.73 30.09 42.52 57.72 63.57 69.88 76.72 4.3% 12.82 22.01 32.91 44.45 51.09 56.48 62.28 4.4% 9.63 18.30 28.55 40.84 45.50 50.50 55.86 4.5% 6.61 14.80 24.44 35.94 40.28 44.93 49.90 4.6% 3.73 11.48 20.56 31.34 35.40 39.73 44.36
In order to evaluate the risks associated with an investment in Daimler, a risk assessment matrix was conducted. The objective is to identify and study the possible risks of this investment as well as the respective probability of each one to occur (Figure 28)
Market Risk | Macroeconomics (MR1)
The financial market is and always will be a strong threat to the company’s operations, especially since Daimler is largely dependent from the European and Asian market, representing a total of 80% of business operations. Considering the Brexit situation and the US-China trade war, the consequences of a market recession can be catastrophic, but even with the current instability of the world market, the likelihood remains with a low probability of occurrence.
Market Risk | Sector- specific (MR2)
When analyzing the automotive sector, it’s important to notice that each region has its own specifications, trends and forecast’s. Over the past years it’s the Chinese Market that has been registering the biggest economic growth, which is expected to slow down in the upcoming years. The European Economy grew 2.2% in 2018 and the expectations are that this growth will remain stable but is also dependent from the result of the Brexit deal. Although the US growth in 2018 was 2.9%, representing the biggest increase in the past 10 year, the number of sectors that are being incentivized by the government policies to consume the local products instead of foreign are increasing representing a threat to the companies US sales.
8.
Investment Risks
Figure 27. Revenue of Mercedes-Benz cars (in millions) and unit sales
Source: Students analysis 2.373.527 3.020.444 0 50.000 100.000 150.000 200.000 2017 2018 2019F2020F2021F2022F
Revenue Unit sales
Figure 28. Risk Matrix
Market Risk | Shift in Demand (MR3)
There is no doubt that the current trends of mobility are changing the automotive market. The number of passenger car registrations are already decreasing from the previous years, which can represent both a threat and an opportunity for Daimler, since the production of new cars are increasing. The main contributors for this change are the new ways of mobility such as car-sharing, self-driving vehicles and also the increased number of electronic private transportations (Uber, Cabify, Kapten, etc.).
Operational Risk | R&D (OR1)
Every loss or negative impact caused by failures in governance or operational business process are considered an operational risk. Safety hazards, aging assets and security threats can negatively impact Daimler’s business. The investment by the company in research and development is considerably high but the probability of competitors to be ahead in some existing trends is also high. The outcome of not identifying a trend in an early stage can have a big negative impact in the company future.
Operational Risk | Information Technology (OR2)
The traditional IT risks are concerning both equipment failures in the manufacturing process and also the information system included in each vehicle sold. With the continuous improvement of materials quality and regular audit, these risks can be mitigated.
Operational Risk | Financial situation and dependency of dealerships (OR3) Some dealerships and vehicle importers are facing a difficult financial situation which threw supporting actions, would affect the profitability and cash flows of Daimler’s automotive divisions. The strong dependency of some dealerships is mitigated by continuing to monitor the financial situation of the dealers and in some situations develop relationships with new business partners.
Regulatory and Legal Risk | Environmental Protection (RLR1)
On April 2019 a new regulation was adopted regarding the C02 emission for new passenger cars and light commercial vehicles to start after 2020. In order to minimize environmental risks, Daimler is auditing in a regular basis the all the locations of their divisions.
Regulatory and Legal Risk | Litigation (RLR2)
There is a constant need to have provisions in order to deal with the increased number of regulations being adopted worldwide regarding importations and exportations. Provisions are also necessary to mitigate legal disputes that can occur when dealing with a number of different entities such as employees, costumers, dealers and suppliers.
Financial Risk | Foreign Currency and Interest Rate (FR1)
Being a company that as a worldwide business, it’s normal to face a high exposed foreign country exchange risk. Threw the use of hedging plans, the foreign currency risk is mitigated and with interest swap, cross currency swaps and other interest rate contracts the interest rates risks are also mitigated.
Financial Risk | Liquidity (FR2)
Daimler ensured that will continue to have the liquidity appropriated for the current situation in the financial markets. In order to ensure that the company remains solvent, Daimler measures the risk of liquidity by considering possible temporary distortions in the financial markets to guarantee that the company remains with credit rating AAA.
Appendix A: Balance Sheet Statement
A-1: Projected Balance Sheet Statement
In Million Euros 2017 2018 2019F 2020F 2021F 2022F
NON-CURRENT ASSETS
Intangible assets 13,735 14,801 13,944 14,875 15,867 16,926
Property plant and equipment 27,981 30,948 31,018 33,088 35,296 37,651
Equipment on operating leases 47,074 49,476 50,120 53,464 57,031 60,836
Equity-method investments 4,818 4,860 4,538 4,841 5,164 5,508
Receivables from financial services 46,600 51,300 49,832 53,157 56,703 60,487
Marketable debt securities 990 722 1,278 1,363 1,454 1,551
Other financial assets 3,204 2,763 4,133 4,409 4,703 5,017
Deferred tax assets 2,844 4,021 4,296 4,583 4,889 5,215
Other assets 1,203 1,115 964 1,028 1,097 1,170
Total non-current assets 148,449 160,006 160,124 170,808 182,204 194,361
CURRENT ASSETS
Inventories 25,686 29,489 29,204 31,153 33,231 35,448
Trade receivables 11,995 12,586 12,304 13,125 14,000 14,934
Receivables from financial services 39,454 45,440 42,800 45,655 48,701 51,951
Cash and cash equivalents 12,072 15,853 23,903 24,512 25,161 25,854
Marketable debt securities 9,073 8,855 9,259 9,876 10,535 11,238
Other financial assets 3,602 2,970 3,333 3,556 3,793 4,046
Other assets 5,014 5,889 5,512 5,880 6,273 6,691
Assets held for sale – 531 113 121 129 138
Total current assets 106,896 121,613 126,428 133,877 141,823 150,300
Total assets 255,345 281,619 286,552 304,685 324,027 344,660 EQUITY
Share capital and capital reserves 14,812 14,780 14,780 14,780 14,780 14,780
Retained earnings 47,553 49,490 57,133 60,945 65,011 69,349
Other reserves 1,504 397 1,391 1,484 1,583 1,689
Equity attributable to shareholders of Daimler AG 63,869 64,667 73,304 77,209 81,374 85,817
Non-controlling interests 1,290 1,386 1,358 1,449 1,546 1,649
Total equity 65,159 66,053 74,662 78,658 82,920 87,466
NON-CURRENT LIABILITIES
Provisions for pensions and similar obligations 5,767 7,393 10,527 11,229 11,978 12,777
Provisions for income taxes 1,046 628 1,030 1,098 1,172 1,250
Provisions for other risks 7,143 7,734 8,056 8,594 9,167 9,779
Financing liabilities 78,378 88,662 80,514 85,885 91,616 97,728
Other financial liabilities 2,370 2,375 3,211 3,426 3,654 3,898
Deferred tax liabilities 2,347 3,762 2,944 3,141 3,350 3,574
Deferred income 1,668 1,612 4,145 4,422 4,717 5,031
Contract and refund liabilities 3,833 5,438 4,985 5,317 5,672 6,051
Other liabilities 10 10 19 20 21 23
Total non-current liabilities 102,562 117,614 115,430 123,131 131,347 140,110
CURRENT LIABILITIES
Trade payables 12,451 14,185 13,747 14,665 15,643 16,687
Provisions for income taxes 560 823 866 924 986 1,051
Provisions for other risks 7,620 7,828 9,841 10,498 11,198 11,945
Financing liabilities 48,746 56,240 53,464 57,031 60,836 64,895
Other financial liabilities 6,905 7,657 9,841 10,497 11,198 11,945
Deferred income 1,528 1,580 2,825 3,014 3,215 3,429
Contract and refund liabilities 7,375 7,081 3,115 3,323 3,544 3,781
Other liabilities 2,439 2,346 2,715 2,896 3,090 3,296
Liabilities held for sale – 212 45 48 51 55
Total current liabilities 87,624 97,952 96,460 102,896 109,761 117,084
Total equity and liabilities 255,345 281,619 286,552 304,685 324,027 344,660 Source: Company data and student estimates