M
ASTER OF
S
CIENCE IN
FINANCE
M
ASTERS
F
INAL
W
ORK
PROJECT
EQUITY RESEARCH
:
THE
WALT
DISNEY
COMPANY
M
IGUEL
S
OUSA
M
ONTES
F
ERREIRA
B
ARBOSA
M
ASTER OF
S
CIENCE IN
FINANCE
M
ASTERS
F
INAL
W
ORK
PROJECT
EQUITY RESEARCH
:
THE
WALT
DISNEY
COMPANY
M
IGUEL
S
OUSA
M
ONTES
F
ERREIRA
B
ARBOSA
S
UPERVISOR
:
P
ROF
.
D
OUTOR
J
OÃO
C
ARVALHO DAS
N
EVES
Abstract
This Equity Research Report was written as a MSc in Finance’s Final Work and follows
the format recommended by the CFA Institute.
The Walt Disney Company was chosen for this Final Work for several reasons: firstly,
it is a company with a long and interesting history, with its ups and downs, which
provides a learning opportunity while studying it; secondly, its business is across
several segments which despite showing significant differences are highly synergetic
and in some cases changing the entertainment business paradigm; thirdly and most
importantly, we knew beforehand that the Company had gone through a business
restructuring and was in the middle of an acquisition process. The second and third
reasons increased the challenge considerably, which in our opinion was fitting for a
proper Master’s Final Work. Naturally, the COVID-19 pandemic increased the
challenge even further and as such, was accounted for in this project.
To value Disney, we employed a DCF Model as well as a DDM and multiples analysis.
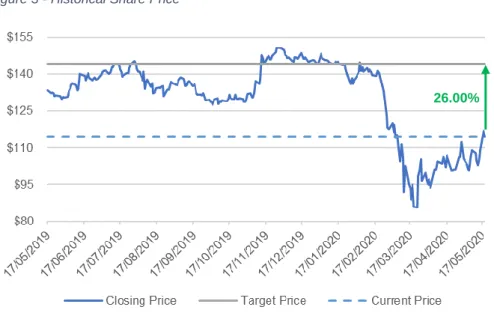
A price target of USD 144.11 was reached, implying a 26.00% upside potential from
our reference price of USD 114.37 on May 19, 2020, and a Buy recommendation.
JEL classification: G10; G12
Resumo
Este Relatório de Equity Research foi escrito como Trabalho Final de Mestrado em
Finanças e segue o formato recomendado pelo CFA Institute.
A escolha da The Walt Disney Company para este trabalho deveu-se a vários motivos:
a longa e interessante história da empresa que, com pontos altos e baixos, é uma
oportunidade de aprendizagem com o seu estudo; o seu negócio dividido em vários
segmentos que, apesar de terem diferenças significativas, são altamente sinergéticos
e, em alguns casos, estão mudar o paradigma da indústria do entretenimento; mais
importantemente, sabiamos à partida que a empresa tinha passado por uma
reestruturação e que se encontrava num processo de aquisição. A segunda e terceira
razões elevaram o desafio significativamente, o que, na nossa opinião, seria
apropriado para um verdadeiro Trabalho Final de Mestrado. Naturalmente, a
pandemia COVID-19 desafiou-nos adicionalmente e, como tal, foi considerada neste
projecto.
Para avaliar a Disney, utilizámos um modelo DCF, bem como um DDM e uma anállise
de múltiplos. Chegámos a um price target de USD 144.11, implicando um upside de
26.00% face ao preço de USD 114.37 a 19 de Maio de 2020 e levando a uma
recomendação de Buy.
Classificação JEL: G10 ; G12.
Palavras-Chave: Equity Research; Avaliação de Empresas; Indústria de
Index
Abstract i Resumo ii Index iii List of Figures iv Research Snapshot 1 Investment Summary 2 Business Description 3Management and Corporate Governance 5
Industry Overview and Competitive Positioning 6
Valuation 11
Financial Analysis 15
List of Figures
Figure 1 - Basic EPS (USD) 1
Figure 2 - 5Y Monthly Returns 1
Figure 3 - Historical Share Price 1
Figure 4 – 52-week VIX Performance 1
Figure 5 - DCF Valuation 2
Figure 6 - Subscribers, by Service 2
Figure 7 - Confirmed Feature Films, by Franchise 2
Figure 8 - Available Room Nights 2
Figure 9 - Employee Count, by Year 3
Figure 10 - Revenues, by Segment 3
Figure 11 - Geographical Revenues Breakdown FY19 4
Figure 12 - Ownership Structure 5
Figure 13 - NEO's Compensation 5
Figure 14 - NEO's Compensation Breakdown 5
Figure 15 - Board of Directors and Committees 6
Figure 16 - ESG Scores Summary 6
Figure 17 - ISS Governance QualityScore 6
Figure 18 - Porter's Five Forces 6
Figure 19 - Real GDP Growth 8
Figure 20 - SWOT Analysis 8
Figure 21 - Inflation Rate 8
Figure 22 - Unemployment Rate 8
Figure 23 - Debt-to-GDP Ratio 9
Figure 24 - MN Revenues Breakdown 9
Figure 25 - PEP Revenues Breakdown 9
Figure 26 - SE Revenues Breakdown 10
Figure 27 - DTC&I Revenues Breakdown 10
Figure 28 - COGS and Gross Profit Margin 11
Figure 29 - Operational Profitability 12
Figure 30 - MN Comparable Companies 15
Figure 31 - PEP Comparable Companies 15
Figure 32 - SE Comparable Companies 15
Figure 33 - DTC&I Comparable Companies 15
Figure 34 - Margin Breakdown 15
Figure 35 - Operating Cycle 16
Figure 36 - Liquidity Ratios 16
Figure 37 - Debt Ratio Breakdown 16
Figure 38 - Disney's Risk Matrix 17
Figure 39 - Maximum Daily VaR Breakdown 17
Figure 40 - Price Target Sensitivity 17
Figure 41 - Monte Carlo Simulation 18
Figure 42 - Price Target Sensitivity Analysis 18
Figure 43 - Upside and Recommendation Sensitivity Analysis 18
Disney: The Happiest Stocks on Earth
Research Snapshot
A Price Target of USD 144.11 (+26.00%) with Medium Risk drives a Buy Recommendation.
Key Information
Security Ticker: NYSE: DIS 52-Week High: USD 153.41 Sh. Outstanding: 1,81 Billion 52-Week Low: USD 79.07 Market Cap.: USD 206.58 Bn Current Price: USD 114.37
The Walt Disney Company1 is an American, California-based mass media and
entertainment company. Renowned and established as one of the leading companies in its industry, Disney operates globally across four main business segments: Media Networks (MN); Parks, Experiences and Products (PEP); Studio Entertainment (SE); Direct-to-Consumer and International (DTC&I).
Stock Performance
Figure 3 - Historical Share Price
Following the recent share price plunge due to the COVID-19 pandemic, the opportunity for taking a long position in DIS and riding a significant upside of 26.00% arises. In this analysis, a detailed explanation of how a price target USD 144.11 was reached as well as how the Company will drive earnings in the future will ensue.
As part of the S&P 500 index since 1976, and with a 40-year history of increasing dividend payments, The Walt Disney Company certainly is a blue-chip stock that will suit most investors at some point in their investing careers.
1 In this Report, The Walt Disney Company in its consolidated form shall be referred to as “The Walt
Disney Company”, “Disney”, ”DIS”, “the Company” or “the Firm”.
The Walt Disney Company
BUY
Medium Risk
May 19th, 2020
Figure 2 - 5Y Monthly Returns
Figure 4 – 52-week VIX Performance Figure 1 - Basic EPS (USD)
Investment Summary
Based on a Price Target of USD 144.11, representing an upside potential of +26.00% compared to current price and with a Medium Risk assessment, we issue a Buy recommendation for The Walt Disney Company (NYSE: DIS).
Despite recent extreme market uncertainty and volatility driving DIS prices to 52-Week Low values of USD 79.07, high top line growth is expected for the coming years as consequence of solid strategy and strong investment across the different business segments.
Netflix contender in the making
As subscription-based business models are on the rise and spearheaded by the global success of Netflix, Disney’s builds on both past and present strategic decisions with the investment on ESPN+ and Hulu acquisition as well as the recent launch of the DTC&I’s segment flagship project Disney+ and creates a vertically integrated business boasting best-in-class content at extremely competitive prices.
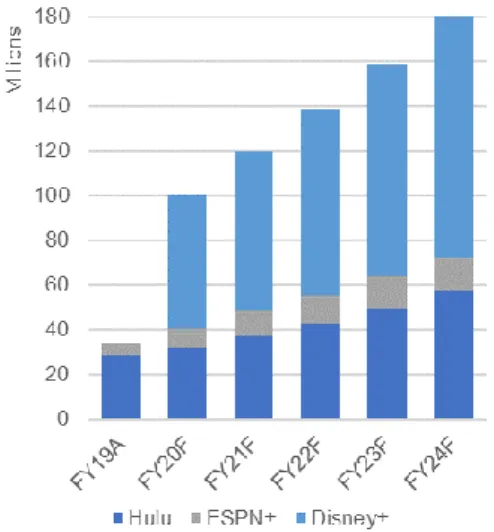
With 6-month old Disney+ counting with 54.5 million subscribers as of May 4th, 2020
(+105.7% since FY2020 Q1) as well as Hulu and ESPN+ with 32.1 and 7.9 million subscribers, respectively, the Company is becoming a serious threat for Netflix and its 182.9 million subscribers obtained over the course of 13 years.
We estimate Disney+ reaching nearly 95 million subscribers by FY24 and driving the DTC&I segment’s revenues upwards to USD 25.9 billion.
Strong and Diversified Content
While under the leadership of former CEO and current Chairman Bob Iger, Disney went through a series of high-profile acquisitions (Pixar, Marvel and Lucasfilm) that, paired with the company’s classic intellectual property portfolio, form a collection of characters and stories that is enjoyed worldwide and has the potential to be expanded and explored for years to come.
Not only does this content drive revenues at the Studio Entertainment segment, with expected growth towards USD 17.1 billion in FY24 from USD 11.1 billion in FY19, but it generates opportunities in all other segments as well, ranging from new attractions, thematic lodging and consumer products at the PEP segment to exclusive distribution rights for the MN and DTC&I segments.
Expanding Hotels and Cruise Line
Despite admittedly focusing on a strategy of price climbing on the Parks, Experiences and Products in the recent past, the Company will be pivoting soon and betting on expanding capacity.
From FY21 to FY24, three new hotels will be opening (Star Wars Galactic Starcruiser Hotel, The Cove Hotel and Reflections: A Lakeside Lodge) increasing capacity by 1,349 rooms. Paired with this, Disney Cruise Line will be launching its new ship, Wish, as well as two other similar unnamed cruises on their maiden voyages, increasing available cabin numbers by 3,750. Consequently, Available Room Nights will grow from 13.2 million in FY19 to 15.1 million in FY24, supporting the PEP segment’s revenues increase from USD 26.2 billion in FY19 to roughly USD 32.1 billion by FY24.
Valuation Overview
Our Price Target of USD 144.11 is the result of the application of our elected primary absolute valuation method, specifically a Two-Stage Enterprise Discounted Cash Flow model. To further support our recommendation, we performed two additional valuations through both absolute and relative methods. For the secondary absolute valuation method, we built a Three-stage Dividend Discount model, using an H-Model for the second and third stages, and for the relative valuation method we used arithmetic average Price/Sales multiples based on comparable companies for each segment and performed a sum of the parts approach.
For the absolute valuation methods, a consolidated approach was undertaken, as available information was found insufficient to accurately assess each segment’s cash flows and practice a sum of the parts calculation.
Figure 6 - Subscribers, by Service
Figure 7 - Confirmed Feature Films, by Franchise
Figure 8 - Available Room Nights
Enterprise Value 301.6 Bn
Net Market Value of Debt 40.7 Bn
Equity Value 260.8 Bn
Shares Outstanding (millions) 1.81 Bn Price Target (USD) 144.11 DIS Price @ 19/05/2020 114.37
Upside Potential 26.00%
Business Description
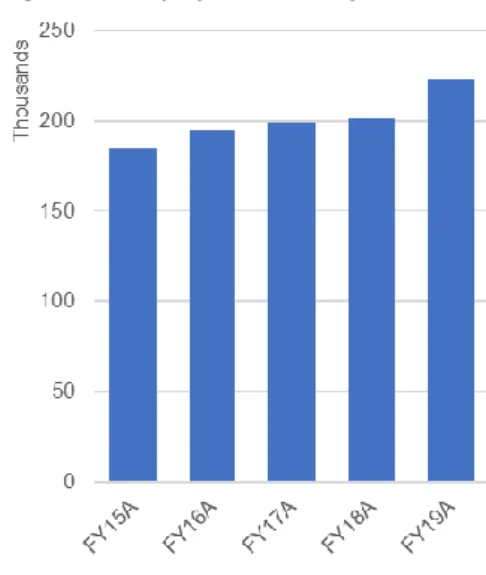
The Walt Disney Company is a diversified worldwide entertainment company, providing services ranging from TV and movie production and distribution to theme parks, cruises and resorts as well as consumer goods. Recently, the company has also ventured into direct-to-consumer distributing via its subscription-model businesses. As of September 28th, 2019, it employed approximately 223,000 people across the globe.
Company History
Disney was founded in 1923 as a cartoon studio by Walter Elias Disney. In 1928, the creation of Mickey Mouse along with other characters such as Minnie Mouse and Donald Duck would become the foundation of a company which has now grown beyond animation. In 1934, Disney began the production of its first feature-length film, Snow White and the Seven Dwarfs, premiering in 1937 and becoming the highest-grossing film of that time. The profits were used to finance the construction of a studio complex in Burbank, California, where the current headquarters of the Walt Disney Studios are located to this date. Later, in 1952, Walt Disney announced plans for a theme park which would become Disneyland, opening in 1955. Only decades later, in 1983, would Disney open its first park outside the US, Tokyo Disneyland. One year later, Michael Eisner was named chairman and the company enters the Disney Decade, leaping forward with a series of new attractions and movies. In 2005, Robert A. Iger took over as CEO and The Walt Disney Company was named as the World’s Most Reputable Company by Forbes Magazine and one of America’s Most Admired Companies by Fortune Magazine. The following years brought a series of high-profile acquisitions, namely Steve Jobs’ Pixar, Marvel Entertainment, Lucasfilm and Twenty-First Century Fox, cementing Disney’s spot as one of the most relevant companies in the Entertainment Industry history. In February 2020, Bob Chapek, former head of the Parks, Experiences and Products segment, was appointed as CEO, while Bob Iger remains with the company as Chairman.
Operational Segments
The Company is divided in four business segments: Media Networks; Parks, Experiences and Products; Studio Entertainment; and Direct-to-Consumer and International.
Media Networks
The Media Networks segment includes cable and broadcast TV networks, TV production and distribution, domestic TV stations and radio networks and stations. Besides this, it also has investments in entities that operate programming services, including TV networks. The primary cable networks are ESPN, Disney, National Geographic, Freeform and FC branded domestic networks. These produce their own programs and acquire rights from third parties to air programs. On the broadcasting business, the Company operates the ABC Television Network, which channels reach roughly 100% of American households. Significant equity investments include A+E and Vice, operating a variety of channels such as A&E and History, and CTV, which owns television channels in Canada.
The segment mainly generates revenue through: fees charged to cable, satellite and telecom service providers, over-the-top digital Multi-channel Video Programming Distributors (MVPD's) and TV stations affiliated with its domestic broadcast television network for the right to deliver its programs to their customers; ad sales, in the form of providing time for advertisers in its programs; licensing fees and other revenues from content transactions with other Company segments. Significant expenses encompass: programming, production, technical support, distribution, and operating labour costs; selling and administrative costs; depreciation and amortization.
Parks, Experiences and Products
In recent years, over 75% of the Company’s capital expenditure has been allocated to the PEP business, primarily for theme park and resort expansion, new attractions, cruise ships and information systems infrastructure. The segment’s operations include: Walt Disney World, Florida; Disneyland Resort, California; Disneyland Paris; Disney Cruise Line; Disney Vacation Club; National Geographical Expeditions; and Adventures by Disney and Aulani, Hawaii. The Company also manages and has effective ownership interests of 47% in Hong Kong Disneyland Resort and 43% in Shanghai Disneyland Resort and licenses its intellectual property to a third party to operate Tokyo Disney
Figure 9 - Employee Count, by Year
Resort in Japan. Besides these operations, the segment does business in the licensing of intellectual property to various manufacturers, game developers, publishers, and retailers as well as with the sale of branded merchandise and development and publishing of books and magazines.
Revenues are mainly driven by: sales of theme park admissions, merchandise, food and beverages at the parks, cruises and resorts; room nights at hotels and cruises and rental of other vacation club properties; royalties from intellectual property licensing and sales of merchandise; and revenues from sponsorships and co-branding opportunities. Expenses are mostly related to: COGS; operating labour, infrastructure, supply, commission, and entertainment offering costs; Selling, general and administrative costs; D&A costs.
The parks, resorts, cruises, and Vacation Club compete with other forms of lodging, tourism and recreational activities. The profitability of this industry may be influenced by the economic conditions during the business cycle, exchange rate fluctuations, political environment, travel industry trends, weather patterns and natural disasters amongst others. Typically, attendance and occupancy fluctuate based on the seasonal nature of vacation travel and leisure activities, and the opening of new guest offerings and promotional offers. Peak attendance and occupancy usually occur during the summer months and during early-winter and spring holiday and the consumer product businesses are influenced by seasonal consumer purchasing behaviour as well as the timing and performance of theatrical and game releases. This generally results in higher revenues during the Company’s first and fourth fiscal quarters.
Studio Entertainment
The Studio Entertainment segment produces and acquires live-action and animate motion pictures, musical recordings, live stage plays and offers post-production services. Significant operations include: Walt Disney Pictures; Twentieth Century Fox; Marvel; Lucasfilm; Pixar; Fox Searchlight Pictures; and Blue Sky Studios.
The businesses related to the SE segment mainly generate revenues from: distribution of films in the theatrical, home entertainment, television and SVOD markets; stage play ticket sales; music distribution; and licensing of intellectual property for use in live entertainment productions. The most relevant costs incurred refer to: amortization of production; participation, marketing and sales costs; and distribution expenses.
The SE business competes with all forms of entertainment and competes for creative and performing talents, story properties and advertiser support that are essential to its success. Profitability of the segment is heavily dependent on public taste and preferences. Additionally, results fluctuate due to the timing and performance of releases in the theatrical, home entertainment and television markets, which are determined by factors including competition and the timing of vacation and holiday periods.
Direct-to-Consumer and International
The DTC&I segment encompasses several international television networks and channels including: Disney; ESPN; FOX; National Geographic; and Star. It also operates Direct-to-Consumer streaming services as Disney+, ESPN+, Hulu and Hotstar. Moreover, the business owns a series of relevant ownership interest investments, namely in: Endemol Shine Group; Seven TV; Tata Sky; and Vice Group Holdings, Inc.
Revenues are mostly obtained through: sales of advertising time in the international channels; fees charged to MVPD’s for the right to deliver the international channels to their customers; and subscription fees charged for Disney’s streaming services. The main drivers of expenses are: programming, production, technical support, operating labour and distributing costs; selling, general and administrative costs; and depreciation and amortization.
The segment competes for viewers with other TV and cable networks and other media, such as online video services and video games. Moreover, it competes with these players and newspaper, magazines and billboards for the sale of advertising time. Competition in the International Channels extends to carriage from MVPD’s against other networks. Finally, both the International Channels and DTC businesses compete with other media entertainment companies for the acquisition of sports right, talent, show concepts and other programming. Revenues fluctuate based on the timing and performance of releases, viewership levels on the cable channels and digital platforms, changes in subscriber levels and the demand for sports and other content.
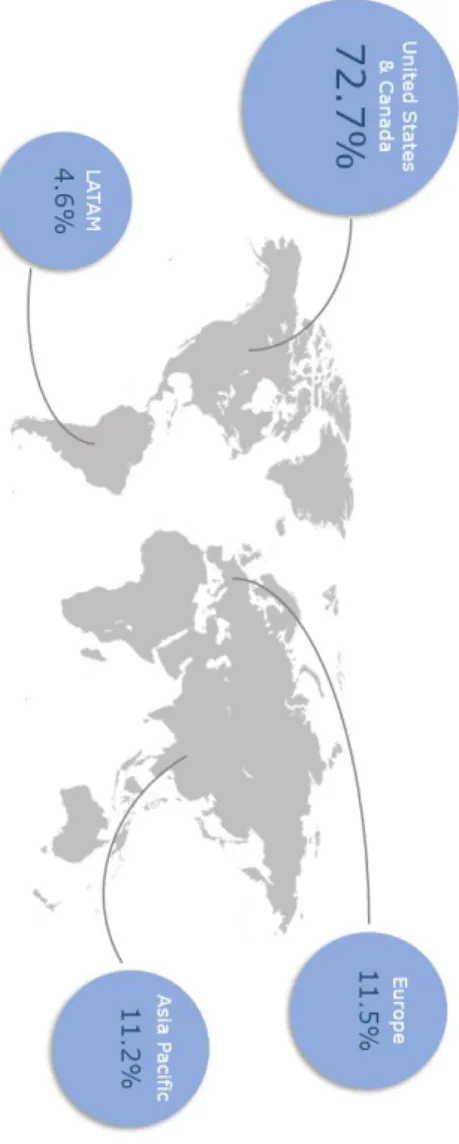
Figure 11 - Geographical Revenues Breakdown FY19
Ownership Structure
Currently, Disney’s available shares are composed exclusively of common stocks. A significant part (67%) of Disney’s equity is owned by institutional investors. This comes as no surprise, as the Company is part of the Dow Jones Industrial Average and S&P 500 indexes. This drives interest from corporations that do business providing passive investment tools such as index funds and ETF’s as reflected by The Vanguard Group, Inc (8%), BlackRock, Inc (6%) and Fidelity Investments (2%) interests in DIS. The firm’s history of over 40 years of regular and increasing dividend payments classifies it as a blue-chip stock, driving interest and ownership from a myriad of investment banks and other financial institutions.
Management and Corporate Governance
The Walt Disney Company has an assigned Board of Directors, which responsibility is to supervise and direct the management of the firm in the best interests and for the benefit of the Company’s shareholders. To do so, the Board can act directly or through appointed committees. To this end, it has currently established four committees: Executive; Audit; Compensation; and Governance and Nominating. Although the Board is responsible for selecting its own members via the Governance and Nominating Committee, there are mechanisms in place in order to guarantee that the Board is aligned with shareholder interests, namely that a substantial majority of Directors be independent of the Company and its management. Moreover, the Directors are required to hold a significant equity interest in Disney, consistent with their responsibilities to the shareholders. Currently, all of the Directors are considered materially independent.
Executive Leadership
At its leadership, the Firm counts with a group of seasoned senior executives responsible for guaranteeing that the Company’s objectives and strategies are achieved and properly executed. As a publicly traded company, Disney must comply with SEC regulations, specifically it must annually disclose its Named Executive Officers: CEO; CFO; and the three most highly compensated executive officers). As of FY19, the declared NEO’s were:
Robert A. Iger, Chairman and CEO
Mr. Iger has had a long and rich career in the entertainment industry. Having started his professional life as a local weatherman, he soon moved to ABC where he would quickly climb the corporate ladder and go on to be named Executive Vice President in 1993, later being named President and COO of Capital Cities/ABC and remaining so after Disney’s acquisition of ABC. In 2000 he became former CEO Michael Eisner’s right-arm as President and COO of The Walt Disney Company and later succeeded him as CEO following Roy E. Disney’s second “Save Disney” campaign. From then on, he fixed the Company’s relationship with former Pixar’s CEO Steve Jobs and went on to pave a path of tremendous acquisitions – Pixar (2006); Marvel (2009); Lucasfilm (2012); Twenty-first Century Fox (2019) – leading Disney’s way as one of the world’s biggest entertainment companies. As the firm’s strategic leader, he focuses on three pillars: generating the best content possible, fostering innovation and utilizing the latest technology and expanding into new markets worldwide. In February 2020, Mr. Iger retired as CEO, being succeeded by Bob Chapek, former Chairman of Disney’s Parks, Experiences and Products business.
Christine M. McCarthy, Sr. Executive VP and CFO
Ms. McCarthy oversees the Company’s worldwide finance organization including: brand and franchise management; corporate alliances; real estate; strategy; enterprise controllership; social responsibility and technology; financial planning & analysis; global product and labor standards; investor relations; risk management; and tax and treasury. She has been Disney’s CFO since 2015 and, prior to joining the firm, she served as Executive Vice President and CFO of Imperial Bancorp. In addition to her current role, she is also part of the Board of Directors of P&G and FM Global.
Alan E. Braverman, Sr. Executive VP and General Counsel
Mr. Braverman serves as the Chief Legal Officer and oversees the team of attorneys responsible for the Company’s legal affairs globally. He became Partner at Wilmer, Cutler
Figure 12 - Ownership Structure
Figure 13 - NEO's Compensation
Figure 14 - NEO's Compensation Breakdown
& Pickering in 1983 and joined ABC in 1993 as Vice President and Deputy General Counsel. He has been a named Executive Vice President and General Counsel of The Walt Disney Company since 2003.
M. Jayne Parker, Sr. Executive VP and Chief HR Officer
Jayne Parker has been the Company’s Executive Vice President and CHRO since 2009 and is Responsible for leading Disney's: HR strategy; talent acquisition; leadership development; organizational design and cultural developm ent; and compensation & benefits. Parker has personally overseen the acquisitions of Marvel, Lucasfilm and controlling interest in BAMTech resulting in an employee growth of 30,000 people. Prior to her current role she had increasing responsibilities at Disney’s Parks and Resorts and Organization and Professional Development.
Zenya B. Mucha, Sr. Executive VP Corporate Communications
Ms Mucha joined Disney in 2001 as Senior Vice President, Communications for ABC’s Broadcast Group and Television Network. Prior to that, she served as Communications Director to NY State Governor George Pataki and US Senator Alfonse D’A mato. Ms. Mucha currently serves as the Company’s Chief Spokesperson and is responsible for global communications for The Walt Disney Company, overseeing communication strategy and media relations as well as the philanthropic and environmental initiatives. She was a key player in all recent Disney’s strategic business initiatives, including the acquisition of Pixar, Marvel and Lucasfilm as well as the Company’s first theme park in China. She became a NEO in 2018, replacing the slot previously taken by Mr. Kevin A. Mayer, the Company’s Chairman of DTC&I.
Environmental, Social and Governance Rankings
In terms of ESG scores, Disney has a global ISS Governance QualityScore of 8 on a 1-10 scale, where the higher values represent higher governance risk. This score is subdivided in four pillars: Audit (1); Board Structure (1); Shareholder Rights (3); and Compensation (10). Besides this, it scores 15 out of 100 (with 100 representing the highest unmanaged risk) in the Sustainalytics’ ESG Rating, divided in three pillars: Environment (0); Social (5.3); and Governance (9.3). Regarding sustainability, the Company scores 25 out of 100 (with 100 being the best) in S&P’s SAM ESG Score and has a CDP Climate Score of B-. Finally, it has a Sustainalytics’ Controversy Rating of 2, compared to the its peers score of 1.6, being that 2 is considered Moderate and 4 is the threshold for Severe.
Industry Overview and Competitive Positioning
Porter’s Five Forces
Industry Rivalry – High (4)
Except for the SVOD industry, Disney operates in mature industries with few but proven competitors with high market shares, which brings a moderate degree of competition. Nonetheless, this if offset by the fact that the Company is a conglomerate, leveraging high brand loyalty across all business segments. In terms of expected growth for the total Media & Entertainment industry, PwC forecasts revenues growing at a 4.3% CAGR until 2023 as well as increasing weight in digital and OTT. This paints a positive outlook for DIS, as it rides its Disney+ and Hulu businesses into the future with the aid of up and coming 5G technology, reducing risk of competitors making aggressive moves to steal market share, as the market itself keeps growing. Besides this, Disney’s business is highly product differentiated. The Company’s image of family-friendly business paired with ownership of universally recognized cartoon characters as well as Marvel Studios and Lucasfilm content bring a tremendous amount of brand loyalty into the equation, weakening the threat of rivals. Nonetheless, we still see a high degree of rivalry due to: high fixed costs in the industries where the Company operates, implying a need to strive to full capacity production and possible price reduction in times of lower demand; creation of new products demanding large amounts of capacity expansion, possibly leading to overproduction; rivals such as Universal also have their own product trump cards such as the Harry Potter franchise, diverting revenues from both the distribution and theme park business segments; and high exit barriers as the Entertainment industry demands substantial investment in capital and assets, and operating globally exposes Disney and
ISS Governance QualityScore 8
RobecoSAM Ranking 25
Sustainalytics' ESG Rating 15
Sustainalytics' Controversy Rating 2
CDP Climate Score
B-Figure 16 - ESG Scores Summary
Figure 17 - ISS Governance QualityScore
Figure 18 - Porter's Five Forces
Figure 15 - Board of Directors and Committees
its competitors to regulations and governmental policies which can hinder their capacity to leave the business.
Bargaining Power of Buyers – Low (2)
As mentioned previously, buyers in the industries in which Disney operates do not have a large portfolio of suppliers to choose from. As such, their control over pricing is limited, weakening their bargaining power. Despite switching costs being low for consumers, product differentiation is high, leaving consumers with few alternative choices. Ultimately, this offsets the low switching costs, as buyers are forced to forego their preference when opting for other suppliers. Finally, brand loyalty plays a major role in these industries and product and service quality gain importance as consumers are willing to pay a premium for products that resonate with them. In the Company’s case, this is especially apparent in the PEP segment, which has been growing revenues with a strategy of price climbing, significantly increasing park admission prices (8%), hotel room rates (2%) and cruise line ticket prices (1%) compared to PY values. Consumer price-sensitivity in this case is therefore considered low.
Bargaining Power of Suppliers – Low (2)
The main suppliers in the Media & Entertainment industry are technology, distribution, and raw material suppliers. The products offered are standardized and consequently supplied by many players in the market. As such, the bargaining power of suppliers is hindered. Besides this, Disney’s sheer size implies that it is a very significant client for its trade partners, driving them to forego intense negotiations in order to maintain their supplier contracts in the future and ultimately empowering DIS to dictate the prices agreed upon. Moreover, the Company is a vertically integrated conglomerate, and synergies derived from such a strategy act as a hedge to supplier pressure, compared to its competitors.
Threat of New Entrants – Moderate (3)
As human capital investment and CAPEX needed to break into the mass Media & Entertainment industry is high, the commitment and resources needed by new players is also high, lowering their likelihood of success. On the supply-side of the business, economies of scale also play a role, as industry titans significantly drive variable costs on products downward while new entrants are faced with more expensive deals. Other entry barriers are present as well, in the form of significant brand loyalty and strict licensing and legal requirements to operate in the industry. Nonetheless, distribution channels in the movie and production are becoming more accessible due to technology advancement and on the rise subscription-based business models, empowering smaller companies to reach their customers. This is also true in the Hotel & Resort industry, where smaller competitors with lower cost structures such as boutique hotels and even private renters grow their reach through Airbnb and HomeAway styled solutions
Threat of Substitutes – Moderate (3)
Buyer price-sensitivity is low, and consumers do not flinch at the prospect of paying a premium for resonating products and services. As such, it is unlikely that cheaper alternatives will be able to motive changes in consumer preference. Nonetheless, the amount of substitutes available is high, as virtually any entertainment alternative can be seen as a substitute for Disney’s products and services. This, paired with low switching costs, mean that the Company’s alignment with consumer preference and tastes is a key factor in client retention.
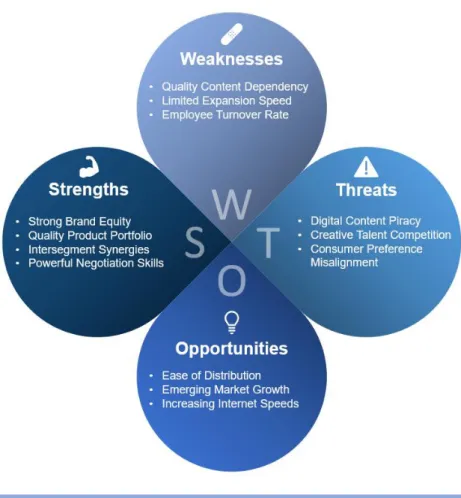
SWOT Analysis
Figure 20 - SWOT Analysis
Macroeconomic Outlook
To properly assess Disney’s business outlook, a better understanding of the main economic environments where the Company operates is necessary. Currently, due to the COVID-19 pandemic, uncertainty is extremely high and no medium to long-term economic forecasts are available. Nonetheless, it is our opinion that negative shocks that the economies will face will be short-term in nature, as they are being caused by extraordinary governmental actions and not by underlying economic factors. As such, we believe that as economies start their return to normality, economic indicators will tend to move towards pre-pandemic forecasted values.
United States
Overall, the US economy has been evolving at a good pace, with real GDP growing at a 2.6% CAGR from FY17 to FY19. Before the COVID-19 pandemic, the IMF expected real GDP growth to be 2.1% for FY20 and 1.8% for FY21, stabilizing at values around the 1.6% mark from then on. Inflation was believed to increase from a 1.8% value in FY19 and stabilize at about 2.3% from FY20 to FY24, therefore being slightly higher than the Fed’s target rate of 2.0%. The unemployment rate expected for FY20 and FY21 was of 3.5% moving towards 3.9% in FY24. American debt was also expected to grow even more beyond total GDP, from 106.2% in FY19 to 108.0%, 110.0%, 112.3%, 114.2% and ultimately 115.8% in FY20, FY21, FY22, FY23 and FY24, respectively. Due to the pandemic, we expect real GDP growth values for FY20 to be different and naturally darker. This is supported by a surprise values of -4.8% real GDP growth (QoQ) for Q1 compared to the expected -4.0%, and Housing Starts of 1,2 million in March against the expected 1,3 million. Nonetheless this is partially offset by a positive surprise value of March’s Manufacturing PMI of 49.1 versus an expected 45.0. Inflation and unemployment are also expected to suffer a negative shock in 2020, as YoY CPI change presented a 1.5% value which was 0.1% lower than expected and Initial Jobless Claims for the first two weeks of April exceeding 6.6 million in both cases, representing historical records for this indicator.
Figure 19 - Real GDP Growth
Figure 21 - Inflation Rate
Europe
Prior to the COVID-19 situation, European real GDP growth was expected to be at 1.7% YoY from FY20 to FY23, and 1.6% in FY24. Except for a 2.0% value in FY20, inflation was expected to be higher than the European Central Bank’s target of 2.0% and hover at values between 2.2% and 2.3% from 2021 through 2024. Unemployment was expected to show a positive outlook, dropping from 7.7% in 2019 to 7.5% in 2020 and 7.3% and ultimately 7.2% by 2021 and 2023, respectively. Debt levels are expected to continue their downwards trend, moving progressively from 71.6% in FY20 to 67.0% in 2024. Although real GDP growth is expected to take a hit in FY20, based on an underwhelming Manufacturing PMI off 44.5 in March versus the expected 44.7, the different economies are slowly reopening and showing positive signs, such as a March unemployment rate of 7.4% against an expected 7.7% and an healthy preliminary April CPI release of 0.4% YoY surpassing the 0.1% expectations.
Asia and Pacific
In the APAC region, real YoY GDP growth is expected remain high at rates of 4.9% in FY21 and 5.2% from FY22 to FY24, while inflation is expected to stay at 3.3% from FY21 to FY23 and slightly increase to 3.4% in FY24. Unemployment and debt-to-GDP ratios are expected to progressively increase from 3.0% and 84.7% in FY20 to 3.2% and 88.5% in FY24, respectively. As the ground-zero for the global pandemic still in 2019 and previous experience with SARS in the early 2000’s, this region was the first to suffer its effects but also the first to respond, and in many cases (i.e.: Hong Kong), has had a fast recovery to normality. As such, we expect the negative shocks in 2020 to be slightly lessened compared to other regions.
Latin America and the Caribbean
For LATAM, an economic growth acceleration is expected, as real YoY GDP growth rates are predicted to jump from 0.8% in FY19 to 1.8% in FY20, hiking to 2.4% in FY21 and moving towards 2.7% by FY24. Inflation is expected to decelerate from 7.2% in FY19 to 6.7% in FY20 and gradually move to 4.3% by FY24. On the other hand, unemployment is expected to see a slight increase, reaching 3.0% in FY20, 3.1% in FY21 and 3.2% in FY23. Debt levels are forecasted to have a gradual drop from 69.6% in FY19 to 67.0% in FY24. COVID-19’s impact in this region is expected to show some lag compared to other regions, as most of the countries in this region were contaminated later. Nonetheless, impacts may be more severe, as countries in this region are currently lacking in resources to test and contain the virus and health systems are not as robust as other countries’.
Business Segment Outlook
Media NetworksThe Media Networks segment drives its revenues from two main businesses: Cable Networks and Broadcasting. From FY17 to FY19, Disney registered a stable growth in both revenue streams, from USD 14.6 billion to USD 16.5 billion in Cable Networks and from USD 6.9 billion to USD 8.3 billion in Broadcasting. Naturally, the highest growth (an aggregate value of USD 2.9 billion) took place in FY19 with the acquisition of TFCF. The Cable Networks business’ growth has been converging towards industry values and we expect it to match them by FY22. As such, revenue growth for this business is expected to be of 1.5% YoY in FY20 and 1.6% YoY in FY21, stabilizing at a 1.7% CAGR from then on. Regarding the Broadcasting business’ revenues, we have concluded that its revenues have historically grown at about 45.0% of industry values. This is justified by Disney’s networks and channels being in a mature state. For this reason and based on an expected industry CAGR of 9.9% from FY20 to FY24, we expect revenues for the Broadcasting business to grow at an about 4.4% CAGR during this period.
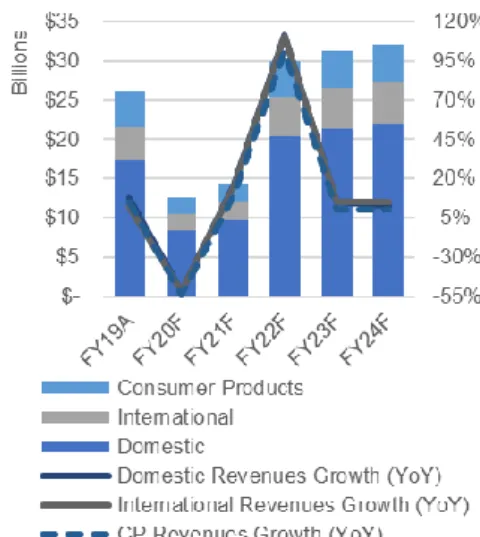
Parks, Experiences and Products
Disney’s PEP segment has historically been the main revenue source of the Company and we expect this to stay true towards FY24. Overall, the Firm will continue with significant investment in this segment, developing new attractions, hotels, and cruise ships. Domestically, we believe park attendance and hotel occupancy will stay near historical values with a slight decrease of 1.0% YoY from FY22 onwards due to lower economic growth and higher unemployment expectations. Simultaneously, we expect customer spending to keep increasing according to Disney’s assumed strategy of price climbing in this segment. We believe real domestic park spending will grow by 3.7% YoY
Figure 23 - Debt-to-GDP Ratio
Figure 24 - MN Revenues Breakdown
in FY20 and FY21, decelerating by 1.0% yearly from then on and that real hotel guest spending will increase by 2.7% YoY in FY20 and FY21, also decelerating by 1.0% yearly from FY22 to FY24. Internationally, we believe park attendance growth will follow historical patterns (excluding FY17, which was highly impacted by the opening of Shanghai Disneyland), with a steady YoY growth of 0.5%, while hotel and cruise occupancy are expected to follow historical values averaging 80.4%. Real spending at the international parks is expected to keep climbing by 3.0% YoY in FY20 but slowing down by 0.25pp yearly from FY21 onwards, due to Asia and Pacific unemployment outlooks. In the hotels and cruises, the same rationale is applied, which paired with inflation outlooks means that by FY22 real spending will start contracting. Revenue growth in the hotels and cruises will grow not only based on spending but also based on capacity, which domestically is expected to grow from 10.0 million in FY19 to 11.9 million available room nights in FY24 due to new hotel and cruise openings during this period. Consumer Product revenues are expected to show a modest growth at 0.4% CAGR for the forecasted period. The PEP segment will clearly be the most impacted by the COVID-19 pandemic and we estimate an average closed time of 5 months before reopening for the operations in this segment. Moreover, we expect these reopenings to occur at 25% of maximum capacity during FY20 and 50% during FY21 . Financially, this represents a negative impact of USD 9.9 billion, USD 2.4 billion, and USD 2.5 billion in FY20 and USD 9.7 billion, USD 2.3 billion, and USD 2.3 billion in the Domestic, International and Consumer Product revenue streams, respectively.
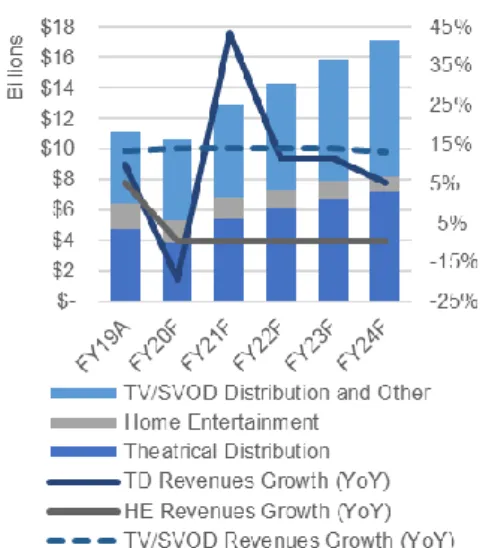
Studio Entertainment
The segment generates revenues from producing, acquiring, and distributing entertainment content. The physical home entertainment industry’s revenues are expected to decline at a 9.5% CAGR according to Statista. As such, we believe the Home Entertainment revenue stream to follow this pattern from FY20 to FY24. On the other hand, the TV/SVOD Distribution and Other revenue stream is expected to grow at a 14.0% CAGR from FY20 to FY23 slowing down to 13.0% YoY in FY24, in accordance with PwC’s Global Media and Entertainment Outlook for the Global OTT Video Industry Revenue and our own estimations. Finally, the Theatrical Distribution revenue stream is also expected to show significant growth, as Disney’s intellectual property and content development are best-in-class and a significant amount of Marvel, Star Wars, Pixar and Disney Live Animation feature films are scheduled for release in the coming years. This business line’s revenues are expected to take a hit of roughly USD 1.3 billion in FY20 due to the global pandemic, recovering afterwards with a 43.3% YoY growth in FY21 and two strong years of 11.5% YoY growth in FY22 and FY23 followed by a slower year of 5.5% YoY growth in FY24.
Direct-to-Consumer and International
As the Affiliate Fees revenue stream obtains its revenues from fees charged by Disney to traditional international TV channels for right of content usage, our expectation is that this business will be negatively affected by the growth of SVOD business models in the coming years. As such, we expect revenues to decrease at a –0.7% CAGR from FY20 to FY24, in accordance with PwC’s Global Media and Entertainment Outlook for the global Traditional TV segment. Historically, and excluding specific years with accounting specific impacts, Disney’s Advertising business’ revenues have shown correlation with the Global Advertising industry’s revenues growth. For this reason, we find a projected 1.7% CAGR for the industry to be a good proxy for this business from FY20 to FY24. The Subscription Fees and Other revenues are mainly driven by the Disney+, ESPN+ and Hulu services and we have a very positive outlook for them. These businesses’ revenues can be forecasted as a function of number of subscribers and ARPU. Disney’s three SVOD services are highly synergetic with the Company’s other segments and are relatively new, which drives higher growth expectations compared to the OTT Video industry expected CAGR of 14.0% globally and 10.3% in the US. In April 2020, six-month old Disney+ counted with 50 million subscribers, which we expect to grow to 60 million by year-end. For FY21 and FY22 we expect two years of above-market growth rates of 19.0% and 16.5% YoY, respectively and we expect a slowdown to 14.0% and 13.0% YoY during FY23 and FY24. Disney+ ARPU is expected to increase during the forecasted period due to launches in Europe and India, where promotional bundle pricing with Hulu will not be available, and to expected US inflation rate, which drives the standardized global pricing of the service. Regarding Hulu, we believe subscribers will grow at a 12.3% YoY rate due to synergies with Disney+ and this will increase to a 16.0% YoY rate from FY21 to FY23 as international launches ensue, before dropping to a 15.0% growth in FY24. ARPU’s are expected to increase according to inflation and according to changes in product subscription mix due to bundling with Disney+. Finally, ESPN+ is expected to grow from a more modest 5.3 million subscribers to 15.3 million in FY24 due to limited appeal outside the US with its ARPU keeping up with expected inflation as well.
Figure 26 - SE Revenues Breakdown
As a whole, the Subscription Fees and Other is expected to grow massively from about 34 million subscribers and USD 3.1 billion revenues in FY19 towards 179.9 million subscribers and USD 19.4 billion in FY24.
Valuation
For the company’s valuation, a primary absolute valuation method was elected, and a secondary absolute valuation method paired with a relative one was used to provide a robust assessment of the stock’s value.
The primary valuation method chosen was an Enterprise Discounted Cash Flow framework while the secondary methods employed were a Three-Stage Dividend Discount Model (using an H-Model for the second and third stages) and a sum of the parts approached paired with a Price/Sales multiple relative valuation for each business segment. We opted for the DCF method as our primary valuation tool opposed to the DDM as the DDM shows higher sensitivity to factors which are, in our opinion, substantially harder to precisely forecast. These factors are the long-term payout ratio and the duration of the transition period before a long-term maturity phase, represented by the second stage of the DDM.
Forecast Analysis
To be able to use the three valuation methods mentioned, it was necessary to forecast the Disney’s financial statements. Below, we detail the rationales behind the main drivers of profitability for the forecasted period.
Revenues
Our approach in revenue forecasting for the Company was focused on segment specific assumptions.
Firstly, we forecasted the Media Networks business using market specific prospects paired with our own assumptions.
Secondly, an estimation of the PEP segment followed. In this case we segmented the analysis operationally between Parks, Hotels and Cruises, and Consumer Products, and geographically between the Domestic and International. For the Parks, a combination of macroeconomic outlooks for the regions and knowledge about Disney’s strategy was used to estimate park attendance and per capita guest spending. For the hotels and cruises, the first step was to analyze the ongoing projects regarding new hotels and cruise ships, determining their impact on future capacity (represented by Available Room Nights). Afterwards, the same methodology used for Parks was used. For the Consumer Products business, a historically based driven approach was used. Finally, the impact of the COVID-19 pandemic was computed, assuming an average 5-months closure period in FY20 for these operations, as well as conservative reopenings at 25% maximum capacity during FY20 and 50% during FY21. These assumptions were made since we felt the Company’s estimation of 2-months closure expressed in the 2020 Q1 Earnings Webcast was too optimistic.
The Studio Entertainment revenues were also forecasted by business line. Firstly, the Theatrical Distribution business was estimated by carefully studying the segment’s franchises and release schedule and pairing that information with industry forecasts. A 3-month closure period in FY20 was also applied. The Home Entertainment and TV/SVOD Distribution revenues were computed by industry specific forecasts.
In the DTC&I segment, Affiliate Fees and Advertising revenues were forecasted based on market expectation for the future. The Subscription Fees and Other revenues, which are of major importance in our investment thesis, were forecasted using a bottom-up approach, computing the future subscriber basis and ARPU’s for Disney+, Hulu, and ESPN+, separately.
Cost of Goods & Services
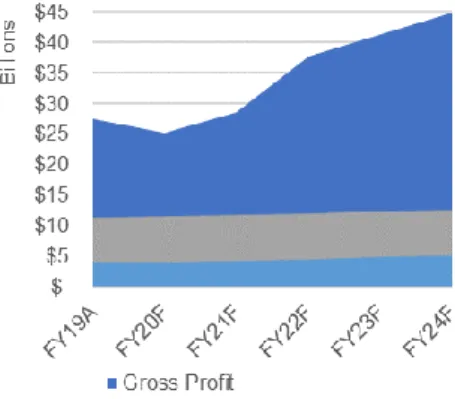
As Disney is an extremely mature company, its gross margin has been historically very stable. In FY19 it was highly impacted by the consolidation of TFCF and Hulu. We assumed COGS to revert to historical values by the end of the forecasted period.
Figure 28 - COGS and Gross Profit Margin
Operating Expenses
For the Selling, General and Administrative costs, historical growth values were considered, disregarding FY19 as it was heavily impacted by the consolidation of TCFC and Hulu. For FY20, these costs were inflated, as we expect higher marketing costs as Disney+ launches internationally.
Depreciation & Amortization
The Company uses straight-line depreciation. We computed an average estimated useful life of 20 years according to Disney’s Annual Report and assumed the respective rate of depreciation for the future. As for the Amortizations, historical rates were assumed, adjusting for TFCF and Hulu consolidation’s impact.
Enterprise Discounted Cash Flow
Using our primary valuation method, a target price of USD 144.11 was reached. This implies that DIS was undervalued on March 19, 2020 and represents an upside of 26.00%.
The calculations executed are detailed below.
Cost of Equity (re)
The cost of equity is a key part for computing the Weighted Average Cost of Capital, which is the discount rate used in this model. To calculate re, we followed the Capital
Asset Pricing Model:
𝑟𝑒= 𝑟𝑓+ 𝛽(𝑟𝑚+ 𝑟𝑓)
The CAPM expresses the relationship between the expected return of a security and its systematic risk. To compute this, one must identify the risk-free rate, the security’s volatility compared to its market (β), and the Market Risk Premium.
Risk-free Rate (rf)
As there is no real Risk-free Rate in the markets, we used the US Treasury’s bond yields as the closest proxy for this theoretical concept. To achieve a more precise valuation, we used the yields for each cash flow maturity.
Beta (β)
To compute β, we regressed the 5-year monthly returns of the S&P 500 index and DIS, obtaining the Raw Beta. Finally, to account for the tendency of market betas reverting to 1 employed the Blume Method to compute the Adjusted Beta:
𝛽𝑎𝑑𝑗=
2 3𝛽 +
1 3
Market Risk Premium
Market Risk Premium was obtained by NYU Professor Aswath Damodaran’s calculations, who obtained the 6.01% implied premium for the S&P 500 index on April 1st, 2020.
Cost of Debt (rd)
The Cost of Debt was initially computed according to the Credit Spread Method, leading to values between 1.37% and 1.92%. We found that this value was too low when compared to the latest corporate bond issuance by Disney, which delivered a 3.80%
FY20F FY21F FY22F FY23F FY24F Terminal
Risk-free rate (rf) 0.15% 0.17% 0.20% 0.29% 0.35% 0.70%
Raw Beta 1.04 1.04 1.04 1.04 1.04 1.04
Adjusted Beta 1.03 1.03 1.03 1.03 1.03 1.03
MRP - United States 6.01% 6.01% 6.01% 6.01% 6.01% 6.01%
Cost of Equity (re) 6.31% 6.33% 6.36% 6.45% 6.51% 6.86%
coupon and 3.83% YTM at issue date. For this reason, we computed rd by the Interest
Rate Method, dividing the Interest Expense in FY19 by the average Borrowings from FY18YE to FY19YE, arriving at more a coherent value of 3.67% and after-tax rd of 2.90%.
Weighted Average Cost of Capital (WACC)
To compute the model’s discount rate, we calculated Disney’s market value of Debt and Equity at FY19YE and applied our own assumptions of debt structure for the forecasted period.
Free Cash Flows to the Firm (FCFF)
To obtain the FCFF generated during the forecasted period the calculations below were used. The terminal FCFF was adjusted, normalizing earnings and the Change in Net Working Capital, to account for Disney’s strategy and its implications on these two factors.
Terminal Growth Rate (g)
Given Disney’s mature status and domestic presence, the perpetual growth rate chosen was the IMF’s long-term estimated growth of 1.62% for the US economy.
Valuation
All cash flows were discounted at the appropriate rates and period, according to the valuation date, arriving at Disney’s Enterprise Value. Finally, this was derived into Equity Value and ultimately into our Target Price, as shown below:
Cost of Capital FY20F FY21F FY22F FY23F FY24F Terminal
Risk-free rate (rf) 0.15% 0.17% 0.20% 0.29% 0.35% 0.70% Raw Beta 1.04 1.04 1.04 1.04 1.04 1.04 Adjusted Beta 1.03 1.03 1.03 1.03 1.03 1.03 MRP - United States 6.01% 6.01% 6.01% 6.01% 6.01% 6.01% Cost of Equity (re) 6.31% 6.33% 6.36% 6.45% 6.51% 6.86% Cost of Debt (rd) 3.67% 3.67% 3.67% 3.67% 3.67% 3.67%
Effective Tax Rate 21.00% 21.00% 21.00% 21.00% 21.00% 21.00%
After-tax rd 2.90% 2.90% 2.90% 2.90% 2.90% 2.90%
Market Debt to Capital 16.14% 15.82% 15.50% 15.18% 14.86% 14.54%
Market Equity to Capital 83.86% 84.18% 84.50% 84.82% 85.14% 85.46%
WACC 5.76% 5.79% 5.82% 5.91% 5.98% 6.29%
Two-Stage Enterprise DCF FY20F FY21F FY22F FY23F FY24F Terminal
+ EBIT x (1-t) 7,638 9,904 16,672 19,062 21,427 14,941
+ Non-cash Charges 4,169 4,425 4,665 4,911 5,163 5,163
- Change in NWC 383 501 308 100 112 281
- CAPEX 5,376 4,673 4,780 4,890 5,002 5,163
Dividend Discount Model
To support our conclusions, Disney’s stock was also valued using a Three-stage DDM. Firstly, we computed the expected dividends per share for the forecasted period, based on our analysis and assumptions. This corresponds to the first stage of our model and implied a short-term dividend growth (gs) of 12.17% from FY19 total dividend of USD
1.76.
Secondly, we structured our second and third stages into an H-Model, accounting for the gradual pace at which we believe Disney will achieve its terminal state. We assumed a second stage duration of 10 years, in accordance with our opinion on the Company’s transition period towards a new entertainment distribution paradigm. Long-term dividend growth rate (gL) was set at 4.50% based on Bradford Cornell’s paper Economic Growth
and Equity Investing. Moreover, we computed the sustainable gL considering the
relationship between Retention Rate and Long-term ROE to confirm that DIS can sustain our assumed gL.
Finally, all the stages discounted values were combined, resulting in the price target according to this method.
Second Stage Duration 10
Half-life of Transition Period (H) 5
Retention Rate 70.99%
Long-Term ROE 14.14%
Sustainable Growth Rate 10.04%
Long-Term Growth Rate (gL) 4.50%
Long-Term Cost of Equity (re) 6.86%
Short-Term Growth Rate (gS) 12.17%
Second and Third Stage Dividends @ FY24 188.84 PV Second and Third Stage Dividends 141.32
Second and Third Stages (H-Model)
PV First Stage Dividend 8.13
PV Second and Third Stage Dividends 141.32
Relative Valuation
To obtain yet another approach on Disney’s valuation, we used a relative valuation method. We had reservations on the usefulness and accuracy of such an approach for DIS, due to its unique business portfolio and due to the fact that a high amount of future earnings are based on a segment that is currently in its very early stages. Nonetheless, we tried to mitigate these factors by employing a sum of the parts approach to a P/S multiple valuation method, but still our reservations proved to be justified.
Firstly, we conducted a market research to determine comparable companies for each business segment. The choice of companies was based on factors such as market capitalization, business similarity and having a strong international presence.
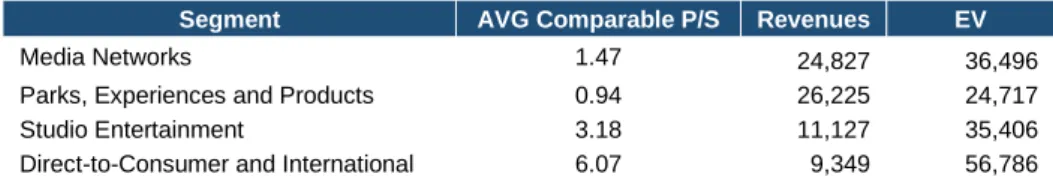
Secondly, a computation of each segments contribution to Equity Value based on comparable P/S ratios and Revenues was processed.
Segment AVG Comparable P/S Revenues EV
Media Networks 1.47 24,827 36,496
Parks, Experiences and Products 0.94 26,225 24,717
Studio Entertainment 3.18 11,127 35,406
Direct-to-Consumer and International 6.07 9,349 56,786
Finally, a sum of the parts approach was executed and the target price according to this method derived.
As mentioned previously, the fair price computed via this method differs significantly by the DCF and DDM prices, reflecting our opinion that it is not adequate for Disney. The high expected growth of the DTC&I segment (moving from 9.3 to 25.9 USD billion from FY19 to FY24) as well as its scale and very attractive brands justify it trading at well above comparable companies’ multiples.
Financial Analysis
To assess the Disney’s financial reality, we studied both historical and expected indicators related to profitability, efficiency, liquidity, and solvency.
Profitability
Overall, the Company has historically shown stable profitability figures, which translated into over 40 years of increasing regular dividend payments. Nonetheless, profitability has been impacted during FY18 and FY19, for two different motives. Historically, from FY15 to FY18, EBITDA margin has floated between 30.8% and 31.7% while FY19 showed an EBITDA margin of 27.4%. Looking at the bottom-line, Net Profit margin registered values between 16.0% and 16.9% from FY15 to FY17, spiked to 21.2% in FY18, and reverted to 15.9% in FY19. The reasoning for these inconsistencies in FY18 and FY19 is two-fold and specific to each year. Regarding FY18, Tax Expense was significantly positively impacted by President Trump passing the Tax Cuts and Job Act in November 2017. Naturally, while EBITDA margin remained stable, Net Profit margin increased by 4.9% compared to FY17, consequently impacting EPS which moved from USD 5.73 in FY17 to USD 8.40 in FY18. Since, the adaptation year to the Act was FY18, while tax rates decreased, FY19 reverted to near historical values of 15.9% Net Profit margin. This leads us to the reasoning behind FY19’s profitability not being higher than historical, accounting for tax cuts. In this year, Disney has acquired Twenty-First Century Fox, consolidating those operations and Hulu in the financial statements. As such, a decrease in profitability in this investment-heavy year ensued with two main focuses: significantly higher COGS, and loss of efficiency (which we detail in the Efficiency section). To easily illustrate this, we performed a DuPont Analysis, which resulted in ROE values of 19.6%, 19.5%, 25.8% and 15.1% in FY16, FY17, FY18 and FY19, respectively. In this analysis, we can see ROE clearly being impacted by profitability in FY18 and both profitability and efficiency in FY19. Looking forward, Disney is expected to keep increasing profitability up to FY24 (excluding FY20 and FY21, which will be impacted by COVID-19), showing Net Profit
Sum of the Parts Equity Value 153,405
Shares Outstanding (millions) 1,810
Price Target (USD) 84.75
Comparable Companies P/S
COMCAST CORP 1.61
CHARTER COMM INC 2.42
FOX CORP 1.37
VIACOMCBS INC 0.48
Segment Average 1.47
Media Networks
Comparable Companies P/S
SIX FLAGS ENTERTAINMENT 1.31
CEDAR FAIR LP 1.08
SEAWORLD ENTERTAINMENT 0.93
MARCUS CORPORATION 0.45
Segment Average 0.94
Parks Experiences and Products
Comparable Companies P/S COMCAST CORP 1.61 VIACOMCBS INC 0.48 SONY CORP 1.03 TENCENT M ENTERTAINMENT 11.28 VIVENDI 1.51 Segment Average 3.18 Studio Entertainment Comparable Companies P/S NETFLIX INC 9.25 TENCENT M ENTERTAINMENT 11.28 AMAZON.COM INC 4.10 SPOTIFY TECHNOLOGY SA 4.13 COMCAST CORP 1.61 Segment Average 6.07
Direct-to-Consumer and International
Figure 30 - MN Comparable Companies
Figure 31 - PEP Comparable Companies
Figure 32 - SE Comparable Companies
Figure 33 - DTC&I Comparable Companies
margins growing from 9.5% in FY20 to 19.3% in FY24 and EPS reaching USD 10.77 by the end of the forecasted period.
Efficiency
Disney’s efficiency ratios fall in line with our Porter’s 5 Forces section, namely in the parts regarding supplier and buyer power. In terms of suppliers, Accounts Payable Days values between 100 and 111 days from FY15 to FY18 and reaching 154 with TFCF’s acquisition illustrate the significant negotiating power of the Company, averaging payment periods of over a quarter. Looking at the Company’s clients, a decrease in Inventory Days from 20.22 to 14.32 during the FY15 to FY19 period illustrates Disney’s proposition of value strength for its customers, although this has been slightly offset by an average of 57 Accounts Receivable days between FY15 and FY18 jumping to 81 in FY19, due to the acquisition of TFCF. Ultimately these factors derived into an operating cycle (or cash conversion cycle) which showed increasingly negative values from -24 to -59 days from FY15 to FY19, clearly highly impacted by the long payment periods mentioned above. Going forwards, we expect efficiency to remain high, albeit normalizing in terms of Accounts Payable Days as FCFC’s payables become more in line with Disney’s strategy.
Liquidity
Analyzing liquidity, one can quickly understand that it has been decreasing up to FY19. This is shown by Current Ratio values dropping from a healthy 1.03 in FY15 to sub 1.0 values from FY17 to FY19. Using a more conservative approach, Quick Ratio also suffered, decreasing from 0.81 in FY16 to 0.65 in FY17 and from 0.75 in FY18 to 0.67 in FY19. This liquidity issue, although real, is expected and in line with Disney’s strategy, has it raised capital over the last few years in order to finance heavy investment across the businesses, with special focus on the DTC&I segment, new cruise ships and the recent TFCF acquisition. Going forward, liquidity is expected to improve, as these investments start delivering returns.
Solvency
On pair with liquidity, solvency has naturally been impacted by the recent heavy investing strategy of the Company. Nonetheless, Disney has maintained a relatively stable capital structure, with Debt-to-Equity values hovering from 0.40 to 0.56 from FY16 to FY19, naturally increasing in high investment years such as FY17 and FY19. In the future, we expect capital structure to remain stable and take on D/E values of about 0.45, in line with Disney’s industry. Nonetheless, one can clearly see the impact of the above mentioned investments looking at the Interest Coverage Ratio, which has gone from 49.90 in FY15 to 9.51 in FY19, showing impact from both increased debt but also from reduced margins mentioned in the profitability section.
Investment Risks
Disney is subject to different risks, which are decomposed below and evaluated according to the probability that they materialize and, if they do, their impact.
Market Risk – Interest Rate Risk (MR1)
Exposure to adverse interest rate and yield curve movements may negatively impact Disney’s financial statements, affecting the Company’s borrowings as well as all interest rate derivative contracts.
Market Risk – Foreign Exchange Risk (MR2)
Global presence implies that currency exchange rate fluctuations may significantly impact the Firm’s financial statements, affecting assets such as account receivables and liabilities such as account payables.
Market Risk – Equity Value Risk (MR3)
Investments in equity related financial instruments mean that Disney is exposed to the impact of their value fluctuations in the markets, which can directly impact the Company’s financial statements.
Figure 35 - Operating Cycle
Figure 36 - Liquidity Ratios
Market Risk – Commodity Price Risk (MR4)
As the Company deals in merchandise, commodity price fluctuations may impact the cost of goods sold in this business, leading to lower margins and/or increased price points.
Operational Risk – Misalignment with Consumers (OR1)
As Disney businesses are in entertainment and consumer products, there is a substantially dependence on consumer tastes and preferences. Moreover, substantial investments are made before knowing if the products will earn consumer acceptance and revenues driven from parks, advertising and other business lines are strongly dependent on this acceptance.
Operational Risk – Intellectual Property Rights (OR2)
The unauthorized use of Disney’s intellectual property may decrease revenues or increase the costs of protecting their rights in that property. Moreover, if the right to use contents acquired by third parties is successfully challenged, increased costs might ensue or the opportunity to generate revenues from those rights may be lost.
Operational Risk – Tail Risks (OR3)
As a significant part of the Company’s revenues come from the PEP segment, there is a real risk that low-likelihood and high-impact risks may severely affect Disney. These risks may relate to political turmoil, war, closed borders or even situations such as the COVID-19 pandemic.
Operational Risk – Reputational Risk (OR4)
Global recognition of the Company’s brands is a critical part of Disney’s success. Significant negative publicity or claims may impact revenue generation, business opportunities and overall profitability, even if such claims are untrue.
Regulatory and Legal Risk – Taxation (RR1)
The Company’s international presence exposes it to the risk of adverse changes in tax law in the countries where it operates, impacting profitability.
Regulatory and Legal Risk – Regulations (RR2)
Exposure to domestic and overseas law implies the need to comply with a series of regulations which can be altered in adverse ways to the Company. These regulations oversee topics such as TV and radio, privacy and data protection, environmental protection, and trade. Changes in them can impact profitability or even the ability to offer products.
Valuation Risk Analysis
As our primary valuation model is based on several assumptions and forecasted metrics, we conducted several analyses to test the impact of these variables and their changes in our valuation.
Monte Carlo Simulation
To assess the impact of stressing several of our model’s inputs in our price target, a Monte Carlo Simulation was performed. In this simulation, 100,000 trials were conducted, testing different combinations of the chosen variables and the resulting prices returned by the model as well as its sensitivity to the variables. The stressed inputs are detailed below.
Variable Assumption Std. Deviation
Terminal Growth Rate (g) 1.62% 0.16%
Market Risk Premium - US 6.01% 0.60%
Raw Beta 1.04 0.10
Terminal Risk-free Rate 0.70% 0.47%
H ig h OR3 M e d iu m OR1 OR4 RR2 RR1 MR1 Low MR2 MR4 MR3 OR2
Low Medium High
Im
p
a
ct
Probability
Figure 38 - Disney's Risk Matrix
Figure 39 - Maximum Daily VaR Breakdown