Faculty of Engineering of University of Porto
Integrated Master in Bioengineering
Branch – Biological Engineering
Analysis of the organic acids and
exopolysaccharides produced by the lactic acid
microflora present in kefir and their potential
applications
Dissertation for Master Thesis
Ana Catarina Marcelino Pinto de Meireles
Supervisors: Doctor Margarida Bastos
Doctor Isabel Afonso
Success is not final, failure is not fatal: it is the courage to continue that counts.
Acknowledgements
First of all, I would like to thank Doctor Isabel Afonso, for all the support, guidance, and availability always given. For always answering my calls, and try to find a way with me, when everything was going wrong.
I also would like to acknowledge Doctor Margarida Bastos for her wise counsel and availability.
I couldn’t forget to express my gratitude towards Professor Luís Melo for being one of the Professors who have chosen me for being a Bioengineering student when I transferred from Chemical Engineering; and for being one of the Professors that made me choose this branch.
I have to thank Professor Manuel Simões for always offering me help, and being always available.
My thanks also go to the researchers in Lab E007, especially to Madalena, Anabela, Renato, Luciana and Ana.
I have to express my gratitude towards Carla Ferreira, for her patience and help always given. Without you I couldn’t have done it.
Another person who always has listened to me and helped me when I need it, without me asking, was Dina Martins. Thank you!
To my “helpers” in the Lab, Paula and Sílvia I have no words to express my thankfulness. Along these years you were there for me, anytime, every day.
I would like to thank the Escola Superior Agrária – Instituto Politécnico de Viana do Castelo for letting me use the HPLC, particularly Eng. Virgílio Peixoto for his technical support,
I would like to thank my Bioengineering and “lunch” friends, Carol, Inês, Catarina, Diogo, Soraia and Carolina, for the funny moments and for always making me laugh.
I couldn’t forget Ana Luísa for always being there for me, listen and given me her opinion and help; and Francisco for making me laugh and always offering me help. You two brightened my days.
I would also like to thank Rita Fulgêncio for her friendship and help towards our shared BB-12.
Finally I am grateful to my family, specially my parents, sister and André, for being there for me unconditionally.
My special gratitude is to my mother who always tried to understand my theme and tried to help me.
Abstract
The present work comprised the evaluation of the potential production of added-value metabolites, such as organic acids and exopolysaccharides, by several microorganisms normally present in kefir. The promising application of the metabolites as food additives was also analysed.
To accomplish the aims of this work, multiple microorganisms combinations (lactic acid bacteria, yeasts and Bifidobacterium) were studied; and the analysis of organic acids and EPS production, was performed by HPLC and colorimetric methods.
Relatively to the organic acids, the higher concentration was obtained for succinic acid (5.39x10⁻¹ g/L) for C. krusei after 6.5 hours of experiment. For possible applications, this production has to be optimized.
The identification of the monosaccharides that constitute the exopolysaccharide produced was not possible. However the reducing sugars present in the samples were quantified and the highest concentration value was obtained for L. lactis subsp. lactis (47.66 g/L, after 30 hours of growth). This microorganism also showed properties for hydrolysing the exopolysaccharides and consuming the hydrolysates.
The yeasts inhibit the microorganisms from producing the exopolysaccharides and
B. animalis subsp. lactis was not able to produce exopolysaccharides.
The bifidogenic effect of B. animalis subsp. lactis was evident by the exopolysaccharide hydrolysis and consume of the resulting sugars. The prebiotic effect of the exopolysaccharides was also proved by the increased growth of B. animalis subsp. lactis for higher exopolysaccharides concentrations.
The metabolites produced could have several applications and they are of great interest to research and food industry. In one hand, they can be applied as additives in the preservation and stabilization of food products; and in the other hand they could have the potential to originate functional food.
Resumo
O presente trabalho consistiu na avaliação do potencial de produção de metabolitos de valor acrescentado, como os ácidos orgânicos e os exopolissacarídeos, através de diversos microrganismos normalmente presentes no kefir. A aplicação promissora destes metabolitos como aditivos alimentares também foi analisada.
Para alcançar os objetivos do trabalho, foram estudadas múltiplas combinações de microrganismos (bactérias do ácido láctico, leveduras e Bifidobacterium); a análise da produção de ácidos orgânicos e de exopolissacarídeos foi realizada através de HPLC e métodos colorimétricos.
Relativamente aos ácidos orgânicos, a concentração mais elevada foi atribuída ao ácido succínico (5,39x10⁻¹ g/L) para a levedura C. krusei após 6,5 horas de experiência. Para possíveis aplicações, esta produção teria de ser otimizada.
A identificação dos monossacarídeos que constituem o exopolissacarídeo produzido, não foi possível. Contudo, os açúcares redutores presentes nas amostras foram quantificados e o valor de concentração mais elevado foi obtido para L. lactis subsp. lactis (47,66 g/L, após 30 horas de crescimento). Este microrganismo demonstrou também propriedades de hidrólise para com o exopolissacarídeo e o posterior consumo dos hidrolisados.
As leveduras inibiram os microrganismos de produzirem os exopolissacarídeos e o B. animalis subsp. lactis não foi capaz de produzir exopolissacarídeos.
O efeito bifidogénico do B. animalis subsp. lactis foi evidente pela hidrólise do exopolissacarídeo e o consumo dos açúcares resultantes. O efeito prebiótico do exopolissacarídeo foi também demonstrado, uma vez que concentrações mais elevadas deste polissacarídeo, promoveram o crescimento do B. animalis subsp. lactis.
Os metabolitos produzidos podem ter diversas aplicações e possuem um grande interesse para a investigação e para a indústria alimentar. Por um lado, podem ser aplicados como aditivos na conservação e estabilização de produtos alimentares; por outro lado, podem possuir o potencial para originar alimentos funcionais.
Palavras-chave: ácidos orgânicos, exopolissacarídeos, leveduras, bactérias, prebiótico, probiótico.
I
List of Contents
1. Introduction ... 1
1.1. Thesis Presentation and Objectives ... 1
1.2. Thesis Organization ... 2 2. Theoretical Fundamentals ... 3 2.1. Kefir ... 3 2.1.1. Production ... 4 2.1.2. Microorganisms’ Diversity ... 5 2.1.3. Health Interest ... 6
2.2. Metabolic Products with Industrial Applications ... 7
2.2.1. Organic Acids ... 7
2.2.2. Exopolysaccharides ... 11
3. Materials and Methods ... 15
3.1. Microorganisms ... 15
3.2. Organic Acids ... 18
3.2.1. Extraction ... 19
3.2.2. Identification and Quantification by HPLC-UV/Vis ... 19
3.3. Exopolysaccharides ... 21
3.3.1. Extraction ... 22
3.3.2. Hydrolysis ... 23
3.3.3. Identification and Quantification by HPLC-RI ... 24
3.3.4. Quantification by DNS Method ... 25
3.3.5. Quantification by Dubois Method ... 25
3.4. Bifidogenic Effect ... 26
3.4.1. Quantification by DNS Method ... 26
4. Results and Discussion ... 27
II
4.2. Exopolysaccharides ... 38
4.2.1. Extraction ... 38
4.2.2. Identification and Quantification by HPLC-RI ... 40
4.2.3. Quantification by DNS Method ... 43
4.2.4. Quantification by Dubois Method ... 44
4.3. Bifidogenic Effect ... 48
5. Concluding Remarks and Future Outlook ... 51
5.1. Conclusions ... 51
5.2. Future Outlook ... 52
References ... 54 Annexes ... A1 A.1. Culture Media Composition ... A1 A.2. Calibration Curves ... A3 A.2.1. Organic Acids Calibration Curves for HPLC-UV/VIS ... A3 A.2.2. Carbohydrates Calibration Curves for HPLC-RI ... A7 A.2.3. Glucose Calibration Curve for DNS Method ... A9 A.2.4. Glucose Calibration Curve for Dubois Method ... A9 A.3. Additional Material and Methods ... A10 A.4. Chromatograms ... A11 A.4.1. Organic Acids Standards ... A11 A.4.2. Carbohydrates Standards ... A11 A.4.3. Organic Acids Samples ... A12 A.4.4. Carbohydrates Samples ... A17 A.5. Student’s t - test ... A18
III
List of Figures
In the Main Text:
Figure 2.1 – Kefir grains (each square is equal to 1 cm). ... 3 Figure 2.2 – Optical microscope photographs of a kefir grain (1000x with immersion lens). A – Evidence of the presence of Gram-positive and Gram-negative bacilli; B – Evidence of the presence of yeasts and bacilli. ... 5 Figure 2.3 – Krebs cycle (adapted from Madigan et al., 2009). ... 8 Figure 2.4 – Schematic representation of heterolactic fermentation (A) (adapted from MetaCyc, 2007a) and homolactic fermentation (B) (adapted from MetaCyc, 2007b)... 9 Figure 2.5 – Mixed acid fermentation (adapted from MetaCyc, 2010). ... 10 Figure 2.6 – Chemical structure of succinic, acetic, citric, pyruvic, lactic and propionic acid. ... 10 Figure 2.7 – Schematic representation of the EPS production (adapted from Welman and Maddox, 2003). ... 12 Figure 2.8 – Kefiran structure (adapted from Micheli et al., 1999). ... 14 Figure 3.1 – Tests performed with skim milk. ... 19 Figure 3.2 – Schematic representation of the column cleaning process. The mobile phase (0.4% H3PO4) is represented in green and the methanol is represented in orange. ... 20 Figure 3.3 – Process of extraction. A – After heating; B – First step of centrifugation after heating; C – Precipitation with ethanol; D – Pellet after second centrifugation; E – Ressuspending the pellet in distilled water... 23 Figure 4.1 – Pyruvic acid production along growth time, for all the combination of strains. A – Isolated bacteria (L. lactis subsp. lactis, L. delbrueckii subsp. bulgaricus and L. kefir); B – Mixed bacteria (L. lactis subsp. lactis + L. delbrueckii subsp.
bulgaricus, L. delbrueckii subsp. bulgaricus + L. kefir and L. kefir + L. lactis subsp. lactis); C – Isolated bacteria mixed with yeasts (L. lactis subsp. lactis + yeasts, L. delbrueckii subsp. bulgaricus + yeasts, L. kefir + yeasts); D – All the bacteria mixed
IV
(L. lactis subsp. lactis + L. delbrueckii subsp. bulgaricus + L. kefir) and all the bacteria mixed with yeasts (L. lactis subsp. lactis + L. delbrueckii subsp. bulgaricus + L. kefir +
C. krusei + C. famata); E – isolated yeasts and mixed yeasts (C. krusei, C. famata and C. krusei + C. famata). ... 29
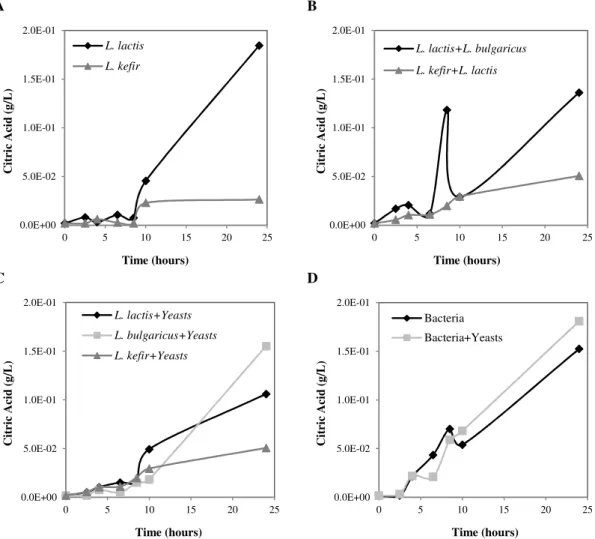
Figure 4.2 – Citric acid production along growth time. A – Isolated bacteria (L. lactis subsp. lactis and L. kefir); B – Mixed bacteria (L. lactis subsp. lactis + L. delbrueckii subsp. bulgaricus and L. kefir + L. lactis subsp. lactis); C – Isolated bacteria mixed with yeasts (L. lactis subsp. lactis + yeasts, L. delbrueckii subsp. bulgaricus + yeasts, L. kefir + yeasts); D – All the bacteria mixed (L. lactis subsp. lactis + L. delbrueckii subsp.
bulgaricus + L. kefir) and all the bacteria mixed with yeasts (L. lactis subsp. lactis + L. delbrueckii subsp. bulgaricus + L. kefir + C. krusei + C. famata). ... 30
Figure 4.3 – Lactic acid production along the growth time, for C. krusei and C. krusei +
C. famata. ... 31
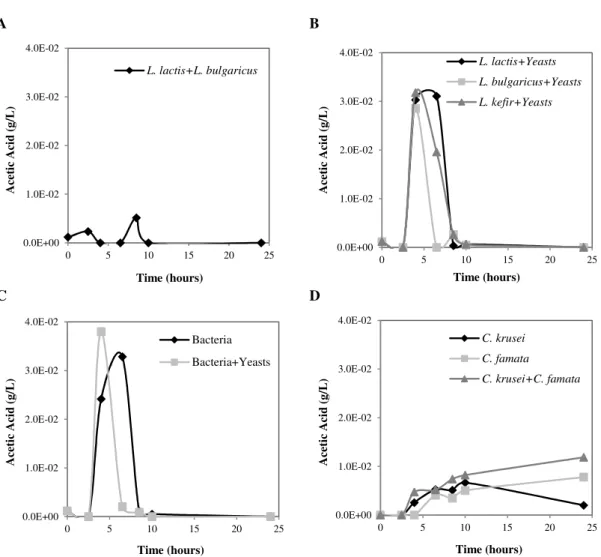
Figure 4.4 – Acetic acid production along growth time. A – Mixed bacteria (L. lactis subsp. lactis + L. delbrueckii subsp. bulgaricus); B – Isolated bacteria mixed with yeasts (L. lactis subsp. lactis + yeasts, L. delbrueckii subsp. bulgaricus + yeasts, L. kefir + yeasts); C – All the bacteria mixed (L. lactis subsp. lactis + L. delbrueckii subsp.
bulgaricus + L. kefir) and all the bacteria mixed with yeasts (L. lactis subsp. lactis + L. delbrueckii subsp. bulgaricus + L. kefir + C. krusei + C. famata); D – isolated yeasts
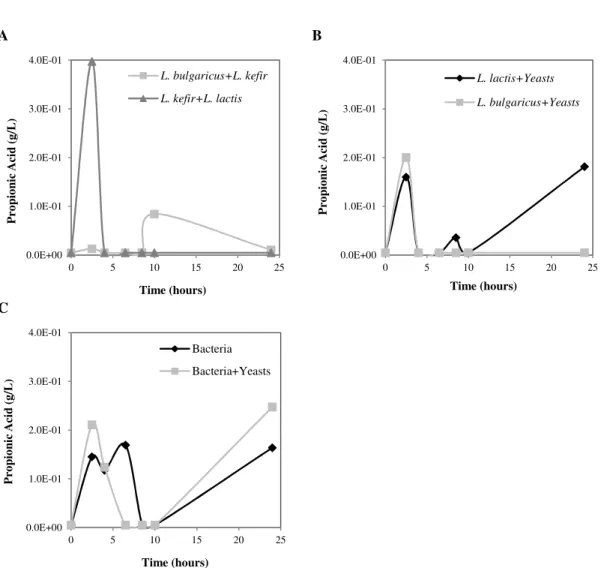
and mixed yeasts (C. krusei, C. famata and C. krusei + C. famata). ... 33 Figure 4.5 – Propionic acid production along the growth time. A – Mixed bacteria (L.
delbrueckii subsp. bulgaricus + L. kefir and L. kefir + L. lactis subsp. lactis); B –
Isolated bacteria mixed with yeasts (L. lactis subsp. lactis + yeasts and L. delbrueckii subsp. bulgaricus + yeasts); C – All the bacteria mixed (L. lactis subsp. lactis +
L. delbrueckii subsp. bulgaricus + L. kefir) and all the bacteria mixed with yeasts (L. lactis subsp. lactis + L. delbrueckii subsp. bulgaricus + L. kefir + C. krusei + C. famata). ... 35
Figure 4.6 – Succinic acid production along the growth time, for the yeasts isolated and mixed. ... 36 Figure 4.7 – First step of centrifugation after heating. A – In the absence of EPS. B – In the presence of EPS. ... 38 Figure 4.8 – Last step of centrifugation after precipitation with ethanol. A – In the absence of EPS. B – In the presence of EPS. ... 39
V
Figure 4.9 – Chromatograms obtained for the growth with all the bacteria after 48 hours of study. A - Hydrolysis with H2SO4 2 M at 150 °C for 30 min. B - Hydrolysis with concentrated H2SO4 at room temperature. ... 42 Figure 4.10 – Superposition of the chromatograms obtained for some samples and a chromatogram for a standard. ... 42 Figure 4.11 – DNS method performed. A – Blank prepared like the sample (water and H2SO4). B – Sample. C – Blank with only distilled water. ... 43 Figure 4.12 – Glucose’s concentration along the study, to the strains that exhibit production of EPS. A – Isolated bacteria (L. lactis subsp. lactis, L. delbrueckii subsp.
bulgaricus and L. kefir); B – Mixed bacteria (L. lactis subsp. lactis + L. delbrueckii
subsp. bulgaricus, L. delbrueckii subsp. bulgaricus + L. kefir and L. kefir + L. lactis subsp. lactis); C – Isolated bacteria mixed with yeasts (L. lactis subsp. lactis + yeasts, L.
delbrueckii subsp. bulgaricus + yeasts, L. kefir + yeasts); D – All the bacteria mixed (L. lactis subsp. lactis + L. delbrueckii subsp. bulgaricus + L. kefir) and all the bacteria
mixed with yeasts (L. lactis subsp. lactis + L. delbrueckii subsp. bulgaricus + L. kefir +
C. krusei + C. famata). ... 46
Figure 4.13 – Glucose concentration along the study, to B. animalis subsp. lactis (A) and E. coli (B) to the three different concentrations of EPS. The orange lines mark the value obtained for the solution of AMRS in the initial of the study (time zero). C1 - half of the sugars concentration present in the original MRS; C2 – the same concentration of sugars present in the original MRS; C3 – 10 times higher than C1. ... 48 Figure 4.14 – OD observed for B. animalis subsp. lactis (A) and E. coli (B) to the three different concentrations of EPS. C1 - half of the sugars concentration present in the original MRS; C2 – the same concentration of sugars present in the original MRS; C3 – 10 times higher than C1. ... 49
In Annex:
Figure A.1 – Calibration curve for pyruvic acid. ... A3 Figure A.2 – Calibration curve for citric acid. ... A4 Figure A.3 – Calibration curve for lactic acid. ... A4 Figure A.4 – Calibration curve for acetic acid. ... A5 Figure A.5 – Calibration curve for propionic acid. ... A5 Figure A.6 – Calibration curve for succinic acid smaller concentrations. ... A6
VI
Figure A.7 – Calibration curve for succinic acid higher concentrations. ... A6 Figure A.8 – Calibration curve for lactose. ... A7 Figure A.9 – Calibration curve for glucose. ... A7 Figure A.10 – Calibration curve for galactose. ... A8 Figure A.11 – Calibration curve for rhamnose. ... A8 Figure A.12 – Calibration curve for glucose. ... A9 Figure A.13 – Calibration curve for glucose. ... A9 Figure A.14 – Chromatogram obtained for all the organic acids standards. ... A11 Figure A.15 – Chromatogram obtained for the carbohydrates standards. ... A11 Figure A.16 – Chromatogram obtained for L. delbrueckii subsp. bulgaricus, for the organic acids. ... A12 Figure A.17 – Chromatogram obtained for L. lactis subsp. lactis, for the organic acids. ... A12 Figure A.18 – Chromatogram obtained for L. kefir, for the organic acids. ... A13 Figure A.19 – Chromatogram obtained for L. delbrueckii subsp. bulgaricus + L. kefir, for the organic acids. ... A13 Figure A.20 – Chromatogram obtained for L. kefir + L. lactis subsp. lactis, for the organic acids. ... A13 Figure A.21 – Chromatogram obtained for L. lactis subsp. lactis +L. delbrueckii subsp.
bulgaricus, for the organic acids. ... A14
Figure A.22 – Chromatogram obtained for L. delbrueckii subsp. bulgaricus + yeasts, for the organic acids. ... A14 Figure A.23 – Chromatogram obtained for L. kefir + yeasts, for the organic acids. .... A14 Figure A.24 – Chromatogram obtained for L. lactis subsp. lactis + yeasts, for the organic acids. ... A15 Figure A.25 – Chromatogram obtained for all the bacteria, for the organic acids. ... A15 Figure A.26 – Chromatogram obtained for all the bacteria + yeasts, for the organic acids. ... A15 Figure A.27 – Chromatogram obtained for C. krusei, for the organic acids. ... A16 Figure A.28 – Chromatogram obtained for C. famata, for the organic acids. ... A16 Figure A.29 – Chromatogram obtained for C. krusei + C. famata, for the organic acids. ... A16 Figure A.30 – Chromatogram obtained for the time zero, for the carbohydrates. ... A17
VII
List of Tables
In the Main Text:
Table 3.1 – Microorganisms applied in the study, their characterisation, origins and cultivations conditions ... 16 Table 3.2 – List of the different combinations applied in the study for organic acids production ... 18 Table 3.3 – List of the different combinations applied in the study of EPS production 22 Table 3.4 – Conditions tested for the sulphuric acid hydrolysis ... 23 Table 4.1 – Retention times for the organic acids standards ... 27 Table 4.2 – Observed results after the process of extraction (nd – EPS not detected; d – EPS detected) ... 39 Table 4.3 – Retention times for the sugars standards ... 40
VIII
List of Abbreviations
AAB Acetic Acid Bacteria
Abs Absorbance
AMRS Altered Man, Rogosa and Sharpe
CBA Corynebacterium Agar
CoA Coenzyme A
DNS 3,5-Dinitrosalicylic acid
EPS Exopolysaccharides
FDA Food and Drug Administration FOS Fructo-oligosaccharide
GOS Galacto-oligosaccharide GRAS Generally Recognized As Safe
HPLC High Performance Liquid Chromatography LAB Lactic Acid Bacteria
MRS Man, Rogosa and Sharpe
OD Optic Density
PCA Plate Count Agar
RI Refractive Index
RP Reversed phase
TDP Thymidine diphosphate
IX
UV Ultraviolet
Vis Visible
1
1. Introduction
1.1. Thesis Presentation and Objectives
The current microbial biotechnology encompasses the use of microorganisms for the production and development of products that consumers want and need. Microorganisms have an important role in the generation of a wide variety of products, and therefore have an extensive range of applications in many areas, specially the pharmaceutical, environmental and food industries.
Modern consumers are becoming increasingly aware of the importance of healthy, natural and nutritional food. This demand leads to the importance of isolate, purify and characterise microorganisms that may be useful in the referred areas (Laws and Marshall, 2001).
Based on these concepts, it is an objective to produce food with high nutritional value and that may have health properties that increase the commercial and nutritional value of products. These products can be defined as functional food which are consumed in the regular diet, have beneficial effects and reduce the risk of disease; or as probiotics, which are microorganisms that confer a beneficial effect to the host, when ingested in adequate quantities (Farnworth, 2005).
An example of this type of food is kefir, which in addition of having the properties mentioned above has a composition that makes it interesting in the biotechnology point of view. The complex set of microorganisms which coexist in symbiosis is capable of producing metabolites of high interest (Farnworth, 2005; Irigoyen et al., 2005).
These metabolites can be thickening and stabilizers agents, such as polysaccharides (Badel et al., 2011), or preservatives such as organic acids. Since they are produced by natural means, they become favourites in the area, being possible food additives (Welman and Maddox, 2003; Theron and Lues, 2011).
2
These thickening agents, such as polysaccharides, have a low fat and sugar contents and are associated with health improvements, properties that consumers prefer and look for (Welman and Maddox, 2003). The organic acids are antimicrobial agents, applied mainly in the beverage industry. The consumers will prefer this preservatives, if their origin is natural and not synthetic (Theron and Lues, 2011).
Some of the carbohydrates that are produced by specific strains of microorganisms can promote the growth of Bifidobacterium species, which are known for their probiotic effects, beneficial for the human health (Hattner, 2009; Neri et al., 2009).
Consequently, the main objectives for this thesis were to extract the organic acids and exopolysaccharides (EPS) produced by the strains (isolated and mixed in different combinations); to analyse their production, in terms of concentration and composition. These goals were attempted by different extraction techniques, by HPLC (High Performance Liquid Chromatography) analysis and by colorimetric methods.
The possible bifidogenic effect over the EPS extracted was also studied, by the verification of the EPS hydrolysis, by Bifidobacterium animalis subsp. lactis.
1.2. Thesis Organization
In Chapter 1 the thesis theme and the main objectives of the work are outlined. The Chapter 2 is a review in kefir production, microorganisms’ diversity in this fermented milk, the health interest behind this product and the importance of the metabolites produced by the microorganisms enclosed in kefir. It also focuses on the possible and potential applications that these products of metabolism could have in several areas: food and health domains. The investigation in probiotics and prebiotics is also addressed in this chapter.
Chapter 3 contains the methodology used to accomplish the objectives of the work, in terms of organic acids extraction and quantification, as for EPS extraction, hydrolysis and quantification and for the study of the bifidogenic effect of the EPS produced.
In Chapter 4 are presented all the results and their discussion.
3
2. Theoretical Fundamentals
2.1. Kefir
Kefir is a fermented milk beverage originated from Eastern Europe, obtained by lactic and alcoholic fermentation (Assadi et al., 2000; Yaman et al., 2006). The production is carried out from kefir grains, which can be preserved at low temperatures or freeze-dried (Witthuhn et al., 2005a).
This drink differs from other milk products since it results from the interaction of different organisms (Garrote et al., 1997). Although it shares certain organoleptic properties with yogurt, there are some significant differences. Kefir is not as creamy as yogurt, it is effervescent, due to the carbon dioxide content, and is slightly alcoholic (Latorre-García et al., 2007; Farnworth and Mainville, 2008).
It has a pH between 4 and 4.5, which is lower than milk (pH 6) and varies in fat content, in accordance to the milk used as raw material. The grains used to prepare this drink look like small cauliflowers as it can be seen in Figure 2.1 (Irigoyen et al., 2005).
Figure 2.1 – Kefir grains (each square is equal to 1 cm).
4
The grains have a diameter varying from 5 to 45 mm. This variation is considerable due to the growing process and the complex structure of the grains. Smaller grains are formed around the original grain, until it reaches a breaking point where the grains detach, due to the fact that the original grain cannot sustain the weight, forming multiple grains (Güzel-Seydim et al., 2000). They are gelatinous, their colour can be white or yellowish and their shape is irregular (Garrote et al., 2001; Miguel et
al., 2010).
The grains composition depends on their origin, but they are mainly composed by water (≈ 90%), proteins (≈ 3%), lipids (≈ 0.3%), carbohydrates (≈ 6%) and ashes (≈ 0.7%) (Garrote et al., 1997; Garrote et al., 2001). The microflora is entrapped in the proteins and polysaccharides matrix that constitute the grains (Garrote et al., 1997).
2.1.1. Production
Kefir production and commercialisation are more common in Central and East Europe, being quite new in North America. In Russia this product is considered an essential food alongside with bread, milk, sugar and salt. Some countries, like Germany, France and Norway already have regulation related to kefir production and composition (Farnworth and Mainville, 2008; Cogulu et al., 2010).
The traditional production consists in the simple addition of the grains to the milk for an incubation time of 24 hours. At the end of this period, the grains are separated from the milk by filtration processes and the final product is conserved at 4 °C. The same process can be repeated several times, with the same grains (Lopitz-Otsoa et al., 2006). The optimal temperature to produce kefir is 20 - 30 °C and it can be produced with any type of milk (buffalo, cow, goat) (Irigoyen et al., 2005; Siritat and Jelena, 2010). This process is not aseptic (Marshall et al., 1984; Irigoyen et al., 2005).
At an industrial level, the production is not with the grains, but with the strains typically present in kefir. Firstly, the milk is homogenised and undergoes a heat treatment at high temperatures (e.g. pasteurization). Afterwards the product is cooled down until it reaches 20 °C and at this point the inoculation with specific strains is done. The incubation time is the same as for the traditional process, as well as the conservation conditions (Assadi et al., 2000; Otles and Cagindi, 2003).
5
2.1.2. Microorganisms’ Diversity
The microbial population present in the grains coexists in symbiosis (Goršek and Tramšek, 2008; Balabanova and Panayotov, 2011) and is mostly constitute by lactic acid bacteria (LAB), acetic acid bacteria (AAB), yeasts, and it can also contain mycelial fungi. The grains have certain specific microbial species that are always present, but there may be present other species, depending on the origin of the grains (Marshall et
al., 1984; Witthuhn et al., 2005b). In Figure 2.2, the coexistence of different
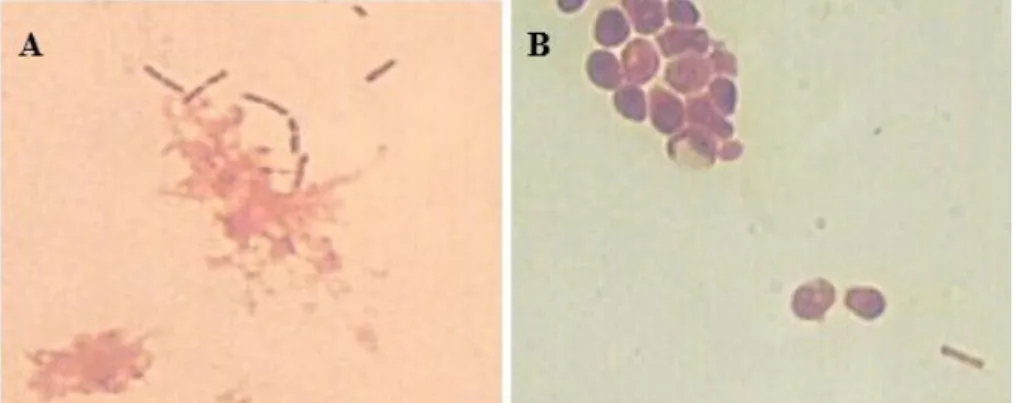
microorganisms in a kefir grain can be observed.
Figure 2.2 – Optical microscope photographs of a kefir grain (1000x with immersion lens). A – Evidence of the presence of Gram-positive and Gram-negative bacilli; B – Evidence of the presence of yeasts and bacilli.
Some referred LAB are Lactobacillus acidophilus, Lactobacillus brevis,
Lactobacillus casei, Lactobacillus fermentum, Lactobacillus helveticus, Lactobacillus
kefir, Lactobacillus parakefiri, Lactococcus lactis, Leuconostoc mesenteroides
(Witthuhn et al., 2005b) and Lactobacillus delbrueckii subsp. bulgaricus (Simova et al., 2002).
The LAB are Generally Recognized As Safe (GRAS) and had been known for their EPS production (Duboc and Mollet, 2001; Welman and Maddox, 2003) and complex carbohydrates utilization for their own growth (Gobbetti, 1998). Due to their GRAS status and their specific characteristics and products of metabolism, these microorganisms are of great interest for industry (Cogan et al., 1997).
These microorganisms are also referred as having immunological properties, the ability of maintaining the gastrointestinal system healthy and producing different metabolites with a positive effect in the human health (Turpin et al., 2010).
6
Several yeasts had also been referred: Kluyveromyces marxianus, Torula kefir,
Saccharomyces exiguus, Candida lambica (Witthuhn et al., 2005b), Candida kefir,
Saccharomyces cerevisiae (Abraham and de Antoni, 1999), Candida krusei and
Candida famata (Witthuhn et al., 2005b; Adriana et al., 2009).
These yeasts are fungi that play a key role in food industry (Fleet, 2007) and particularly in the flavour and aroma of kefir (Simova et al., 2002). In addition, they provide essential nutrients for bacteria growth (e.g. vitamins and amino acids) stimulating them (Farnworth, 2005; Irigoyen et al., 2005; Álvarez-Martín et al., 2008), and they also remove toxic products from metabolism. Furthermore they inhibit the growth of microorganisms, by decreasing the pH of the medium and producing ethanol, carbon dioxide and organic acids (Viljoen, 2001).
There are two types of yeasts: the ones that can ferment lactose, and the ones that cannot ferment lactose and need the assistance of LAB to degrade it (Adriana and Socaciu, 2008).
The microorganisms’ distribution in the grains had been referred as specific and the yeasts are predominantly located in the periphery of the grains (Farnworth, 2005).
2.1.3. Health Interest
Kefir has been described to possess several health benefits: antitumor (Irigoyen et
al., 2005; Urdaneta et al., 2007; Chen et al., 2008), antibacterial and anti-inflammatory
properties (Rodrigues et al., 2005). It stimulates the immune system and has hypocholesterolemic effects (Irigoyen et al., 2005; Urdaneta et al., 2007; Chen et al., 2008). It was also reported that it has beneficial effects for the gastrointestinal tract (Lopitz-Otsoa et al., 2006), facilitating the digestion of lactose (Urdaneta et al., 2007).
These antimicrobial properties are related to the microorganisms that are present in the microflora and to the products of their metabolism, such as organic acids, EPS, carbon dioxide, acetaldehyde, diacetyl (Adriana and Socaciu, 2008; Siritat and Jelena, 2010).
It is considered a complex probiotic due to the microorganisms that constitute it (Urdaneta et al., 2007; Adriana and Socaciu, 2008). A probiotic can be defined as living
7
microorganisms that have a positive effect on the health of the host (Lopitz-Otsoa et al., 2006).
There are several criteria that must be followed to be considered a probiotic strain: the microorganism cannot harm the host; it has to subsist in the gastrointestinal tract and be in a sufficient number to have any benefit to the host, being able to survive and be resistant in that environment (Lopitz-Otsoa et al., 2006; Xie et al., 2012).
The probiotics mostly applied and known for their properties are the LAB and
Bifidobacterium (more applied in the industry). Lactobacilli are the LAB that have more
attention from the researchers, due to their common presence in fermented food (Turpin
et al., 2010).
2.2. Metabolic Products with Industrial Applications
The microorganisms listed in subsection 2.1.2 normally present in kefir have the characteristic of being able to produce different compounds: organic acids, EPS, carbon dioxide, ethanol, acetaldehyde, acetoin, diacetyl, among many others (Adriana and Socaciu, 2008; Siritat and Jelena, 2010). From what was stated above, these products of metabolism can have several applications in the industry, consequently their study is an important field of investigation.
2.2.1. Organic Acids
The characteristic flavour of kefir is the result of the presence of various compounds, such as organic acids (lactic, propionic, citric, acetic, orotic, butyric, hippuric, uric, pyruvic and succinic acids). These compounds can also be used in food industry as flavouring and preservative agents (Mullin and Emmons, 1997; Güzel-Seydim et al., 2000; Zeppa et al., 2001) or even in the production of biodegradable plastics (Theron and Lues, 2011). These acids may be present due to the fatty acids (from the milk) hydrolysis, or as a result of the metabolic processes (Güzel-Seydim et
8
The microorganisms present in kefir, metabolise the substrate (glucose) to produce energy through glycolysis (or other degradative pathway). The final product formed is pyruvate (pyruvic acid) (Güzel-Seydim et al., 2000; Madigan et al., 2009).
If there is oxygen available and the microorganisms are aerobic or, at least are oxygen tolerant, the pyruvic acid is integrated in the Krebs cycle (Figure 2.3), in which take place several oxidations and decarboxylations. Citric and succinic acids are two organic acids produced by this means. In the absence of oxygen, the pyruvic acid is fermented, and other products are formed (Madigan et al., 2009).
Figure 2.3 – Krebs cycle (adapted from Madigan et al., 2009).
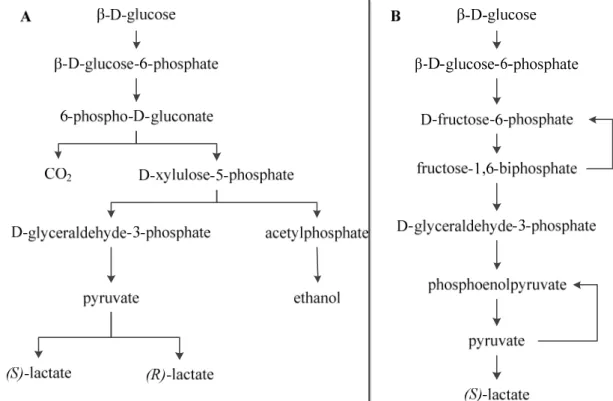
In kefir, the fermentation process could be heterolactic or homolactic (Güzel-Seydim et al., 2000). The first process involves the partial oxidation of carbohydrates, resulting in the release of energy, lactic acid, ethanol and carbon dioxide, while in the
9
second process the only products are lactic acid and energy (Madigan et al., 2009). A representative scheme of these processes can be seen in Figure 2.4.
Figure 2.4 – Schematic representation of heterolactic fermentation (A) (adapted from MetaCyc, 2007a) and homolactic fermentation (B) (adapted from MetaCyc, 2007b).
The glucose could also be metabolised by the microorganisms through mixed acid fermentation, being produced ethanol, hydrogen, carbon dioxide, acetate (acetic acid), lactate (lactic acid) and succinate (succinic acid) (Figure 2.5) (Madigan et al., 2009).
The organic acids produced can be used in food industry. The preservation of food has always been performed by man, through various methods, often without the microbiological knowledge that is inherent. The organic acids are compounds used as food preservatives due to the fact that they are naturally present in food, as ingredients. Consequently, it is common to add organic acids to food in order to control microbial contamination (Theron and Lues, 2011).
Many organic acids are FDA (Food and Drug Administration) and EC (European Commission) approved and are used as preservatives, antioxidants, flavouring agents, acidulants and pH regulators. They have the GRAS status and are applied in the pharmaceutical industry (Theron and Lues, 2011).
10
Figure 2.5 – Mixed acid fermentation (adapted from MetaCyc, 2010).
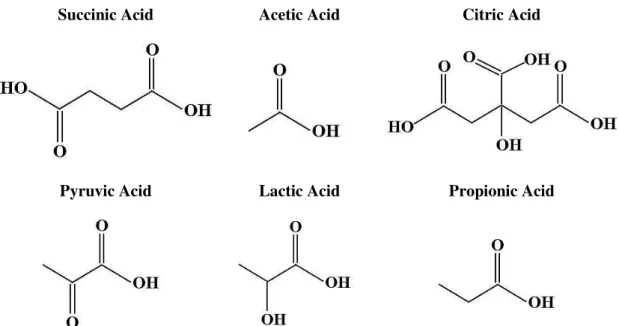
The acids usually present in kefir and other fermented products are typically identified by chromatographic techniques (Mullin and Emmons, 1997; Güzel-Seydim et
al., 2000; Zeppa et al., 2001). The acids investigated in this study are shown in Figure
2.6.
Succinic Acid Acetic Acid Citric Acid
Pyruvic Acid Lactic Acid Propionic Acid
11
Succinic acid is used as a buffer agent in food industry, or as a chemical intermediate in medicine and in perfumes esters manufacture. Acetic acid is a weak acid used as a preservative and a food additive and has GRAS status. It is soluble in lipids and therefore it is able to diffuse through the plasmatic membrane, affecting the pH of the cells, causing their death (Nielsen, 2004; Theron and Lues, 2011).
The citric acid is the preservative and flavouring agent generally applied in food and pharmaceutical industries. This acid acts as a chelate agent of the metallic ions present in the medium, preventing microbial proliferation (Theron and Lues, 2011). Pyruvic acid is also applied as a flavouring agent and as a preservative, inhibiting the microorganisms’ growth (Nielsen, 2004; DCCC, 2010; Theron and Lues, 2011).
Lactic acid has GRAS status and is a preservative, an acidulant, a flavouring agent and a pH regulating agent (Theron and Lues, 2011). Propionic acid is used as a preservative and as a flavouring agent (Nielsen, 2004). Furthermore it can be utilized to produce polymers (Theron and Lues, 2011).
2.2.2. Exopolysaccharides
The matrix that entraps the microorganisms in kefir is composed of EPS, produced by some LAB (especially microorganisms from the genera Lactobacillus and
Lactococcus) (Welman and Maddox, 2003; Irigoyen et al., 2005; Miguel et al., 2010).
A schematic representation of the metabolic production of EPS from lactose is present in Figure 2.7. The molecule of glucose-6-phosphate can be involved in EPS production (anabolic pathways) or in the catabolic pathways (subsection 2.2.1) (Boels et
al., 2001). In this pathway, this molecule is used to produce sugar nucleotides
(UDP-glucose and TDP-(UDP-glucose). The final sugars formed are linked together to constitute the EPS molecules. This mechanism has not been full studied yet (De Vuyst and Degeest, 1999; Welman and Maddox, 2003).
The EPS production is influenced by several factors, such as microorganisms, pH, temperature, agitation, incubation time, oxygen, carbon source and nitrogen sources (Aslim et al., 2005).
12
Figure 2.7 – Schematic representation of the EPS production (adapted from Welman and Maddox, 2003).
There are two types of EPS that can be produced: the homopolysaccharides and heteropolysaccharides. The homopolysaccharides are composed of only one type of monosaccharide (repeated units); and the heteropolysaccharides are formed by two or more units of different monosaccharides (e.g. glucose, galactose, rhamnose), which are repeated along the polysaccharide chain (De Vuyst and Degeest, 1999; Welman and Maddox, 2003; Mozzi et al., 2006).
The EPS are important to the rheology and consequently to the texture of milk products. It acts like a thickener, emulsifying and stabilizing agent (Laws and Marshall, 2001; Frengova et al., 2002). The EPS increases the viscosity, which leads to a superior contact time in the mouth for the products. This allows a better perception of the taste to the consumer (Duboc and Mollet, 2001). The mode of action is explained by the capability of the EPS to interact with the proteins of the milk (caseins) increasing the viscosity of the whey (Duboc and Mollet, 2001).
13
Normally, these properties are reached by the addition of sugars, lipids and other stabilizers (alginate, gelatine or, starch), but since the actual consumers are becoming more aware of the health issues, the demand is for products with low sugar and fat content but, at the same time, with an identical texture. This can be achieved with these natural additives avoiding the artificial ones (Duboc and Mollet, 2001; Welman and Maddox, 2003).
Furthermore it has been published that EPS have favourable effects in health, specially related to gastrointestinal diseases (Habibi et al., 2011) and possible antitumor effects (Duboc and Mollet, 2001; Welman and Maddox, 2003).
The EPS relation with health issues leads to another important definition, which is prebiotics. These are food ingredients that are not digestible for man but can stimulate the growth of certain species of microorganisms, like probiotics. In other words, prebiotics stimulate the presence of probiotics in the gut, leading to the beneficial effects (Barreteau et al., 2006; Sarkar, 2011).
The EPS are polysaccharides that can be hydrolysed to oligosaccharides which some of them have been described as prebiotics. The two main oligosaccharides of interest are galacto-oligosaccharide (GOS) and fructo-oligosaccharide (FOS). The microorganisms’ species that can metabolise these oligosaccharides have to possess enzymes that can break the glycosidic bonds. These enzymes are hydrolases called β-galactosidase (3.2.1.23) and β-fructosidase (3.2.1.80) (Barreteau et al., 2006; Splechtna
et al., 2006). The resulting molecules are fermented by the intestinal microflora in
lactate, propionate and acetate, providing means for the proliferation of the probiotic species (Kouya et al., 2007) and the decreased growth for the pathogenic ones (Fanaro
et al., 2005).
Due to the presence of those enzymes, kefir improves the lactose maldigestion, since the degradation of lactose requires the presence of certain enzymes, which some individuals do not possess. In the presence of kefir, some probiotic strains persist and stay in the microflora of the gut being stimulated by carbohydrates, like lactose, which they degrade to more simple molecules, reducing the maldigestion (Hertzler and Clancy, 2003).
One of the EPS produced from microorganisms present in kefir is called kefiran and it is a heteropolysaccharide with distinct properties, like others EPS (Farnworth, 2005; Adriana and Socaciu, 2008). It is soluble in water and has a branched structure
14
composed by D-glucose and D-galactose in equal amounts (Figure 2.8) (Micheli et al., 1999; Rimada and Abraham, 2001; Badel et al., 2011).
The kefiran application is still very limited due to its low viscosity, therefore it has to be combined with other hydrocolloids agents, like λ-carrageenan (Frengova et al., 2002; Farnworth, 2005).
Figure 2.8 – Kefiran structure (adapted from Micheli et al., 1999).
The EPS can be identified and quantify by different techniques, but the most commonly applied are: molish test (Yang et al., 1999), anthrone method (Rimada and Abraham, 2001; Piermaria et al., 2008), Dubois method (Frengova et al., 2002; Ghasemlou et al., 2012), gas chromatography (Yang et al., 1999; Frengova et al., 2002), HPLC (Gassem et al., 1997; Piermaria et al., 2008), thin layer chromatography (la Rivière and Kooiman, 1967; Rimada and Abraham, 2001; Piermaria et al., 2008) and gel filtration (Yang et al., 1999).
These carbohydrates are less sweet than the usual sugars used in the industry and can enhance the probiotic activities (Sako et al., 1999), whereby they are of great interest to investigation and food industry.
Despite all the advantages referred, considerable research involving its specific properties has to be made to apply this biological EPS in the industry. Only xanthan, gellan and curdlan had been deeply investigated and applied as additives industrially (Badel et al., 2011).
15
3. Materials and Methods
3.1. Microorganisms
The complete study involved seven different strains: Lactobacillus delbrueckii subsp. bulgaricus, Lactobacillus kefir, Lactococcus lactis subsp. lactis (the three were acquired from DSMZ - German Collection of Microorganisms and Cell Cultures),
Candida famata, Candida krusei (both isolated from kefir), Bifidobacterium animalis
subsp. lactis (BB-12 CHR-HANSEN, acquired from Promolac) and Escherichia coli (gently given by UTAD – Universidade de Trás-os-Montes-e-Alto-Douro).
The characteristics, the mediums and the cultivation conditions for all the strains are listed in the Table 3.1. The composition of all the mediums used is described in the Annex A.1.
At the end of the experiments, the microorganisms were preserved at -80 °C (except E. coli) with freezing medium specific for each strain. This freezing medium consists basically in the mediums referred in the Table 3.1 for each strain, but doubly concentrated and with 30% of glycerol.
All the growth studies in skim milk were evaluated by the dry weight method and by filtration of a specific volume of sample. The first method was accomplished by placing 1 mL of the sample in an eppendorf, left to dry in a heater (Selecta) at 60 °C 1,
until constant weight. In the second method, a specific volume of sample was filtered (5 mL) and the retained biomass was washed with 15 mL of distilled water. After heating at 105 °C for 8 hours, the weight of the sample was determined (g weighted/mL filtered).
16
Table 3.1 – Microorganisms applied in the study, their characterisation, origins and cultivations conditions
Microorganisms Photography
(1000x with immersion lens 2) Characteristics Isolated from Medium Cultivation Conditions L. delbrueckii subsp. bulgaricus (DSM 20081) Microaerophilic Gram - positive Bulgarian yogurt3 MRS 37 °C, 2 days anaerobic jar L. kefir (DSM 20587) Aerobic
Gram - positive Kefir grains
3 MRS 30 °C, 2 days
L. lactis subsp. lactis
(DSM 20481)
Aerobic
Gram - positive Not specified
3 CBA 30 °C, 3 days
2 With the exception of L. delbrueckii subsp. bulgaricus, in which the magnification, of the present picture, is 400x.
17
Table 3.1 – Microorganisms applied in the study, their characterisation, origins and cultivations conditions (cont.)
Microorganisms Photography
(1000x with immersion lens) Characteristics Isolated from Medium Cultivation Conditions
C. famata Anaerobic
facultative Kefir grains YMA 30 °C, 2 days
C. krusei Anaerobic
facultative Kefir YMA 30 °C, 3 days
B. animalis subsp. lactis (BB-12 CHR-HANSEN) Anaerobic (slightly oxygen tolerant) Gram - positive
Not specified 3 MRS with
cysteine 0.05% 37 °C, 2 days anaerobic jar E. coli (UTAD private collection) Anaerobic facultative Gram – negative
18
3.2. Organic Acids
The organic acids production was performed using the single microorganisms (referred as isolated microorganisms) and in pulled mixtures with different combinations of microorganisms (Table 3.2).
Table 3.2 – List of the different combinations applied in the study for organic acids production
Isolated microorganisms Combinations of Microorganisms
L. delbrueckii subsp.
bulgaricus L. delbrueckii subsp. bulgaricus + L. kefir
L. kefir L. kefir + L. lactis subsp. lactis
L. lactis subsp. lactis L. lactis subsp. lactis + L. delbrueckii subsp. bulgaricus
C. famata L. delbrueckii subsp. bulgaricus + All the yeasts
(C. famata + C. krusei)
C. krusei L. kefir + All the yeasts (C. famata + C. krusei)
L. lactis subsp. lactis + All the yeasts (C. famata + C. krusei)
All the bacteria (L. delbrueckii subsp. bulgaricus +
L. kefir + L. lactis subsp. lactis)
All the bacteria (L. delbrueckii subsp. bulgaricus +
L. kefir + L. lactis subsp. lactis) + All the yeasts
(C famata + C. krusei)
C. famata + C. krusei
The microorganisms were inoculated into 100 mL Erlenmeyer’s (with 100 mL of skim milk 4) in 24-hour tests, in an orbital incubator (Aralab) at 120 rpm (rotation per minute) and 30 °C (Figure 3.1).
The samples removal was performed under sterile conditions. Seven samples were collected for each condition, for the time zero, after 2.5, 4.0, 6.5, 8.5, 10.0 and 24 hours of growth.
4 These Erlenmeyer’s used had the volume of skim milk, and not a higher volume, due to the fact that one
19
Figure 3.1 – Tests performed with skim milk.
3.2.1. Extraction
For the organic acids extraction it was applied a liquid-liquid extraction, which consists in a separation process that relies on the miscibility of liquids.
Firstly, 25 mL of 0.4% ortho-phosphoric acid (H3PO4 85% (Carlo Erra)), at pH 2.10 (pH meter: Hanna HI 8424) were added to a 4 mL sample. The solutions were stirred and homogenised with a vortex for 5 min (Güzel-Seydim et al., 2000). At this point the samples were centrifuged (5810 R Eppendorf) (Zeppa et al., 2001) for 40 min at 4000 g (relative centrifugal force) at a temperature of 4 °C. The resulting supernatant was filtered using a paper filter with a porosity of 11 µm (Whatman). Samples were preserved in the freezer at -15 °C until HPLC analysis (Güzel-Seydim et al., 2000).
3.2.2. Identification and Quantification by HPLC-UV/Vis
To identify which acids were present and quantify them, it was applied HPLC-UV/Vis (Mullin and Emmons, 1997; Güzel-Seydim et al., 2000; Zeppa et al., 2001; Baptista, 2004).
The mobile phase (0.4% H3PO4) has the same composition as the solution used in the extraction. This solution was filtered in vacuum through a membrane filter of cellulose nitrate with a 0.45 µm pore (Pall Corporation) and afterwards it was degasified (Elma Transsonic 420) (Baptista, 2004).
20
Mixtures of organic acids standards were prepared in order to obtain composed standards (pyruvic (Merck), acetic (VWR), lactic (Sigma-Aldrich), citric (Panreac), propionic (Sigma-Aldrich) and succinic acids (Merck)) were prepared with 0.4% H3PO4 pH 2.10. From one 0.1 g/L stock composed standard solution different concentrations were prepared: 1x10⁻³, 5x10⁻³, 8x10⁻³, 1x10⁻², 2x10⁻², 5x10⁻², 8x10⁻² and 1x10⁻¹ g/L. 5
For succinic acid, higher concentration solutions were also prepared: 5x10⁻², 8x10⁻², 1x10⁻¹, 2x10⁻¹, 3x10⁻¹, 5x10⁻¹ and 7x10⁻¹ g/L. The calibration curves are present in Annex A.2.1.
The standards and samples were filtered with a nylon filter with a 0.45 µm pore (VWR) for 2 mL vials (VWR). Each standard solution/sample was injected twice (20 µL each injection) with a running time of 30 min.
Between the samples it was carried out a column cleaning process of 17 min (to make sure that the next sample didn’t have traces of the previous one), using a gradient of mobile phase and methanol (Figure 3.2). Firstly, for 5 min it was passed mobile phase in the column, then, for 1 minute it was performed the passage of mobile phase to methanol. Subsequently, the methanol was left running for 5 min, then it was made a new passage from methanol to mobile phase for 1 minute, and finally it was stabilized with mobile phase for 5 min.
Figure 3.2 – Schematic representation of the column cleaning process. The mobile phase (0.4% H3PO4) is represented in green and the methanol is represented in orange.
5 Several acids from an organic acids kit (Sigma-Aldrich) were also tested, but the peaks weren’t able to
be distinguished clearly. The time did not allow the optimization of these organic acids identification.
0 1 2 3 4 5 6 7 8 9 10 11 12 13 14 15 16 17 0 .4 % H 3 P O4 (g re en )/ M et h a n o l (o ra n g e) Time (minutes)
21
In parallel the samples were also analysed with the composed standards added (500 µL sample + 500 µL composed standards) to confirm that the analysed acids were present.
Equipment:
Column: C18 (Merck, LiChroCART® 250-4 Purospher® STAR RP-18 endcapped (5 µm))
Oven: Jasco CO-2060 Plus Injector: Jasco AS-2057 Plus
Detector: UV-Vis (Jasco MD-2515 Plus) Pump: Jasco PU-2080 Plus
Ternary Gradient Unit: Jasco LG-2080-02 Degasifier: Jasco DG-1580-54
Software: Jasco ChromPass Chromatography Data System 1.8.2.1
Conditions: Flow: 0.7 mL/min Oven temperature: 25 °C
λdetection: 210 nm
3.3. Exopolysaccharides
The EPS production was achieved applying the isolated and combined microorganisms (Table 3.3). It has to be stated that the yeasts weren’t applied without a bacteria in the combination, due to their incapability of producing EPS.
The microorganisms were inoculated into 100 mL Erlenmeyer’s (with 100 mL of skim milk) in 48-hour tests, in an incubator (Foc 225E refrigerated incubator) at 30 °C.
It was also tested the growth with whole milk, but it was interrupted, since the extraction applied was not efficient.
The samples removal was performed under sterile conditions and in duplicated. Four samples were collected for each strain combination, for the time zero, after 24, 30 and 48 hours of growth.
22
Table 3.3 – List of the different combinations applied in the study of EPS production
Isolated microorganisms Combinations of Microorganisms
L. delbrueckii subsp.
bulgaricus L. delbrueckii subsp. bulgaricus + L. kefir
L. kefir L. kefir + L. lactis subsp. lactis
L. lactis subsp. lactis L. lactis subsp. lactis + L. delbrueckii subsp. bulgaricus B. animalis subsp. lactis L. delbrueckii subsp. bulgaricus + All the yeasts
(C. famata + C. krusei)
L. kefir + All the yeasts (C. famata + C. krusei) L. lactis subsp. lactis + All the yeasts (C. famata +
C. krusei)
All the bacteria (L. delbrueckii subsp. bulgaricus +
L. kefir + L. lactis subsp. lactis)
All the bacteria (L. delbrueckii subsp. bulgaricus +
L. kefir + L. lactis subsp. lactis) + All the yeasts
(C. famata + C. krusei)
3.3.1. Extraction
Initially, two different extraction methods were tested: an ethanolic extraction (Rimada and Abraham, 2001; Taniguchi et al., 2001; Yuksekdag and Aslim, 2008; Ghasemlou et al., 2012) and another one with a Dowex resin (with Na+-form, strongly acidic (Sigma Aldrich)) (Simões et al., 2011) (Annex A.3). The extraction chosen was the first one, due to the matrix used (skim milk).
The ethanolic extraction performed had several steps. First, and immediately after removing the samples, they have to be heated in a bath (Grant GD 120) at 90 °C for 20 min. This was performed in order to inactivate the enzymes that could hydrolyse the polymer and to detach it from the cells (Kimmel et al., 1998; Rimada and Abraham, 2001).
At this point the samples were centrifuged (5810 R Eppendorf) at 4000 g, for 30 min at 20 °C. Subsequently the supernatants were precipitated with ethanol 96% (1:1) and left 4 °C overnight (Rimada and Abraham, 2001; Yuksekdag and Aslim, 2008; Ghasemlou et al., 2012).
23
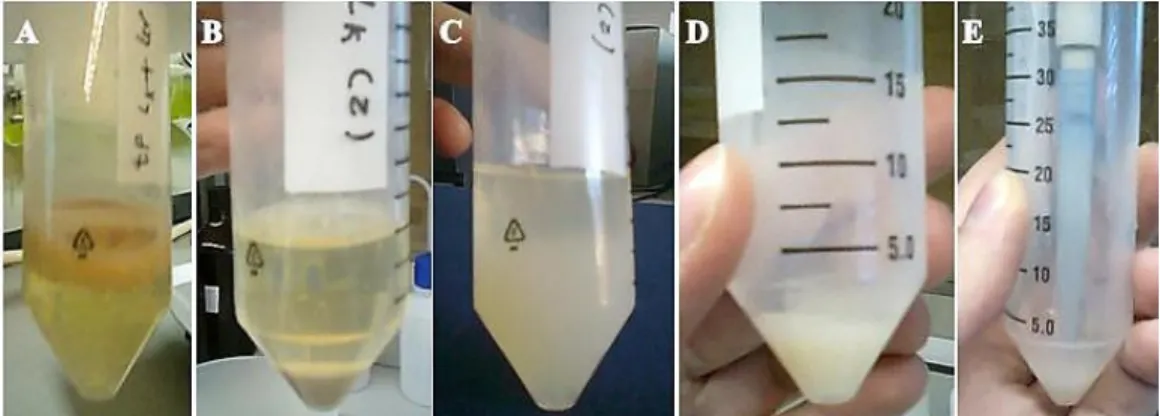
Afterwards a second centrifugation step was performed for 30 min, at 4000 g and at 4 °C (5810 R Eppendorf). The pellet (EPS) were ressuspended with 1 mL of distilled water (Rimada and Abraham, 2001; Yuksekdag and Aslim, 2008; Ghasemlou et al., 2012). The steps of this process are present in Figure 3.3.
Figure 3.3 – Process of extraction. A – After heating; B – First step of centrifugation after heating; C – Precipitation with ethanol; D – Pellet after second centrifugation; E – Ressuspending the pellet in distilled water.
3.3.2. Hydrolysis
Several hydrolysis were tested (Table 3.4) with sulphuric acid 95% (VWR) in different concentrations, temperature and time conditions. To each 500 µL of sample were added 5 mL of H2SO4. 6
Table 3.4 – Conditions tested for the sulphuric acid hydrolysis
Concentration Temperature (°C) Time (min) 95% Room temperature - 1 M 100 30 2 M 100 30 2 M 130 30 2 M 150 30
The procedures with high temperatures were executed in a controlled temperature digester (spectroquant TR 420, Merck).
6 The hydrolysis procedure was executed only for the identification and quantification by HPLC-RI and
24
Despite the published literature (la Rivière and Kooiman, 1967; Grobben et al., 1997; Petry et al., 2000), the hydrolysis condition chosen was H2SO4 2M, at 150 °C for 30 min. Posteriorly the hydrolysis with concentrated H2SO4 (95%) at room temperature was also analysed.
3.3.3. Identification and Quantification by HPLC-RI
To identify and quantify the carbohydrates present, it was applied HPLC with a refractive index detector (RI) (Gassem et al., 1997; Piermaria et al., 2008).
The mobile phase (H2SO4 0.005 M) was prepared with distilled water and sulphuric acid 95-97% (VWR).
The composed standards (glucose (Fluka), galactose (AppliChem), rhamnose (Sigma-Aldrich) and lactose (Liofilmchem)) were prepared with distilled water. From one 5.00 g/L composed standards stock solution different concentrations were prepared: 0.01, 0.05, 0.08, 0.10, 0.20, 0.40, 0.80, 1.00, 1.50, 2.00, 2.50, 3.00, 3.50, 4.00 and 4.50 g/L. The calibration curves are present in Annex A.2.2.
These standards were chosen mainly due to the fact that glucose, galactose and rhamnose are reported to be the component sugars of EPS produced by microorganisms, such as L. delbrueckii subsp. bulgaricus (Cerning, 1995), while lactose’s presence was also analysed since there was the possibility that the hydrolysis was not complete.
The standard solutions were filtered with a nylon filter of 0.45 µm (VWR) for 2 mL vials (VWR). The hydrolysed samples were not filtered because of their composition in sulphuric acid. Each standard solution/sample was injected twice (20 µL each injection) with a running time of 20 min.
Equipment:
Column: Sugar SH1011 (Shodex), particle size: 6 µm Oven: Jasco CO-2060
Injector: Jasco AS-2057 Detector: Jasco RI-2031 Pump: Jasco PU-2089 Software: ChromNAV
25
Conditions: Flow: 0.7 mL/min Oven temperature: 35 °C
3.3.4. Quantification by DNS Method
To quantify the reducing sugars present in the EPS hydrolysed samples, the DNS method was employed, using glucose as standard (Miller, 1959). From one 5.0 g/L glucose stock solution different concentrations standard solutions were prepared: 0.1, 0.2, 0.4, 0.6, 0.8, 1.0, 1.4, 2.0, 2.5 and 3.0 g/L. The calibration curve is present in Annex A.2.3.
For each 500 µL of hydrolysed sample, 500 µL of DNS (the reagent preparation is described in Annex A.3) were added. The solution was mixed and heated (GD 120 Grant) at 80 °C, for 5 min. Afterwards the samples were cooled down (until they reached room temperature) and 5 mL of distilled water were added. The mixture was homogenised and the absorbance was read with a plastic cuvette at 540 nm in the UV-Vis spectrophotometer (V-1200 VWR). In the blank, the volume of sample was replaced by distilled water with H2SO4 (in the same proportion as in the hydrolysis).
3.3.5. Quantification by Dubois Method
The total amount of sugars was measured by the Dubois method using glucose as standard (Dubois et al., 1956). From one 1.00 g/L glucose stock solution different concentrations were prepared: 0.01, 0.08, 0.10, 0.20, 0.40, 0.80 g/L. In Annex A.2.4 the calibration curve is presented.
The EPS samples used in this method were not hydrolysed. To perform the method were used glass tubes. For each 250 µL of sample (EPS extracted), 2.5 mL of H2SO4 95-97% (Merck) and 500 µL of phenol 50 g/L (Merck) were added. The mixture was homogenised and allowed to stand for 15 min. The absorbance was read at 490 nm in the UV-Vis spectrophotometer (V-1200 VWR) with a glass cuvette (Nahita). In the blank the volume of sample was replaced by distilled water.
26
3.4. Bifidogenic Effect
The bifidogenic effect was evaluated by the EPS hydrolysis, using specific microorganisms’ strains - B. animalis subsp. lactis as the hydrolysing agent and E. coli as the control.
It was studied the potential bifidogenic effect in B. animalis subsp. lactis due to the fact that this microorganism is considered a probiotic and has beneficial effects in the human health (Kearney et al., 2008). As E. coli is present in the intestinal area and cannot hydrolyse exopolysaccharides, it was used as the control (Sako et al., 1999).
To perform this experiment it was used MRS as the medium but altered (AMRS), in order to substitute all the carbon sources by the EPS extracted from kefir (employing the same procedure described in the section 3.3.1). Additionally, the EPS was added to the AMRS at three different concentrations (C1 - half of the sugars concentration present in the original MRS; C2 – the same concentration of sugars present in the original MRS; C3 – 10 times higher than C1). The composition of the AMRS is in Annex A.1.
It should be noted that the EPS is only added to the solution after autoclaving, since at 121 °C it was formed a precipitate. To sterilize the EPS, it was used UV light in a laminar flux camera (SG 403A-HE-INT, Baker) for 30 min.
The microorganisms were inoculated into 100 mL Erlenmeyer’s (with 100 mL of AMRS) during 48 hours, in an incubator (Foc 225E refrigerated incubator) at 37 °C.
The samples collection was performed in duplicate under sterile conditions. In total, samples at five different times (for the time zero, after 6, 24, 30 and 48 hours of growth) were collected, for each strain, to evaluate the hydrolysis. The growth study was measured by the optic density (OD) with an UV-Vis spectrophotometer (VWR) at 610 nm.
3.4.1. Quantification by DNS Method
To verify the EPS hydrolysis it was used the DNS method, already described in the subsection 3.3.4. In the blank, the volume of sample was replaced by a sample of the medium without the EPS.
27
4. Results and Discussion
4.1. Organic Acids
In this subsection the production of organic acids for the combination of strains referred in the section 3.2 will be evaluated.
Before further analysis, it has to be explained that the growth study of the strains in skim milk was not able to be demonstrated. This can be justified by the fact that this medium does not allow an OD determination, because it has to be diluted 10 times, which implicates an enormous error. To solve this problem two different solutions were applied: filtration of a volume of a sample and determination of the dry weight residue; and the dry weight technique. The two possible solutions were unsuccessful. The first one was not possible due to filter clogging. The second one was not representative of the cells, as a small volume (1 mL) was used which involves errors. As a consequence of these errors the results were not conclusive and they are not presented.
From the retention times obtained for the standards (Table 4.1), the organic acids presence in the samples was identified. The chromatograms for the standards and samples are presented in Annex A.4.
Table 4.1 – Retention times for the organic acids standards
Standards Retention Time (min)
Pyruvic Acid 4.63 Citric Acid 5.46 Lactic Acid 6.68 Acetic Acid 7.33 Propionic Acid 9.90 Succinic Acid 13.82
28
From the acids identified, all of them were reported as metabolic products for
C. famata and L. lactis subsp. lactis (Álvarez-Martín et al., 2008).
The results were classified as significant or not significant through the Student’s
t - test, whose theoretical basis is present in the Annex A.5.
The pyruvic acid production (Figure 4.1) starts, approximately, 2 hours after the beginning of the experiment, which indicates the occurrence of glycolysis (or other degradative pathways of glucose) leading to pyruvate production. Subsequently, this pyruvate is consumed: after 8/10 hours of experiment its concentration decreases until it is not detected. This indicates that at this point (8/10 hours) starts the fermentation and the other acids are produced (Güzel-Seydim et al., 2000).
As regards to Figure 4.1A, one can see that L. lactis subsp. lactis is the strain that produces a higher value of pyruvic acid concentration. The other two bacteria have a similar behaviour between them. These results were not significantly different (P>0.05). On the other hand, when the bacteria are combined with each other (Figure 4.1B),
L. lactis subsp. lactis + L. delbrueckii subsp. bulgaricus is the one combination that had
a higher concentration value, no significantly different (P>0.05) from isolated L. lactis subsp. lactis. In addition L. delbrueckii subsp. bulgaricus + L. kefir and L. kefir + L.
lactis subsp. lactis had a similar performance between each other, not being
significantly different (P>0.05).
The isolated bacteria + yeasts (Figure 4.1C), all the bacteria and all the bacteria + yeasts (Figure 4.1D) exhibit an analogous behaviour and their pyruvic acid concentration was not significantly different (P>0.05).
The highest values for pyruvic acid production were obtained for the isolated and mixed yeasts (Figure 4.1E). Once again, the difference in pyruvic acid concentration was not considered significant (P>0.05).
The highest concentration exhibited by the yeasts (despite the variations in pyruvic acid concentrations are not considered significant (P>0.05)) can be justified by the fact that the bacteria are using the substrate (lactose) to produce the EPS, while the yeasts cannot produce EPS and use the substrate to survive. Therefore the pyruvic acid concentrations are neither higher nor detected, as it is being used.
The results obtained (Figure 4.1E) can also demonstrate that the yeasts are able to degrade lactose, not needing the LAB to hydrolyse the disaccharide (van den Tempel and Jakobsen, 1998; Viljoen, 2001).