www.scielo.br/aabc
Efficiency of playback for assessing the occurrence of five bird species
in Brazilian Atlantic Forest fragments
DANILO BOSCOLO1, JEAN PAUL METZGER1 and JACQUES M.E. VIELLIARD2 1Departamento de Ecologia, Instituto de Biociências, Universidade de São Paulo
Rua do Matão, 321, Travessa 14, 05508-900 São Paulo, SP, Brasil 2Departmento de Zoologia, Instituto de Biologia, Universidade Estatual de Campinas
Caixa Postal 6109, 13083-970 Campinas, SP, Brasil
Manuscript received on April 17, 2006; accepted for publication on April 19, 2006; contributed byJACQUESM.E. VIELLIARD*
ABSTRACT
Playback of bird songs is a useful technique for species detection; however, this method is usually not stan-dardized. We tested playback efficiency for five Atlantic Forest birds (White-browed WarblerBasileuterus leucoblepharus, Giant AntshrikeBatara cinerea, Swallow-tailed ManakinChiroxiphia caudata, White-shouldered Fire-eyePyriglena leucopteraand Surucua TrogonTrogon surrucura) for different time of the day, season of the year and species abundance at the Morro Grande Forest Reserve (South-eastern Brazil) and at thirteen forest fragments in a nearby landscape. Vocalizations were broadcasted monthly at sunrise, noon and sunset, during one year. ForB. leucoblepharus,C. caudataandT. surrucura, sunrise and noon were more efficient than sunset.Batara cinereapresented higher efficiency from July to October. Playback expanded the favourable period for avifaunal surveys in tropical forest, usually restricted to early morning in the breeding season. The playback was efficient in detecting the presence of all species when the abundance was not too low. But onlyB. leucoblepharusandT. surrucurashowed abundance values significantly related to this efficiency. The present study provided a precise indication of the best daily and seasonal periods and a confidence interval to maximize the efficiency of playback to detect the occurrence of these forest species.
Key words:playback, birds, forest fragments, methodology development, Atlantic forest, São Paulo State.
INTRODUCTION
Species occurrence data have often been used to monitor populations in fragmented habitats and to understand the effects of fragmentation on popu-lation survival (Hanski 1994, Clergeau and Burel 1997, Lindenmayer et al. 1999). This kind of data should be easy to collect, enabling surveys of a large number of habitat fragments in a short period of time. To be efficient, these methods must be fast in
*Member Academia Brasileira de Ciências Correspondence to: Jean Paul Metzger E-mail: [email protected]
the detection of the species presence and accurate in the recognition of their absence.
One main challenge is to avoid the problem of “false absence” (Thompson 2002). Cryptic be-haviour or seasonal and daily variations in species activity can make this task difficult, especially if the survey is conducted inside dense habitats such as neotropical forests (Catchpole and Slater 1995, Sick 1997), where visual contact is seriously limited. To reduce this problem, surveys may be conducted with the assistance of playback calling.
play-back increases the number of contacts during bird surveys (Johnson et al. 1981, Rosenfield et al. 1985, Johnson and Dinsmore 1986, Kaufmann 1988, Swift et al. 1988, Sliwa and Sherry 1992). Some exper-iments indicated that the playback of conspecific songs is efficient in inducing aggressive responses from various bird species, allowing their detection (Milligan 1966, Møller 1992, Catchpole and Slater 1995). Mosher et al. (1990) pointed out that the use of playback during bird surveys might not only increase the contact rate but also reduce the interval needed for the first contact. Other studies, how-ever, pointed out that variations in the abundance of birds in the forest might have an effect on the results obtained by playback experiments (Glahn 1974, Mosher and Fuller 1996, Schieck 1997). Al-though playback techniques are widely used to sur-vey birds, few studies have been conducted with the aim of standardizing it. According to Morrell et al. (1991) and Ratcliffe et al. (1998), the standardiza-tion of the technique can reduce the operastandardiza-tion cost and increase the possibility of collecting a large data set in a short time. These factors become even more important when the objective is to sample a large number of fragments.
The current study was designed to develop an accurate and simple tool to detect the presence and absence (occurrence pattern) of strictly forest bird species inside a tropical fragmented landscape. Our specific objectives were: i) to verify the time of the day and season of the year when some Atlantic Forest bird species are more efficiently detected by playback; ii) to test if the efficiency of the technique is affected by the abundance of the birds.
MATERIALS AND METHODS
STUDYREGION
The study region was located on the Atlantic Plateau of São Paulo (Brazil), between the municipal dis-tricts of Cotia and Ibiúna (23◦35’–23◦50’S and
46◦45’–47◦15’W). Local relief is characterized by
hills with more than 15% of inclination and eleva-tions between 850 and 1100 m (Ross and Moroz
1997). The climate type is temperate and rainy, as Köppen’s (1948) Cfa. Mean monthly tempera-ture ranges from 11◦C to 27◦C and mean annual
precipitation is about 1400 mm, with the coldest and driest months between April and August. The original vegetation cover was classified as “dense montane ombrophilous Atlantic Forest” (Veloso et al. 1991). Nowadays, the region is composed of nearly 360 fragments of second growth forest that ranges from 1 to 300 ha. The landscape presents 31% of forest fragments in medium to late succes-sional stages and 6% of early successucces-sional forests, totalling 37% natural vegetation. The remaining area is composed of agricultural fields, pastures, exotic forest plantation and human infrastructure (Metzger 2003). Five km east of the fragmented landscape, over the same geomorphologic unit, lies the Morro Grande Forest Reserve (23◦39’–23◦48’S
and 46◦47’–46◦55’W), a 9.400 ha continuous late
second growth forest well connected with the ma-ture rainforest of the Paranapiacaba sierra.
STUDIEDSPECIES
Five bird species were chosen considering three main criteria. Firstly, they were strictly forest spe-cies that exhibit territorial behaviour, thus being likely to respond to playback (J.M. Goerck, unpub-lished data, Stotz et al. 1996). Secondly, in or-der to consior-der species that perceive the landscape in different ways and present distinct sensitivity to the fragmentation of their habitat, the chosen spe-cies presented also diverse biological characteris-tics. Finally, all species were also non-migratory and can be found all year long at the study sites.
TABLE I
Selected bird species and their characteristics. In: insectivorous; Fr: frugivorous; Bc: below canopy; Ms: middle storey; Us: understorey.
Species
Family Weigh Feeding Habitat Sensitivity to
(common name) habit fragmentation
Basileuterus leucoblepharus
(White-browed Warbler) Parulidae 20 g In Us Low
Batara cinerea
(Giant Antshrike) Formicariidae 140 g In Bc + Ms Low
Chiroxiphia caudata
(Swallow-tailed Manakin) Pipridae 25 g Fr Ms + Us Medium
Pyriglena leucoptera
(White-shouldered Fire-eye) Formicariidae 30 g In Ms + Us Medium
Trogon surrucura
(Surucua Trogon) Trogonidae 70 g Fr Bc High
3 – Swallow-tailed ManakinChiroxiphia caudata, a Pipridae weighing around 25 g known by its char-acteristic and intricate sexual behaviour (Foster 1981). The species is frugivorous, inhabits the in-termediate strata of the forest and is moderately af-fected by habitat fragmentation (Uezu et al. 2005). 4 – White-shouldered Fire-eye Pyriglena leucop-tera, another Formicariidae, weighing about 30 g.
This species is of medium sensitivity to fragmen-tation (Uezu et al. 2005) and lives in the middle and low storeys of the forest searching for insects (Sick 1997). 5 – Surucua TrogonTrogon surrucura,
from the family Trogonidae, is a large frugivorous bird that weights approximately 70 g. Because of its size and feeding habits, it is very susceptible to fragmentation (Goerck 1997), being present only in large forest fragments (Uezu et al. 2005).
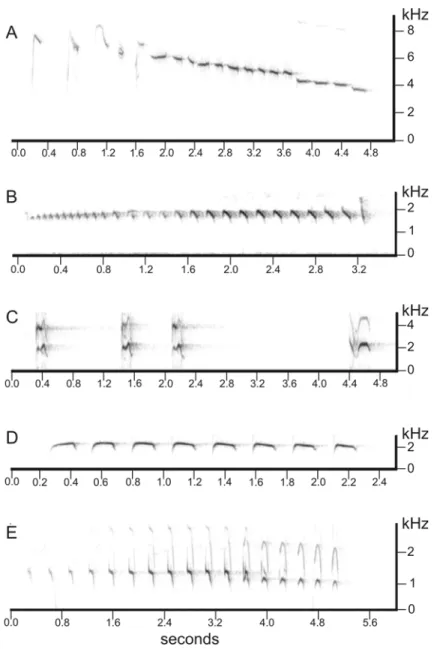
SONGRECORDINGS
Male bird song or call recordings were obtained from the Arquivo Sonoro Neotropical (ASN) of the Universidade Estadual de Campinas (UNICAMP), Brazil. The vocalization of each species is distinc-tive and with unique characteristics (Fig. 1): A – The song ofB. leucoblepharus consists of a high-pitched scale of descending notes; B –Batara cine-rea vocalizes a long and trilled song with the last
note shorter; C – The vocalization ofC. caudata
is characterized by strong calls usually, but not al-ways, repeated for several times; D – The song of
P. leucoptera is very penetrating in the forest and
is characterized by an unvarying sequence of the same note; and E –Trogon surrucura sings a con-stant series of 14 to 17 notes with the last ones lower.
Song recordings were broadcasted using a Sony TCM-5000EV cassette tape recorder with the speaker positioned between one and two meters above the ground. The volume of the broadcast was set for human ears to hear it at a maximum distance of 100 m. The intensity of the songs, measured with a Bruel & Kjaer decibel meter positioned at 1 m from the speaker was: 79.2 dB forB.
leucoble-pharus, 81.6 dB forB. cinerea, 75.0 dB forC.
cau-data, 79.0 dB forP. leucopteraand 79.5 dB forT.
surrucura.
DAILY ANDSEASONALVARIATION OF PLAYBACKEFFICIENCY
Fig. 1 – Sonograms of the vocalizations used for each studied species for the playback surveys.
A:B. leucoblepharus; B:B. cinerea; C:C. caudata; D:P. leucoptera;E:T. surrucura. Each sonogram is presented in a distinct scale of time (in seconds) and frequency (in kHz). Extracted from the Arquivo Sonoro Neotropical (ASN), UNICAMP.
environmental conditions between sites, their selec-tion was guided according to the forest type and structure. Playback sessions were conducted every separate month and for different times of the day. The sum of detected bird responses to the playback within each tested month or period of the day was termed detection efficiency. Therefore, efficiency
values for a single species may vary from zero to the total number of playback sessions conducted at a given month or day period. In order to allow eas-ier comparisons, these values were also standardised as percentages of positive response.
set: 1) during the two hours after sunrise; 2) at about two hours around noon and 3) during the two hours before sunset. At each period, three playback ses-sions were broadcasted for each one of the species at three different sampling points (nine playback sessions at nine different points per day). Each back session was composed by one minute of play-back, intercalated by thirty seconds of silence, to account for responsive birds (Johnson et al. 1981), until five minutes were completed (Morrell et al. 1991, Sliwa and Sherry 1992). To avoid the sti-mulation of the same bird more than once during the same period, sampling points were set at least 200 m away from each other (Sliwa and Sherry 1992). The sequence of species broadcasted was set randomly at each point. To prevent habituation of the birds to the recorded songs no sampling point was tested more than once a month (W.R. Silva, un-published data).
At each session, the response by the birds was recorded as negative (no response) or positive. A response was considered positive when changes in the behaviour of the birds were detected after the playback begun. These changes were usually rec-ognized as increased rate of vocalization and/or al-terations in the movement of the birds towards the sound source. If an individual was detected clos-ing in and/or circlclos-ing around the sound source in silence during or after the playback, it was also doc-umented as a responsive bird. Birds detected be-fore the beginning of the playback but that did not show any changes in their behaviour demonstrating specific interest for the played song during or af-ter the broadcast were noted as negative responders (no response). To identify how long it takes for each species to respond to the playback, the time elapsed between the beginning of the playback and the de-tection of positive response, termed as the latency time, was also noted. This was made in order to identify which is the minimum time that someone should wait for a response to take place before stat-ing that the species is absent durstat-ing that session. A short waiting time may lead to a decrease in the quantity of contacts by impeding the detection of
late responsive birds. On the other hand, it would not be convenient to wait for periods longer than the mean latency time of the species added to its stan-dard deviation, as it is unlikely that a bird responds after this and the species could then be documented as absent for the tested point without further loss of time. After the end of the last species broadcast, the observer (DB) waited for five additional minutes to account for birds with long latency of response. Playback was not carried out during rainy days due to noise interference (Johnson et al. 1981).
These procedures were repeated three days a month for twelve consecutive months. For each species, 27 playback sessions were conducted monthly, totalling 324 tests apiece, 108 at each pe-riod of the day. Differences in birds detection effi-ciency along the day were verified through G-tests in contingency tables, and when significant differ-ences were detected (P<0.05) ana posterioriχc2test (Zar 1999) was used. Detection efficiency through-out the year was tested with circular statistics, com-paring the twelve months through the Rayleigh’s test (Zar 1999), with a significance of P<0.05.
PLAYBACKDETECTIONEFFICIENCY INRELATION TOBIRDABUNDANCE
sequence was set by this parameter, in order to in-crease bird detection probabilities. Consequently, the first broadcasted species was the one with high-est latency time and the last with the shorthigh-est. Each study site (fragments or Reserve sites) was sampled for four different non-consecutive days at the best season of the year and time of the day. In each one of the four days, three sampling points were randomly selected for the playback trials, totalising twelve playback sessions per site and species for each one of the sixteen sites. Each site was sur-veyed with playback twice at sunrise and twice at noon, between 1 August and 29 September 2001.
The abundance information was estimated between May 2000 and April 2001 through pas-sive point counts (Blondel et al. 1970, Vielliard and Silva 1990), at the same points used for the playback (Uezu et al. 2005). This was the best available abundance estimate for all studied spe-cies and could be used as a precise occurrence data at these sites. All fragments were sampled during early morning for one day every two months. At each day, one fragment was selected and five sam-ple points were randomly chosen in it. Each point was observed for 20 minutes to account for present birds. By dividing the number of contacts, visual and/or auditory, by the number of sampled points an Index of Point Abundance (IPA) was then calcu-lated for each species in each fragment.
To test if detection efficiency was related to bird abundance in the forest, three different methods were used. The playback-determined occurrence of the birds (dependent variable) was related with their abundance (IPA, independent variable) in a logistic regression (Ratcliffe et al. 1998). A Pearson correlation analysis (Zar 1999) was done between the response rates to the playback in each fragment and the IPA. The response rate was defined for each species as the quantity of positive responses in each site divided by twelve, the total number of playback sessions conducted after four survey days. Finally, the percentage of sites where the playback correctly attested the presence of the birds (defined by point counts results) was calculated. To verify how many
visits to the fragments were needed for the playback to acquire a similar occurrence pattern as obtained by point counts, the three above explained meth-ods were conducted for all possible combinations of one, two, three and four survey days.
RESULTS
DETECTION EFFICIENCY INRELATION TO THE TIME OFDAY ANDSEASON OF THEYEAR
The species with the highest percentages of pos-itive responses inside the Reserve was B.
leuco-blepharus(Table II). Mean latency time varied
be-tween species from 2 to 8.3 minutes (Table III). The analysis of variance showed that latency times were significantly different among species (F4= 41.16;
P<0.01). Thea posterioritest indicated that the
latency time ofB. cinereawas significantly longer
than any other tested species (P<0.01). The latency presented byC. caudatawas different from that of
T. surrucura(P<0.01) but not ofB. leucoblepharus
(P = 0.80). No significant differences were found betweenP. leucopteraandT. surrucura(P = 0.58)
or betweenP. leucopteraandC. caudata(P = 0.27). Three species, B. leucoblepharus,C. caudata
andT. surrucurashowed significant differences in
detection efficiency according to the period of the day (Table III). Thea posterioriχc2test indicated
that the efficiency at sunrise and noon was signif-icantly higher in comparison with the period just before sunset (Table III).
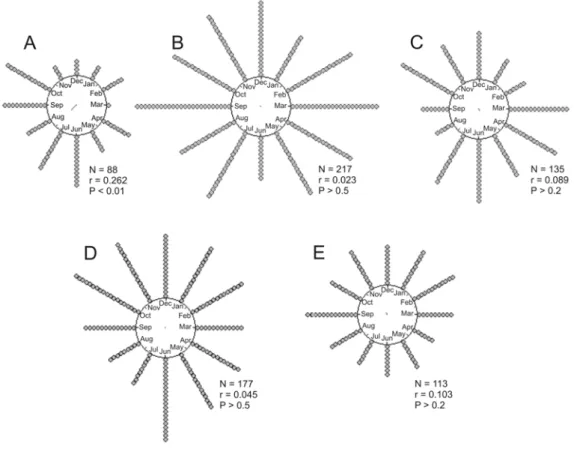
According to the Rayleigh’s test, the only spe-cies to present a mean season of higher efficiency
wasB. cinerea(z0.05,88= 6.041; P<0.01, Fig. 2).
All other species had uniform distributions of effi-ciency throughout the twelve tested months (Fig. 2). The mean period of higher efficiency forB. cinerea
TABLE II
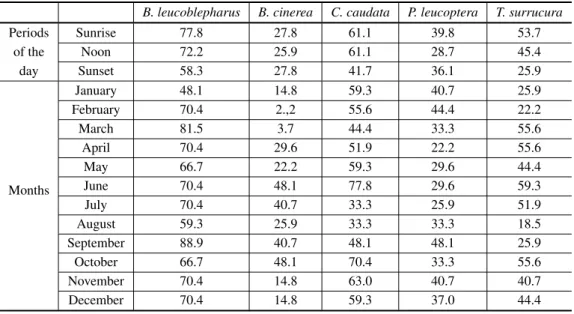
Percentages of detected positive responses to playback according to each tested period of the day and month for the five studied species.
B. leucoblepharus B. cinerea C. caudata P. leucoptera T. surrucura
Periods Sunrise 77.8 27.8 61.1 39.8 53.7
of the Noon 72.2 25.9 61.1 28.7 45.4
day Sunset 58.3 27.8 41.7 36.1 25.9
Months
January 48.1 14.8 59.3 40.7 25.9
February 70.4 2.,2 55.6 44.4 22.2
March 81.5 3.7 44.4 33.3 55.6
April 70.4 29.6 51.9 22.2 55.6
May 66.7 22.2 59.3 29.6 44.4
June 70.4 48.1 77.8 29.6 59.3
July 70.4 40.7 33.3 25.9 51.9
August 59.3 25.9 33.3 33.3 18.5
September 88.9 40.7 48.1 48.1 25.9
October 66.7 48.1 70.4 33.3 55.6
November 70.4 14.8 63.0 40.7 40.7
December 70.4 14.8 59.3 37.0 44.4
TABLE III
Mean latency values (in minutes) and playback positive (pos) and negative (neg) responses according to the period of the day for the five studied species (N= 108 for each species and period)
inside the Morro Grande Forest Reserve. P: significance level.
Playback responses G test a posterioriχc2
Species Latency N* Sunrise Noon Sunset sr×nn×st (sr + nn)×st sr×nn (sr) (nn) (st) G(2)(P) χc2(1)(P) χc2(1)(P) pos neg pos neg pos neg
B. leucoblepharus 2.0±1.9 84 24 78 30 63 45 10.09 8.65 0.62
225 (P<0.01) (P<0.01) (P>0.25)
B. cinerea 8.3±8.1 30 78 28 80 30 78 0.12
88 (P>0.9)
C. caudata 2.6±2.6 66 42 66 42 45 63 10.99 10.21 0.02
177 (P<0.01) (P<0.01) (P>0.99)
P. leucoptera 3.6±4.1 43 65 31 77 39 69 3.08
113 (P>0.1)
T. surrucura 4.2±5.1 58 50 49 59 28 80 18.58 15.56 1.18
135 (P<0.01) (P<0.01) (P>0.9)
Fig. 2 – Distribution of positive responses (gray dots) to the playback during one year of surveys and Rayleigh’s test results.A:B. cinerea;B:B. leucoblepharus;C:T. surrucura;D:C. caudata;E:P. leucoptera. N: number of playback sessions; r: concentration level, P: significance level.
to October were also compared to responses from the rest of the year, confirming that this was the period of highest playback efficiency to detectB.
cinereain the forest (McNemar’s test,χc21= 5.1127;
P<0.025).
DETECTIONEFFICIENCYACCORDING TO THE ABUNDANCE OF THEBIRDSINSIDE
FORESTFRAGMENTS
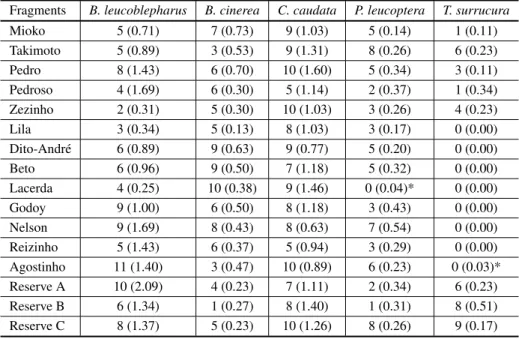
Three species were detected in all sampled sites by both the playback and the point counts (Table IV). The two methods presented similar species oc-currence results, except for two fragments where
T. surrucuraandP. leucopterawere detected only
by point counts but not by playback (Table IV). In both cases, species abundance (IPA) was low, indi-cating that the playback was deficient in detecting
occurrence only when IPA was less than 0.05. Logistic regression was calculated only forT.
surrucurasince it was the only species not present
at all sampled sites. One single survey day was enough to incur into a significant regression, indi-cating a strong relation between the two tested vari-ables (Table V).
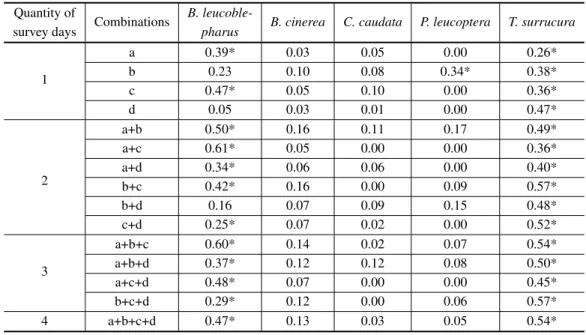
The correlation analyses showed contrasting results. For three species, B. cinerea, C. caudata
andP. leucoptera, almost no correlation between
playback response rate and IPA were observed for any of the 16 possible combinations (Table VI). For
B. leucoblepharusandT. surrucura, nearly all
pos-sible combinations had significant positive correla-tions, showing a strong influence of the abundance on the detection by playback.
TABLE IV
Number of positive responses for each study site obtained after twelve playback sessions per species and abundance values (IPA) in parenthesis (Uezu et al. 2005). Cases where
IPA and playback results disagreed are marked with *.
Fragments B. leucoblepharus B. cinerea C. caudata P. leucoptera T. surrucura
Mioko 5 (0.71) 7 (0.73) 9 (1.03) 5 (0.14) 1 (0.11)
Takimoto 5 (0.89) 3 (0.53) 9 (1.31) 8 (0.26) 6 (0.23) Pedro 8 (1.43) 6 (0.70) 10 (1.60) 5 (0.34) 3 (0.11) Pedroso 4 (1.69) 6 (0.30) 5 (1.14) 2 (0.37) 1 (0.34) Zezinho 2 (0.31) 5 (0.30) 10 (1.03) 3 (0.26) 4 (0.23)
Lila 3 (0.34) 5 (0.13) 8 (1.03) 3 (0.17) 0 (0.00)
Dito-André 6 (0.89) 9 (0.63) 9 (0.77) 5 (0.20) 0 (0.00)
Beto 6 (0.96) 9 (0.50) 7 (1.18) 5 (0.32) 0 (0.00)
Lacerda 4 (0.25) 10 (0.38) 9 (1.46) 0 (0.04)* 0 (0.00)
Godoy 9 (1.00) 6 (0.50) 8 (1.18) 3 (0.43) 0 (0.00)
Nelson 9 (1.69) 8 (0.43) 8 (0.63) 7 (0.54) 0 (0.00) Reizinho 5 (1.43) 6 (0.37) 5 (0.94) 3 (0.29) 0 (0.00) Agostinho 11 (1.40) 3 (0.47) 10 (0.89) 6 (0.23) 0 (0.03)* Reserve A 10 (2.09) 4 (0.23) 7 (1.11) 2 (0.34) 6 (0.23) Reserve B 6 (1.34) 1 (0.27) 8 (1.40) 1 (0.31) 8 (0.51) Reserve C 8 (1.37) 5 (0.23) 10 (1.26) 8 (0.26) 9 (0.17)
TABLE V
Logistic regression between species occurrences according to playback results and to abundance index (IPA) forT. surrucura. “Combination” indicates which survey days (a, b, c, d) were utilized in each test. P: significance level. B0 is the estimated logistic coefficient.
Quantity of survey days Combination Logistic regression
B0 P
1
a –3.40 0.02
b –2.31 <0.01
c –2.25 <0.01
d –3.08 <0.01
2
a+b –2.31 <0.01
a+c –2.51 <0.01
a+d –3.08 <0.01
b+c –6.12 <0.01
b+d –2.51 <0.01
c+d –6.12 <0.01
3
a+b+c –6.12 <0.01
a+b+d –2.31 <0.01
a+c+d –6.12 <0.01
b+c+d –6.12 <0.01
TABLE VI
Pearson correlations coefficients (r2) between the efficiency of the playback and the abundance index values (IPA) for all species and all possible combinations of survey days (a, b, c, d).
Quantity of
Combinations B. leucoble- B. cinerea C. caudata P. leucoptera T. surrucura
survey days pharus
1
a 0.39* 0.03 0.05 0.00 0.26*
b 0.23 0.10 0.08 0.34* 0.38*
c 0.47* 0.05 0.10 0.00 0.36*
d 0.05 0.03 0.01 0.00 0.47*
2
a+b 0.50* 0.16 0.11 0.17 0.49*
a+c 0.61* 0.05 0.00 0.00 0.36*
a+d 0.34* 0.06 0.06 0.00 0.40*
b+c 0.42* 0.16 0.00 0.09 0.57*
b+d 0.16 0.07 0.09 0.15 0.48*
c+d 0.25* 0.07 0.02 0.00 0.52*
3
a+b+c 0.60* 0.14 0.02 0.07 0.54*
a+b+d 0.37* 0.12 0.12 0.08 0.50*
a+c+d 0.48* 0.07 0.00 0.00 0.45*
b+c+d 0.29* 0.12 0.00 0.06 0.57*
4 a+b+c+d 0.47* 0.13 0.03 0.05 0.54*
* P<0.05.
the playback correctly attested the bird presence in-creased with the sampling effort (Fig. 3). For two species, B. leucoblepharus and B. cinerea, maxi-mum success (100% of correct presence detection) was obtained with three survey days. Two days were enough to obtain maximum success forC. caudata.
The remaining two species did not reach 100% of accuracy: the highest success forP. leucopterawas around 95% and forT. surrucuraaround 90%.
DISCUSSION
PLAYBACKDETECTIONEFFICIENCY: TIME OF THE DAY ANDSEASONINFLUENCES
For three species the best periods of the day to conduct playback census were just after sunrise and at noon. This is in compliance with the daily peak of spontaneous activity of some species, such asC.
caudata. This species presents a period of higher
spontaneous activity between sunrise and 15:00, the main period of sexual activity (Foster 1981). Be-cause of the strong vocal interaction of the males,
derived from their complex courting behaviour, in-dividuals shall be more prone to react to intruders (in this case the broadcasted song) during this pe-riod, leading to higher method efficiency.
On the other hand, some passive point counts studies tend to disagree with this result, consider-ing sunrise as the best period for bird surveys, fol-lowed by sunset and at last noon (Järvinen et al. 1977, Robbins 1978, Bibby et al. 1993). G.S. Be-tini (unpublished data) detected thatT. surrucura,
P. leucopteraandBasileuterus culicivorus, a
spe-cies closely related to B. leucoblepharus, were spontaneously more active during early morning in contrast to the rest of the day, when their vocal ac-tivity was lower.
Fig. 3 – Percentages (±SD) of sites where the playback correctly detected the presence of each species according to the number of survey days. Sites where IPA=0.0 were omitted.
the day, in contrast to the census without playback. This was observed forP. leucopteraat the present study and for Dendroica caerulescens in Jamaica (Sliwa and Sherry 1992), which leads to the pattern of no daily variation in bird detection presented by these species. Of course, in this case the playback had also increased the survey period to further than merely sunrise.
playback efficiency may be linked to the reproduc-tive biology of the species. Many authors use the reproductive season to proceed with avifaunal sur-veys (Dawson 1981, Mayfield 1981, Greenwood et al. 1995, Clergeau and Burel 1997, Ratcliffe et al. 1998, Drapeau et al. 2000), when individuals are reinforcing their dominance or establishing new ter-ritories and consequently are more active. For this reason, they may be more prone to confront intrud-ers, increasing the chances of response to playback. However, contrary to the expected, for four of our species there was no seasonal variation in play-back efficiency. Even in non-reproductive months, the birds kept responding with the same intensity to the playback, producing no significant variation in the quantity of contacts along the tested year. This suggests that playback may be used as a sur-vey method for these bird species all year long and not only during the reproductive season. This might be related to the active stimulation of the birds or may come from a strong bond of the individuals to their territories.
PLAYBACKDETECTION EFFICIENCYACCORDING TO BIRDABUNDANCE
Playback was a very efficient technique to detect the presence of these species in all sampled sites where the point counts detected the occurrence of the birds. It incurred in correct presence/absence detection in at least 98% of the studied cases. How-ever, there was not always a direct relationship be-tween the abundance of the birds and the detection efficiency.
ForB. leucoblepharusandT. surrucurathere
was a significant positive relationship between the response rate and IPA, indicating that playback capacity to identify sites where the species is pre-sent increased with the abundance. According to Schieck (1997) vocalizations with frequencies higher than 2 kHz may suffer strong attenuation in the forest. Aubin et al. (2002, 2004) stated that the song of B. leucoblepharusis particularly high-pitched and susceptible to a strong attenua-tion when propagating through dense vegetaattenua-tion. In
those cases, playback will be efficient to identify only close birds, since the playback can only reach nearby individuals. But, even if the song functional structure is preserved (Aubin et al. 2002), allowing birds farther away to recognize their specific vocal-ization, the observer may not have the same ability, decreasing the quantity of contacts proportionally to the abundance.
The significant relationship found forTrogon
surrucurais probably an effect of the rarity of the
species. According to several researchers (Willis 1979, Christiansen and Pitter 1997, Marini 2001, Marsden et al. 2001), trogons are highly affected by patch size, being present only in large fragments or reserves and in low abundance, as detected in the current study (Uezu et al. 2005). Usually, big canopy frugivorous birds are rare and need large areas to search for food (Goerck 1997, Price et. al. 1999). The size of each individual territory was thus presumably large in relation to the distance between sample points. As the abundance increases, territo-ries might overlap or decrease in size (Sherman and Eason 1998) and contact with the birds may become more frequent, increasing detection rates along with the number of present birds in the forest.
On the other hand, there was a lack of corre-lation between the response rate and IPA for three species. In the case ofC. caudata, the lack of
cor-relation may be an effect of the sexual behaviour of the species. Male manakins are constantly engaged in vocal duels for dominance in the hierarchy of the group (Foster 1981) and present a natural aggres-sive behaviour that makes the individuals extremely responsive, increasing the detection rate after play-back. So, even in low abundance sites, the quantity of contacts shall be high.
ForB. cinerea, the lack of correlation was not
and respond to the broadcasted song even if they are further than 100 m from the sound source. Be-cause of that, even in places with low abundance, it is possible to locate distant individuals, creating the non-correlation pattern.
In the case ofP. leucopterano results pointed out to any clear cause to the lack of correlation be-tween detection efficiency and abundance. The de-tected pattern of response may be related not only to bird abundance. For instance, if for any reason the access to food resources decline at a certain site, individual birds may tend to become more aggres-sive in order to defend their territories (Armstrong 1991, Carrascal et al. 1998) and therefore more re-sponsive to playback. In places of higher resource availability, even if the species is more abundant, there is no need to defend each territory so strongly and the response rate may then decrease. Therefore, the abundance of a species did not appear to be the sole or main factor to influence the occurrence de-tection efficiency of these birds. According to each species, other factors may modify this relationship.
EFFECTS OFSAMPLINGEFFORT
According to Bibby et al. (2000) the chances of detecting new individuals should increase along with the sample effort, independently of the sam-pling method. That was the case for all species, since the proportion of correct presence detection through playback increased continuously with the number of survey days. The main question here is how large should the sampling effort be to obtain an accurate incidence data set, without wasting more time than necessary at a single site, in order to be able to quickly sample a large number of sites? Con-sidering a confidence threshold of 90%, one visit was enough to accurately detectC. caudata, while two visits were necessary forB. leucoblepharusand
B. cinerea, and three forP. leucoptera. ForT.
sur-rucura, four visits were necessary to obtain a
con-fidence value close to 90%. For a concon-fidence of 100%, two visits were necessary forC. caudataand three forB. leucoblepharusandB. cinerea. In the
case ofP. leucopteraandT. surrucura, the
propor-tion of correct detecpropor-tion did not reach 100% after four visits due to fragments with very low abun-dance. There was a threshold of approximately 0.05 of IPA, below which the bird detection through playback is improbable for a sampling effort of four days. An increase of the sampling effort could solve this problem.
CONCLUSION
The results of the present study pointed out to a large variation in Atlantic Forest bird species re-sponse to playback and to the importance of method-ological studies in order to standardize census meth-ods. Future researchers should try to understand each species behaviour before applying the method. If known, the latency time and the variation of play-back responses according to the time of the day, season of the year, abundance and sampling effort could help to reduce the problem of “false absence” detections and maximize the efficiency of the play-back to collect occurrence data, assuring good re-sults for quick access surveys.
When compared to passive methods, the play-back expanded the favourable time to conduct avi-faunal surveys for these Atlantic Forest birds from the first hours of the day to the entire morning, up to noon. Also the season of the year is not an im-pediment to census these birds with playback. Four of the five studied species might be surveyed with the same efficiency of detection all year long. Bar-ring when the abundance is too low, the playback technique can detect with only three survey days per site the occurrence pattern of these birds as ac-curately as the passive point counts. These patterns may also be applied to other bird species not studied in the present work.
ACKNOWLEDGMENTS
This research was part of the thematic project
“Biodiversity conservation in fragmented
land-scapes at the Atlantic Plateau of São Paulo” and was
da Biodiversidade da Fundação de Amparo à Pes-quisa do Estado de São Paulo (BIOTA-FAPESP) (n. 99/05123-4; master fellowship for DB n. 00/01358-6). We would like to thank Ilse Storch, Wesley R. Silva and José Carlos Motta Jr who re-viewed previous versions of this manuscript and José Roberto Nali along with all the staff from Com-panhia de Saneamento Básico do Estado de São Paulo (SABESP) and the Morro Grande Forest Reserve for their hospitality and support.
RESUMO
A técnica de play-back é muito útil para a detecção de aves, mas este método geralmente não é padronizado. Sua eficiência em atestar a ocorrência de cinco espécies de aves da Mata Atlântica (Pula-pula-assobiador Basileute-rus leucoblephaBasileute-rus, BataráBatara cinerea, Tangará Chi-roxiphia caudata, Olho-de-fogoPyriglena leucopterae Surucuá-de-barriga-vermelhaTrogon surrucura) foi ana-lisada de acordo com o horário do dia, estação do ano e abundância das espécies na Reserva Florestal do Morro Grande (São Paulo, Brasil) e em treze fragmentos flo-restais de uma paisagem adjacente. Gravações das vo-calizações foram emitidas mensalmente ao amanhecer, meio do dia e entardecer, durante um ano. ParaB. leu-coblepharus,C. caudataeT. surrucura, o amanhecer e o meio do dia apresentaram-se mais eficientes que o entar-decer. Batara cinereaapresentou maior eficiência de ju-lho a outubro. O uso do play-back aumentou o período de maior eficiência dos levantamentos de aves em matas tropicais, comumente restrito ao período da manhã du-rante a estação reprodutiva. A técnica utilizada foi efi-ciente na detecção da ocorrência de todas as espécies, salvo quando sua abundância se apresentou muito baixa. Porém, apenas B. leucoblepharuse T. surrucura apre-sentaram abundância significativa e positivamente rela-cionada com essa eficiência. O presente estudo propor-ciona uma indicação precisa sobre o melhor horário do dia e época do ano, assim como um intervalo de confiança, com o intuito de aumentar a eficiência do play-back em detectar a ocorrência dessas espécies.
Palavras-chave: play-back, aves, fragmentos florestais, desenvolvimento metodológico, Mata Atlântica, Estado de São Paulo.
REFERENCES
ARMSTRONG DP. 1991. Aggressiveness of breeding territorial honeyeaters corresponds to seasonal changes in nectar availability. Behav Ecol Sociobiol 29: 103–111.
AUBINT, MATHEVONN, VIELLIARDJMEANDSILVA ML. 2002. How an inadequate acoustic signal suc-ceeds in the extreme environment of a tropical for-est? The song of the White-browed Warbler. Beijing, China: Abstracts XXIII Int Ornith Congr.
AUBINT, MATHEVONN, SILVAML, VIELLIARDJME ANDSEBEF. 2004. How a simple and stereotyped acoustic signal transmits individual information: the song of the White-browed WarblerBasileuterus leu-coblepharus. An Acad Bras Cienc 76: 335–344. BIBBYCJ, BURGESSNDANDHILLDA. 1993. Bird
Census Techniques. San Diego: Academic Press. BIBBY CJ, BURGESSND, HILL DA AND MUSTOE
SH. 2000. Bird Census Techniques. 2nd ed., San Diego: Academic Press.
BLONDEL J, FERRYC AND FROCHOT B. 1970. La méthode des indices ponctuels d’abondance (I.P.A.) ou des relevés d’avifaune par “stations d’écoute”. Alauda 38: 55–71.
CARRASCAL LM, SENAR JC, MOSETICH I, URIBE F AND DOMENECH J. 1998. Interactions among environmental stress, body condition, nutritional sta-tus, and dominance in Great Tits. Auk 115: 727–738. CATCHPOLECKANDSLATERPJB. 1995. Bird Song: Biological themes and variations. Cambridge: Cam-bridge University Press.
CHRISTIANSEN MM ANDPITTER E. 1997. Species loss in a forest bird community near Lagoa Santa in Southeastern Brazil. Biol Conserv 80: 23–32. CLERGEAUPANDBURELF. 1997. The role of
spatio-temporal patch connectivity at the landscape level: an example in a bird distribution. Landscape and Urban Planning 38: 37–43.
DAWSONDG. 1981. Counting birds for a relative mea-sure (index) of density. In: RALPHCJANDSCOTT JM (Eds), Estimating the numbers of terrestrial birds. Studies in Avian Biology 6: 12–16.
com-munities of boreal mixed-wood forests. Ecol Monogr 70: 423–444.
FOSTERMS. 1981. Cooperative behaviour and social organization of the Swallow-tailed Manakin ( Chiro-xiphia caudata). Behav Ecol Sociobiol 9: 167–177. GLAHN JF. 1974. Study of breeding rails with rec-orded calls in north-central Colorado. Wilson Bull 86: 206–214.
GOERCKJM. 1997. Patterns of rarity in the birds of the Atlantic Forest of Brazil. Conserv Biol 11: 112–118. GREENWOOD JJD, BAILLIE SR, GREGORY RD, PEACH WJ AND FULLER RJ. 1995. Some new approaches to conservation monitoring of British breeding birds. Ibis 137: 16–28.
HANSKI I. 1994. Patch-occupancy dynamics in frag-mented landscapes. Trends Ecol Evol 9: 131–135. JÄRVINEN O, VÄISÄNEN RA AND HAILA Y. 1977.
Bird census results in different years, stages of the breeding season and times of the day. Ornis Fennica 54: 108–118.
JOHNSON RRANDDINSMORE JJ. 1986. The use of tape-recorded calls to count Virginia Rails and Soras. Wilson Bull 98: 303–306.
JOHNSONRR, BROWNBT, HAIGHTLTANDSIMPSON JM. 1981. Playback recording as a special avian censusing technique. In: RALPHCJ ANDSCOTT JM (Eds), Estimating the numbers of terrestrial birds. Studies in Avian Biology 6: 68–75.
KAUFMANNGW. 1988. The usefulness of taped Spot-less Crake calls as a census technique. Wilson Bull 100: 682–686.
KÖPPEN W. 1948. Climatologia. Mexico City: Ed Fondo Cultura Economica.
LINDENMAYERDB, MCCARTHYMAANDPOPEML. 1999. Arboreal marsupial incidence in eucalypt patches in south-eastern Australia: a test of Hans-ki’s incidence function metapopulation for patch occupancy. Oikos 84: 99–109.
MARINIMA. 2001. Effects of forest fragmentation on birds of the cerrado region, Brazil. Bird Conserv Intern 11: 13–25.
MARSDEN SJ, WHIFFINM ANDGALETTIM. 2001. Bird diversity and abundance in forest fragments and Eucalyptus plantations around an Atlantic forest re-serve, Brazil. Biodiv Conserv 10: 737–751.
MAYFIELDHF. 1981. Problems in estimating population size through counts of singing males. In: RALPHCJ ANDSCOTTJM (Eds), Estimating the numbers of terrestrial birds. Studies in Avian Biology 6: 220– 224.
METZGERJP (Coord). 2003. Biodiversity conserva-tion in fragmented landscapes at the Atlantic Plateau of São Paulo. São Paulo: Scientific report to the BIOTA-FAPESP program.
MILLIGANM. 1966. Vocal responses of White-crowned Sparrows to recorded songs of their own and another species. Anim Behav 14: 356–361.
MØLLERAP. 1992. Interspecific response to playback of bird song. Ethology 90: 315–320.
MORRELL TE, YAHNER RH AND HARKNESS WL. 1991. Factors affecting detection of Great Horned Owls by using broadcast vocalizations. Wildlife Soc Bull 19: 481–488.
MOSHERJAANDFULLERMR. 1996. Surveying wood-land hawks with broadcasts of Great Horned Owl vocalizations. Wildlife Soc Bull 24: 531–536. MOSHER JA, FULLER MR AND KOPENY M. 1990.
Surveying woodland raptors by broadcast of conspe-cific vocalizations. J Field Ornith 61: 453–461. PRICE OF, WOINARSKIJZANDROBINSOND. 1999.
Very large area requirements for frugivorous birds in monsoon rainforests of the Northern Territory, Australia. Biol Conserv 91: 169–180.
RATCLIFFE N, VUGHAN D, WHYTE C AND SHEP -HERDM. 1998. Development of playback census methods for Storm Petrels Hydrobates pelagicus. Bird Study 45: 302–312.
ROBBINSCS. 1978. Census techniques for forest birds. In: DEGRAEDRM (Ed), Management of southern forest for nongame birds. Atlanta: USDA General Technical Report SE-GTR 14: 142–163.
ROSENFIELD RN, BIELEFELDT J, ANDERSON RK ANDSMITH WA. 1985. Taped calls as an aid in locating Cooper’s Hawk nests. Wildlife Soc Bull 13: 62–63.
ROSS JLS ANDMOROZ IC. 1997. Mapa Geomorfo-lógico do Estado de São Paulo, escala 1:500.000. Volume 1. São Paulo: Universidade de São Paulo. SCHIECK J. 1997. Biased detection of bird
SHERMAN PTAND EASON PK. 1998. Size determi-nants in territories with inflexible boundaries: ma-nipulation experiments on White-winged Trumpe-ters’ territories. Ecology 79: 1147–1159.
SICKH. 1997. Ornitologia Brasileira. Rio de Janeiro: Editora Nova Fronteira.
SLIWA A AND SHERRY TW. 1992. Surveying win-tering warbler populations in Jamaica: point counts with and without broadcast vocalizations. Condor 94: 924–936.
STOTZ DF, FITZPATRICK JM, PARKER III TA AND MOSKOVITSDK. 1996. Neotropical birds. Ecology and conservation. Chicago: University of Chicago Press.
SWIFTBL, ORMANSRANDOZARDJW. 1988. Re-sponse of Least Bitterns to tape-recorded calls. Wil-son Bull 100: 496–499.
THOMPSONWL. 2002. Towards reliable bird surveys: accounting for individuals present but not detected. Auk 119: 18–25.
UEZUA, METZGERJPANDVIELLIARD JME. 2005. Effects of structural and functional connectivity and patch size on the abundance of seven Atlantic Forest bird species. Biol Conserv 123: 507–519.
VELOSOHP, RANGELFILHOALRANDLIMAJCA. 1991. Classificação da vegetação brasileira adap-tada a um sistema universal. Rio de Janeiro: IBGE. VIELLIARDJANDSILVAWR. 1990. Nova
metodolo-gia de levantamento quantitativo da avifauna e pri-meiros resultados do interior do Estado de São Pau-lo, Brasil. In: IV ENCONTRONACIONAL DEANI -LHADORES DEAVES, Recife. Universidade Federal Rural de Pernambuco, PE, Brasil, p. 117–151. WILLISEO. 1979. The composition of avian
communi-ties in three remanescent woodlots in southern Brazil. Papéis Avuls Zool 33: 1–25.