Milk quality according to the daily range in farm production in the Mesoregion Central
Mineira and Oeste of Minas Gerais regions, Brazil
[Perfil da qualidade do leite de acordo com a faixa de produção diária da propriedade leiteira nas mesorregiões Central Mineira e do Oeste de Minas Gerais, Brasil]
L.R. Borges1, L.M. Fonseca2*, R.T. Martins2, M.C.P.P. Oliveira1
1Aluno de pós-graduação Escola de Veterinária Universidade Federal de Minas Gerais Belo Horizonte, MG 2Escola de Veterinária Universidade Federal de Minas Gerais Belo Horizonte, MG
ABSTRACT
The objective of this work was to characterize milk production from the Central Mineira and Oeste Mesoregions regions in Minas Gerais State, Brazil, according to quality parameters such as somatic cell count, total bacteria count, and composition for specific production ranges. Average results for milk fat, protein, total and nonfat solids were compliant with Brazilian legal requirements (IN-62/2011) in all the production ranges selected. Average somatic cell counts (SCC) complied with the legal requirements of 600,000 cells/mL, except for the range with a daily production above 1,000 liters. However, average maximum values of 400,000 cells/mL are recommended for good milk quality. Total bacterial count was the most critical quality factor, with the highest values found in breeds with milk production above 500 liters per day.
Keywords: milk quality, somatic cell count, total bacterial count, Central Mineira mesoregion
RESUMO
O presente trabalho teve por objetivo caracterizar a produção de leite nas mesorregiões Central Mineira e do Oeste de Minas do estado de Minas Gerais, quanto à contagem de células somáticas, à contagem bacteriana total e à composição, em diferentes faixas de produção. Os teores de gordura, proteína, sólidos totais e extrato seco desengordurado apresentaram valores médios dentro do limite estabelecido pela Instrução Normativa n°62 (IN-62/2011), em todas as faixas específicas de produção estipuladas no presente trabalho. Os valores de contagem de células somáticas (CCS) também se mostraram dentro do limite legalmente estabelecido de 600.000 células/mL, exceto na faixa de produção acima de 1.000L/dia. Entretanto, valores abaixo de 400.000 células/mL são recomendados para um leite de boa qualidade. A contagem bacteriana total foi o fator de qualidade mais crítico. Os valores médios de contagem bacteriana ultrapassaram o limite atualmente preconizado, e rebanhos com volume diário acima de 500 litros por dia foram os que apresentaram maior número de resultados que não estão em conformidade com os padrões legais.
Palavras-chave: qualidade do leite, contagem de células somáticas, contagem bacteriana total, mesorregião Central Mineira
INTRODUCTION
Somatic cell count is an essential quality parameter for milk, and is mainly influenced by intramammary gland infection (Harmon, 1997), which prevalence is related to factors such as
Recebido em 4 de março de 2012
Aceito em 6 de março de 2013
*Autor para correspondência (corresponding author) E-mail: leorges@ufmg.br
season, breed, feeding system, and lactation stage, among others (Teixeira et al., 2003).
shown the need for milk quality improvement to attend the new legal requirements being implanted in Brazil.
Fonseca (2005) evaluated 50,434 bulk tank milk samples from Minas Gerais State, from December, 2003 to January, 2005. Milk quality was correlated to seasonal variations, with geometric means for bacterial counting ranging from 63,000 CFU/mL in the winter (dry season) to 398,000 CFU/mL in the summer (rainy season). Higher somatic cell counts were found during the summer season. Fat and protein content reached higher values during the winter season, respectively 3.88g/100g and 3.30g/100g, when total milk production was lower.
Lima (2007) evaluated raw milk samples from farms located in the Zona da Mata region, Minas Gerais State, according to the legal parameters established in the Brazilian legal requirements at that time (IN-51/2002), during the summer of
2006. The total bacterial count was the parameter with highest occurrence of deviation from the limits. This fact indicates that low milk quality was related to low hygiene during milking.
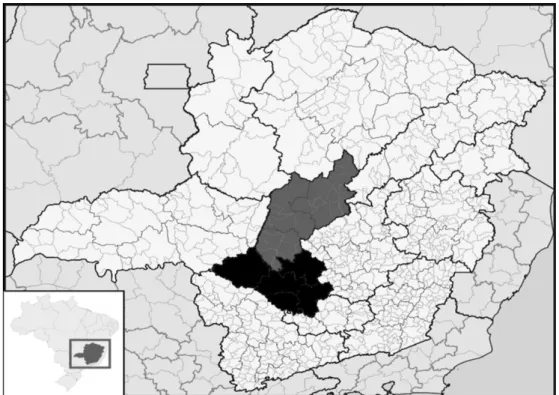
The Central Mineira and Oeste of Minas mesoregions are important milk producing regions in Minas Gerais State, Brazil, with a settlement of several important dairy industries (FAEMG, 2006) (Figure 1). Raw milk collected in these regions supplies dairies for cheese, dry milk, yogurt, milk beverages, dessert cream, pasteurized and UHT milk production. The monitoring of milk quality in the farms in these regions is being done by the Rede Brasileira de Laboratórios de Análise da Qualidade do Leite (RBQL) accredited by the Brazilian Ministry of Agriculture. Basic requirements for monitoring include analysis screening for bacterial count, somatic cell count, and components, among other analyses.
Figure 1. Location of Central Mineira (gray) and Oeste de Minas (black) regions in Minas Gerais State, Brazil
Due to the importance of hygienic milk
MATERIAL AND METHODS
During the months of August and September of 2009, 715 farms in Central Mineira and Oeste de Minas regions of Minas Gerais State, Brazil were randomly chosen, mapped using GPS, and the average daily production was recorded. Farms were classified according to the following ranges of milk production: 1-100L/day, 101-200L/day, 201-500L/day, 501-1,000L/day, and above 1,000L/day. From these farms, 183 were randomly chosen in the cities of Bom Despacho, Luz, Dores do Indaiá, Martinho Campos, Bambuí, Córrego Dantas, Serra da Saudade, Esteios, Lagoa da Prata, and Moema, and for each farm, one milk sample was collected, and weighted averages for SCC and TBC were calculated. Weighted averages were initially compared to the legal standard accepted at the collecting time in Brazil (Brazil, 2002), however, as the standard issued in 2002 was replaced by a new regulation, IN 62/2011 (Brazil, 2011), data were further compared to the new limit of 600,000 somatic cells/mL and 600,000 CFU/mL of mesophilic aerobic microorganisms.
Each milk sample was split into two aliquots, one for total bacteria count, preserved with azidiol, and another for component measurement and somatic cell count, preserved with bronopol. Both samples were stored under 5oC, without
freezing, for a maximum period of four days. Total bacteria counts were determined by flow cytometry using a Bactocount IBC 150®
(Bentley Instruments Incorporated, Chaska, USA) (BENTLEY..., 2002). Milk composition (fat, protein, lactose, total and nonfat solids), and somatic cell counts were determined by, respectively, spectroscopy and flow cytometry, using a Bentley Combi System 2300® (Bentley
Instruments Incorporated, Chaska, EUA) (BENTLEY..., 1998).
Variance analysis was done for the experimental groups, using a completely randomized design, and the least significant difference was determined by the Duncan Test (p<0.05).
RESULTS AND DISCUSSION
Milk production and profile of the evaluated farms in the Central Mineira and Oeste de Minas mesoregions of Minas Gerais, Brazil are summarized in Table 1 and 2. Table 1 shows the amount of produced milk for each region, according to specific daily production ranges, and Table 2 shows the number of evaluated farms in each region, according to daily milk production ranges.
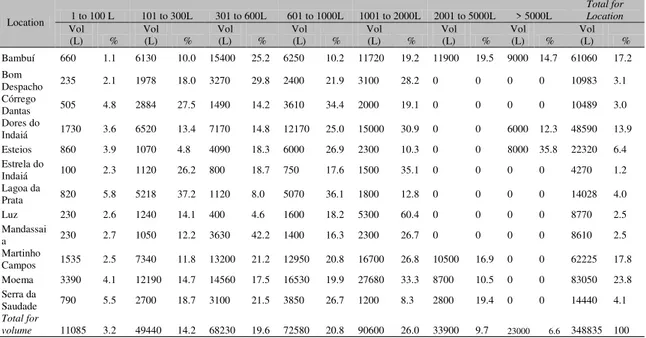
Based on the total milk volume in the selected farms, a major fraction (26.0%) corresponds to farms with a daily production range of 1001 to 2000L, although the number of farms for this range represents only 8.5% of the total. Conversely, 32.3% of the farms with daily milk production of 101 to 300L correspond to only 14.2% of the total volume of milk. The same trend is found in the production range of 1 to 300L/day, which represents 55.9% of the producers, but only 17.4% of the total volume of milk for the mapped farms. The farms with lowest milk production range, 1-100L/day, presented the highest discrepancy with 23.6% of the 715 farms, and only 3.2% of the total volume of milk. In the highest production range, i.e., above 5,000L/day, three farms (0.4%) accounted for 6.6% of the total volume of milk. These ranges show the scattering of production in the lower milk production range.
Data obtained in Minas Gerais indicate that there is a similar profile for the milk producers of the State. For example, farms with production higher than 1,000 liters/day represented 2.6% of the dairy farms, but milk production corresponding to 29% of the total milk production of the State. Conversely, small production farms, with less than 50 liters of milk/day, represented 44.0% of the dairy farms, but with only 8% of milk production (FAEMG, 2006).
Table 1. Milk volume collection according to daily production in farms located in Central Mineira and Oeste of Minas mesoregions in Minas Gerais, Brazil (n = 715)
Location 1 to 100 L 101 to 300L 301 to 600L 601 to 1000L 1001 to 2000L 2001 to 5000L > 5000L
Total for Location
Vol
(L) % Vol (L) % Vol (L) % Vol (L) % Vol (L) % Vol (L) % Vol (L) % Vol (L) %
Bambuí 660 1.1 6130 10.0 15400 25.2 6250 10.2 11720 19.2 11900 19.5 9000 14.7 61060 17.2
Bom
Despacho 235 2.1 1978 18.0 3270 29.8 2400 21.9 3100 28.2 0 0 0 0 10983 3.1
Córrego
Dantas 505 4.8 2884 27.5 1490 14.2 3610 34.4 2000 19.1 0 0 0 0 10489 3.0
Dores do
Indaiá 1730 3.6 6520 13.4 7170 14.8 12170 25.0 15000 30.9 0 0 6000 12.3 48590 13.9
Esteios 860 3.9 1070 4.8 4090 18.3 6000 26.9 2300 10.3 0 0 8000 35.8 22320 6.4
Estrela do
Indaiá 100 2.3 1120 26.2 800 18.7 750 17.6 1500 35.1 0 0 0 0 4270 1.2
Lagoa da
Prata 820 5.8 5218 37.2 1120 8.0 5070 36.1 1800 12.8 0 0 0 0 14028 4.0
Luz 230 2.6 1240 14.1 400 4.6 1600 18.2 5300 60.4 0 0 0 0 8770 2.5
Mandassai
a 230 2.7 1050 12.2 3630 42.2 1400 16.3 2300 26.7 0 0 0 0 8610 2.5
Martinho
Campos 1535 2.5 7340 11.8 13200 21.2 12950 20.8 16700 26.8 10500 16.9 0 0 62225 17.8
Moema 3390 4.1 12190 14.7 14560 17.5 16530 19.9 27680 33.3 8700 10.5 0 0 83050 23.8
Serra da
Saudade 790 5.5 2700 18.7 3100 21.5 3850 26.7 1200 8.3 2800 19.4 0 0 14440 4.1
Total for
volume 11085 3.2 49440 14.2 68230 19.6 72580 20.8 90600 26.0 33900 9.7 23000 6.6 348835 100
Table 2. Classification of farms in the Central Mineira and Oeste of Minas mesoregions in Minas Gerais, Brazil, according to location and daily milk production (n = 715)
Location 1 to 100 L
101 to 300 L
301 to 600 L
601 to 1000 L
1001 to 2000 L
2001 to 5000 L
>5000 L
Total for Location
N % N % N % N % N % N % N % N %
Bambuí 8 9.4 24 28.2 32 37.6 8 9.4 8 9.4 4 4.7 1 1.2 85 11.9
Bom Despacho 3 12.0 10 40.0 7 28.0 3 12.0 2 8.0 0 0 0 0 25 3.5
Córrego Dantas 8 26.7 13 43.3 4 13.3 4 13.3 1 3.3 0 0 0 0 30 4.2
Dores do Indaiá 27 26.2 34 33.0 17 16.5 15 14.6 9 8.7 0 0 1 1.0 103 14.4
Esteios 11 28.9 7 18.4 10 26.3 7 18.4 2 5.3 0 0 1 2.6 38 5.3
Estrela do Indaiá 1 10.0 5 50.0 2 20.0 1 10.0 1 10.0 0 0 0 0 10 1.4
Lagoa da Prata 11 25.6 22 51.2 3 7.0 6 14.0 1 2.3 0 0 0 0 43 6.0
Luz 3 18.8 6 37.5 1 6.3 2 12.5 4 25.0 0 0 0 0 16 2.2
Mandassaia 3 15.8 5 26.3 7 36.8 2 10.5 2 10.5 0 0 0 0 19 2.7
Martinho Campos 24 20.3 35 29.7 29 24.6 15 12.7 11 9.3 4 3.4 0 0 118 16.5
Moema 57 30.2 58 30.7 32 16.9 20 10.6 19 10.1 3 1.6 0 0 189 26.4
Serra da Saudade 13 33.3 12 30.8 7 17.9 5 12.8 1 2.6 1 2.6 0 0 39 5.5
Total for volume of
milk daily prod. 169 23.6 231 32.3 151 21.1 88 12.3 61 8.5 12 1.7 3 0.4 715 100
Table 3. Composition and Fat/Protein ratio (F/P) of bulk tank milk samples collected during August and September, 2009 in the Central Mineira and Oeste of Minas mesoregions in Minas Gerais, Brazil (n = 183)
Production
(L/day) N Fat (g/100g) Protein (g/100g) Lactose (g/100g) Total Solids (g/100g) Non Fat Solids (g/100g) F/P
<100 30 3.89b 3.00a 4.47b 12.43b 8.53a 1.25a
101-200 67 3.65a,b 3.05a 4.43a,b 12.09a,b 8.43a 1.20a
201-500 70 3.65a,b 3.09a 4.47b 12.17a,b 8.52a 1.18a
501-1,000 11 3.58a 2.99a 4.45a,b 11.97a 8.40a 1.18a
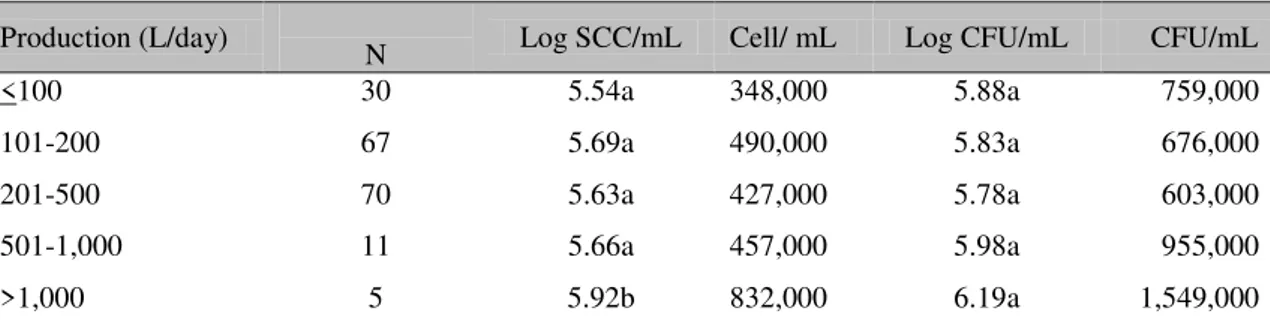
Table 4. Somatic cell count (SCC), and total bacterial count (TBC) of bulk tank milk samples collected during August and September, 2009 in the Central Mineira and Oeste of Minas mesoregions in Minas Gerais, Brazil (n = 183)
Production (L/day) N Log SCC/mL Cell/ mL Log CFU/mL CFU/mL
<100 30 5.54a 348,000 5.88a 759,000
101-200 67 5.69a 490,000 5.83a 676,000
201-500 70 5.63a 427,000 5.78a 603,000
501-1,000 11 5.66a 457,000 5.98a 955,000
>1,000 5 5.92b 832,000 6.19a 1,549,000
*results with different letters in the same column are different (p<0.05)
Milk fat content was lower in farms with production of 501 to 1,000L/day, when compared to farms with daily milk production of up to 100L or more than 1,000L. According to Gibson (1991), Palmquist et al. (1993), and Ashes et al. (1997) nutrition and genetics are important factors for milk fat composition. The predominant breed for the farms under this study was Holstein-Zebu crossbred (Freitas et al., 2001; Matos et al., 1997). Another important factor is that the sample collection occurred in the final months of the winter season, and the type of feeding may affect the composition, mainly because natural pasture is scarce (Alves, 2006). There was no significant difference (p>0.05) for protein content among the production ranges.
However, lactose content was significantly different among specific production ranges, with lower lactose content being correlated with higher somatic cell counts. Samples collected from farms with milk production higher than 1,000L/day had lower lactose content, while higher concentrations were found in farms with up to 100L/day, and from 201 to 500L/day. These findings are highly correlated with somatic cell counts, similar to previous reports (Alves, 2006; Fonseca, 2005).
Total milk solids and fat content had similar variation for the several production ranges. Farms with production of 501 to 1,000L/day presented lower solid contents when compared to the farms with production of up to 100L/day and
more than 1,000L/day. Similar correlations between total solids and fat content in milk were found by Fonseca (2005). Although lactose is the solid component with the highest concentration, its correlation with total solids is low, since lactose concentration is quite stable in milk (Harding 1995; Davis et al., 1999). Nonfat solid concentrations were similar among the several production ranges (p>0.05). Average values for fat and protein content were in compliance with the legal requirements established by Brazilian Normative n°62/2011.
Total bacterial counts are correlated with milk hygiene during milking, transportation and storage (Gunasekera et al, 2000; Suhren and Walte, 2000; Gunasekera et al, 2003). Results showed no variation among the specific ranges of daily milk production. However, the total bacterial count averages were high for all production ranges. These findings reflect a high contamination of the milk, which should not be higher than 300,000 CFU/mL (FDA, 2011; Brasil, 2011). Moreover, these values were found in the winter, when lower counts are expected, as compared to the summer (Roma Júnior et al., 2009; Smith et al., 1985).
The contribution of somatic cells and bacteria counts according to the several ranges of daily milk production are in Table 5. Basically, these data were calculated based on the weighted
average values for SCC and TBC in each production range, compared to the total collected volume for all the production ranges.
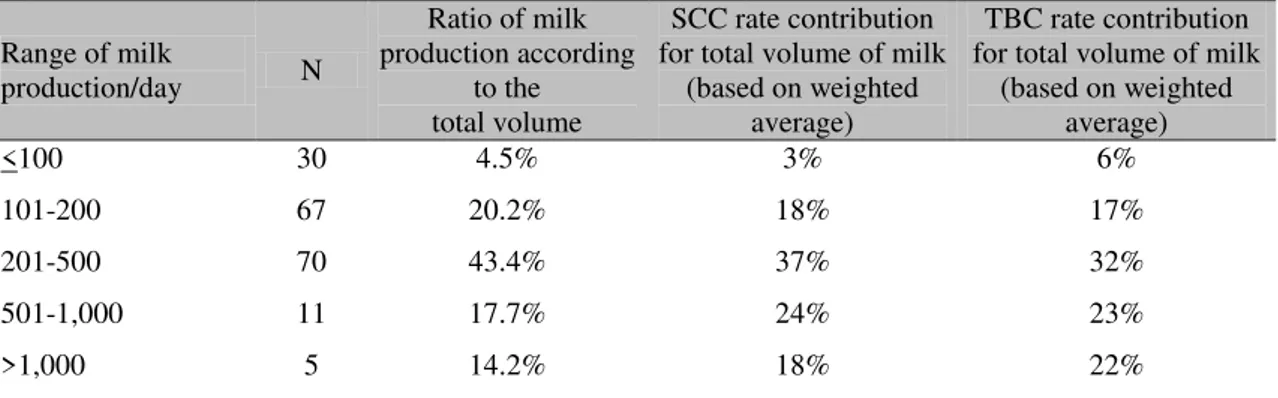
Table 5. Volume, weighted somatic cell count (SCC), and weighted total bacterial count (TBC) of milk for different ranges of daily milk production compared to the total volume collected, during August and September, in the Central Mineira and Oeste of Minas mesoregions in Minas Gerais, Brazil (n = 183)
Range of milk
production/day N
Ratio of milk production according
to the total volume
SCC rate contribution for total volume of milk
(based on weighted average)
TBC rate contribution for total volume of milk
(based on weighted average)
<100 30 4.5% 3% 6%
101-200 67 20.2% 18% 17%
201-500 70 43.4% 37% 32%
501-1,000 11 17.7% 24% 23%
>1,000 5 14.2% 18% 22%
Based on weighted averages, SCC and TBC contributions for specific ranges are expected to be similar to the ratio values of range volume to the total volume of milk, since these values would be representative of weighted mean values for SCC and TBC. Consequently, lower values for SCC and/or TBC contribution rates indicate better results for each parameter, according to the specific milk range production. For example, the first production range (less than 100 liters/day) had a higher TBC influence than the expected rate based on the volume of milk produced in this range, compared to the total volume. Conversely, farms in the milk production ranges above 500 liters per day had higher SCC and TBC rate values than the expected based on the volume contribution of these ranges. This fact might indicate a greater occurrence of mastitis in breeds for these production ranges, along with possible inappropriate milking management, storage and cleaning, and might be a good index indicator for the establishment of strategic assistance.
CONCLUSIONS
The compositional analysis of the milk produced in the evaluated region showed that average values of fat and protein for the specific ranges
of daily milk production were in compliance with Brazilian requirements established in the IN 62/2011, i.e., a minimum of, respectively, 3.0g/100g and 2.9g/100g of milk. Average values for nonfat solids in the different ranges were close to the legal requirement limit, indicating that this component requires more attention from the dairy sector. Although the regional averages for somatic cell count values were below the legal limit, i.e, maximum of 600,000/mL, except for one range of daily milk production, milk quality needs to be improved, since the average values were above the recommended parameters for good milk quality, and several farm samples were not in compliance with legal parameters. The total bacterial count was the quality parameter with the highest occurrence of non-compliant samples with legal requirements, i.e., maximum of 600,000 CFU/mL, mainly in the higher volume production range. This may indicate deficiencies in the hygienic milking practices, refrigeration of milk and/or cleaning of milking equipment and utensils.
ACKNOWLEDGEMENTS
REFERENCES
ALVES, C. Efeito de variações sazonais na qualidade do leite cru refrigerado de duas propriedades de Minas Gerais. 2006. 64f. Dissertação (Mestrado em Medicina Veterinária). Escola de Veterinária, Universidade Federal de Minas Gerais, Belo Horizonte, MG. ASHES, J.R.; GULATI, S.K.; SCOTT, T.W. Potential to alter the content and composition of milk fat through nutrition. J. Dairy Sci., v.80, p.2204-2212, 1997.
BENTLEY INSTRUMENTS INC. Bentley 2000 operator´s manual. Chaska: Bentley Instruments Inc., 1998. 79p.
BENTLEY INSTRUMENTS INC. Bactocount 150 operator´s manual. Chaska: Bentley Instruments Inc., 2002. 49p.
BRASIL, Ministério de Agricultura Pecuária e Abastecimento (MAPA). Instrução Normativa nº 51 de 18/09/2002. Anexo IV – Regulamento Técnico de Identidade e Qualidade de leite cru Refrigerado. Diário Oficial da União, Brasília, Distrito Federal, 20 de Setembro de 2002. Seção I, p.13 a 22.
BRASIL, Ministério de Agricultura Pecuária e Abastecimento (MAPA). Instrução Normativa nº 62 de 29/12/2011. Instrução Normativa n.62, de 29 de dezembro de 2011. Diário Oficial da União, Brasília, Distrito Federal, 30 de dezembro de 2011. Seção 1.
DAVIS, S.R., FARR, V.C., STELWAGEN, K. Regulation of yield loss and milk composition during once-daily milking: a review. Livestock production science, n.59, p.77-94, 1999.
FAEMG. Diagnóstico da Pecuária Leiteira do Estado de Minas Gerais em 2005. Belo Horizonte: FAEMG, 2006. 156 p.
FDA, US Food and Drug Administration. Grade A pasteurized milk ordinance, 2011 revision. Washington, D.C.: FDA, 2011. 388p.
FONSECA, C.S.P. Qualidade do leite cru de tanques refrigeradores em Minas Gerais. 2005. 62f. Dissertação (Mestrado em Medicina Veterinária). Escola de Veterinária, Universidade Federal de Minas Gerais, Belo Horizonte, MG.
FREITAS, M.S.; DURÃES, M.C.; FREITAS, A.F.. BARRA, R.B. Comparação da produção de leite e de gordura e da duração da lactação
entre cinco “graus de sangue” originados de
cruzamentos entre Holandês e Gir em Minas Gerais. Arq. Bras. Med. Vet. Zootec.,v.53, p.708-713, 2001.
GIBSON, J.P. The potential for genetic change in milk fat composition. J. Dairy Sci., v.74, p.3258-3266, 1991.
GUNASEKERA, T.S.; VEAL, D.A.;
ATTFIELD, P.V. Potential for broad applications of flow cytometry and fluorescence techniques in microbiological and somatic cell analyses of milk. Int. J. Food Microbiol., v.85, p.269-279, 2003.
GUNASEKERA, T.S; ATTFIELD, P.V.; VEAL, D.A. A flow cytometry method for rapid detection and enumeration of total bacteria in milk. Appl. Environ. Microbiol., v.66, p.1228-1232, 2000.
HARDING, F. Milk quality. New York: Blackie Academic & Professional, 1995. 165p.
HARMON, R.J. Physiology of mastitis and factors affecting somatic cell counts., J Dairy Sci., v.77, p.2103-2112, 1994.
LIMA, L.L. Características de produção e qualidade do leite cru captado por usinas de leite na Zona da Mata de Minas Gerais. 2007. 52f. Dissertação (Mestrado em Medicina Veterinária). Escola de Veterinária, Universidade Federal de Minas Gerais, Belo Horizonte, MG. MATOS, R.S.; RORATO, P.R.N.; FERREIRA, G.B.; RIGON, J.L. Estudo dos efeitos genéticos e de meio ambiente sobre a produção de leite e gordura da raça Holandês no Estado do Rio Grande do Sul. Cienc. Rural, v.27, p.465-471, 1997.
PALMQUIST, D.L.; BEAULIEU, A.D.; BARBANO, D.M. Feed and animal factors influencing milk fat composition. J. Dairy Sci., v.76, p.1753-1771, 1993.
SMITH, K.L.; TODHUNTER, D.A.; SCHOENBERGER, P.S. Environmental mastitis: cause, prevalence, prevention. J. Dairy Sci., v.68, p.1531-1553, 1985.
SUHREN, G.; WALTE, H.G. First experiences with automatic flow cytometric determination of total bacteria count in raw milk. Bulletin of the IDF, n. 358, p.36-48, 2000.