IN EUCALYPTUS STANDS UNDER RISK CONDITIONS
Isabel Carolina de Lima Guedes1, Luiz Moreira Coelho Júnior2, Antônio Donizette de Oliveira3, José Márcio de Mello4, José Luiz Pereira de Rezende5, Charles Plínio de Castro Silva6 (received: June 1, 2010; accepted: May 27, 2011)
ASBTRACT: Projects are by their very nature subject to conditions of uncertainty that obstruct the decision-making process. Uncertainties involving forestry projects are even greater, as they are combined with time of return on capital invested, being medium to long term. For successful forest planning, it is necessary to quantify uncertainties by converting them into risks. The decision on whether to adopt replacement regeneration or coppice regeneration in a forest stand is infl uenced by several factors, which include land availability for new forest crops, changes in project end use, oscillations in demand and technological advancement. This study analyzed the economic feasibility of replacement regeneration and coppice regeneration of eucalyptus stands, under deterministic and under risk conditions. Information was gathered about costs and revenues for charcoal production in order to structure the cash fl ow used in the economic analysis, adopting the Net Present Value method (VPL). Risk assessment was based on simulations running the Monte Carlo method. Results led to the following conclusions: replacement regeneration is economically viable, even if the future stand has the same productivity as the original stand; coppice regeneration is an economically viable option even if productivity is a mere 70% of the original stand (high-tree planted stand), the best risk-return ratio option is restocking the stand (replacement regeneration) by one that is 20% more productive; the probabilistic analysis running the Monte Carlo method revealed that invariably there is economic viability for the various replacement and coppice regeneration options being studied, minimizing uncertainties and consequently increasing confi dence in decision-making.
Key words: Forest economics, investment analysis, risk and uncertainty.
ANÁLISE ECONÔMICA DA REFORMA E DA TALHADIA DE POVOAMENTOS DE EUCALIPTO EM CONDIÇÕES DE RISCO
RESUMO: Projetos estão sujeitos a condições de incerteza, que difi cultam o processo de tomada de decisão. As incertezas nos projetos fl orestais são ainda maiores, pois estão aliadas ao tempo de retorno do capital investido, sendo de médio a longo prazo. Para o sucesso do planejamento fl orestal, é preciso quantifi car as incertezas, convertendo-as em riscos. A decisão de reformar ou de conduzir o povoamento fl orestal é infl uenciada por diversos fatores, entre os quais se destacam a disponibilidade de terras para novos plantios, as alterações da fi nalidade do empreendimento, as variações na demanda e o avanço tecnológico. Nesse trabalho, analisou-se a viabilidade econômica da reforma e da condução da brotação de povoamentos de eucalipto, em condições determinísticas e de risco. Foram utilizadas informações de custos e receitas da produção de carvão vegetal para construir o fl uxo de caixa usado para a análise econômica, realizada pelo método do Valor Presente Líquido (VPL). A avaliação do risco foi feita com base em simulações realizadas pelo método de Monte Carlo. Concluiu-se que: a reforma é viável economicamente, mesmo que o novo povoamento a ser implantado tenha produtividade igual a do povoamento original; a talhadia é uma opção viável economicamente mesmo que a sua produtividade seja de apenas 70% da do povoamento original (ou alto fuste); a opção de melhor relação risco-retorno é a substituição (reforma) do povoamento por outro 20% mais produtivo; a análise probabilística, realizada pelo método de Monte Carlo, permitiu verifi car que, nas diversas opções de reforma e talhadia estudadas, ocorrerá sempre viabilidade econômica, diminuindo as incertezas e, consequentemente, aumentando a segurança para a tomada de decisões.
Palavras-chave: Economia fl orestal, análise de investimento, risco e incerteza.
1Forest Engineer, MS.c. in Forest Engineering – Plantar – Belo Horizonte, MG, Brasil – isabelcarolinadelima@yahoo.com.br
2Economist, DS.c. in Forest Engineering, Researcher in Socioeconomics – Intituto Agronômico do Paraná/IAPAR – Rodovia BR 163, Km 188 –
85825-000 – Santa Tereza do Oeste, PR, Brasil – lmcoelhojr@iapar.br
3Forest Engineer, Professor, DS.c. in Forest Science – Departamento de Ciências Florestais – Universidade Federal de Lavras – Cx. P. 3037 – 37200-000 –
Lavras, MG, Brasil – donizete@dcf.ufl a.br
4Forest Engineer, Professor, Dr. in Forest Resources – Departamento de Ciências Florestais – Universidade Federal de Lavras – Cx. P. 3037 – 37200-000 –
Lavras, MG, Brasil – josemarcio@dcf.ufl a.br
5Forest Engineer, Ph.D. in Forest Economy – Departamento de Ciências Florestais/DCF – Universidade Federal de Lavras/UFLA – Cx. P. 3037 –
37200-000 – Lavras, MG, Brasil – jlprezen@dcf.ufl a.br
1 INTRODUCTION
The use of Eucalyptus species is very popular in Brazilian forest enterprises, and knowledge of the optimal harvest age and optimal stand regeneration season is key to ensuring project success (REZENDE et al., 2005). According to Rodrigues et al. (1999), these forest enterprises seek to maximize the return on capital invested, regardless of the management being adopted, whether replacement regeneration or coppice regeneration.
The decision on whether to adopt replacement regeneration or coppice regeneration of a forest stand is infl uenced by several factors which include land availability for new forest crops, changes in project end use, oscillations in demand and technological advancements.
In some cases, coppice regeneration might be the most profitable alternative, while in other cases replacement regeneration might be the answer, due to increased yield potential through genetic improvement. Use of genetic improvement allows selecting progenies and productivity gains. In studies about genetic gain for Eucalyptus clones in Minas Gerais state, Botrel et al. (2007) found 6.98% gains in density and 6.89% gains in dry matter. According to Volker et al. (1990), estimates of volume gain for Eucalyptus globulus in Tasmania are in the range of 7% to 17%. Borralho et al. (1992) found a 20% to 47% gain in dry matter, in a study about expected genetic gain for Eucalyptus globulus in Portugal. Rocha et al. (2006) found a 13% to 22% gain in diameter for Eucalyptus urophylla originated in Indonesia and planted in Minas Gerais. According to Trugilho et al. (2001), the greater the variability in the trait of interest among clones or progenies, the greater the estimated gains resulting from genetic improvement.
Conducting a viability analysis is the natural course of business in every venture, looking to fi nd the best alternative for capital investment. Studies involving economic assessment of forest management regimes usually address optimal harvest or rotation age, optimal stand regeneration season, ideal number of stump sprouts to be left in each planting hole when coppicing, number of coppice operations and economic rotation of the stand (NOBRE; RODRIGUEZ, 2001).
That said, projects are nonetheless subject to uncertainties that obstruct the decision-making process. Uncertainties involving forestry projects are even greater because they are combined with time of return on capital
invested, being medium to long term. For successful forest planning, it is necessary to minimize uncertainties by converting them into risks.
Risk is the variability of returns associated with a given asset and risk acceptance is divided into three categories: indifference to risk, aversion to risk and preference for risk (GITMAN, 2002). It is thus related to the creation of scenarios and simulation of factors influencing project viability, providing input to help decision-making.
Traditional methods of uncertainty assessment in the forestry sector typically resort to sensitivity analysis, which is used where information available about each variable is scarce or nonexistent. This analysis only assesses the impact of one independent variable at a time. However, when more than one variable infl uencing the decision-making process are analyzed, it is necessary to try all possible combinations between them, which makes this analysis more complex.
The Monte Carlo method is a robust analysis method known to be a powerful and useful tool, as it involves a set of random variables inherent in the project, in order to verify existing risk prior to decision-making. This methodology analyzes the distribution of relevant variables, as captured by a given probabilistic representation (COELHO JUNIOR et al., 2008).
The objective of this study is to analyze the economic viability of replacement regeneration and coppice regeneration of eucalyptus stands, under deterministic and risk conditions.
2 MATERIAL AND METHODS 2.1 Development of the economic model
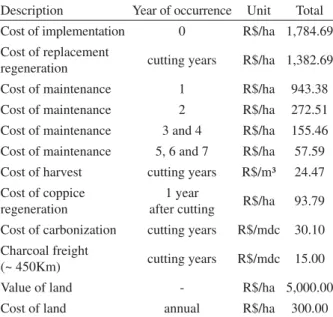
Table 1 provides most likely costs for establishing eucalyptus stands, according to forestry companies in northern Minas Gerais state engaged in timber production for energy purposes. Costs are divided into: implementation, maintenance, harvest, transportation, carbonization, replacement regeneration, coppice regeneration and cost of land.
Cost of maintenance in subsequent years was chiefl y comprised of competitive weed control (42%), soil conservation (22%), ant control (6.52%) and other costs (29.48%).
Cost of harvest was represented by the use of a feller buncher along with a grapple saw and a skidder, for timber harvest and log stacking at the edge of the stand. Cost of coppice regeneration comprised fertilization (35.4%), soil conservation (23.9%), ant control (9.95%) and stump sprout thinning (30.75%). The annual cost of land computed interest rate on land value.
Based on the above costs and considering the revenues from charcoal sale, cash fl ow was structured for the economic analysis (Figure 1). The fi rst situation considered replacement regeneration after harvesting the high-tree planted stand, assuming that the future cloned stand can be more yielding than the preceding stand, in other words, stand replacement will ensure gain due to genetic improvement. In the second situation, cash fl ow considered that, after harvesting the high-tree planted stand, sprout regeneration, also known as coppice regeneration, will be adopted in the stand. There is no genetic gain in this case.
For the situation of replacement regeneration, the following costs and revenues were considered: C0 is cost of implementation, C1, C2, C3 and C4 are costs of maintenance, C5 is cost of land, C6 and C11 are costs of harvest, C7 and C12 are costs of carbonization, C8 and C13 are costs of transportation, C9 is cost of replacement regeneration, while R1 and R2 are revenues from timber sale at age 7 and 14 respectively.
Table 1 – Costs of charcoal production from eucalyptus wood in northern Minas Gerais.
Tabela 1 – Custos de produção de carvão vegetal de madeira de eucalipto na região norte de Minas Gerais.
Description Year of occurrence Unit Total
Cost of implementation 0 R$/ha 1,784.69
Cost of replacement
regeneration cutting years R$/ha 1,382.69
Cost of maintenance 1 R$/ha 943.38
Cost of maintenance 2 R$/ha 272.51
Cost of maintenance 3 and 4 R$/ha 155.46
Cost of maintenance 5, 6 and 7 R$/ha 57.59
Cost of harvest cutting years R$/m³ 24.47
Cost of coppice regeneration
1 year
after cutting R$/ha 93.79 Cost of carbonization cutting years R$/mdc 30.10 Charcoal freight
(~ 450Km) cutting years R$/mdc 15.00
Value of land - R$/ha 5,000.00
Cost of land annual R$/ha 300.00
Source: Companies in the forestry sector producing timber for energy purposes, with stands in northern Minas Gerais. mdc* = cubic meter of charcoal
Where C0 is cost of implementation, C1, C2, C3 and C4 are costs of maintenance, C5 is cost of land, C6 and C11 are costs of harvest,
C7 and C12 are costs of carbonization, C8 and C13 are costs of transportation, C9 is cost of replacement regeneration, C10 is cost of coppice regeneration, while R1 and R2 are revenues from timber sales at age 7 and 14 respectively.
Figure 1 – Cash fl ow for the high-tree stand (0 to 7 years) and coppice regeneration (7 to 14 years).
Figura 1 – Fluxo de caixa para o povoamento de alto fuste (0 aos 7 anos) e de condução da brotação (7 aos 14 anos). Cost of maintenance in year one comprised
For the situation of coppice regeneration, the following costs and revenues were adopted: C0 is cost of implementation, C1, C2, C3 and C4 are costs of maintenance, C5 is cost of land, C6 and C11 are costs of harvest, C7 and C12 are costs of carbonization, C8 and C13 are costs of transportation, C10 is cost of coppice regeneration, while R1 and R2 are revenues from timber sales in year 7 and 14 respectively.
To enable a comparison of the two situations, a 14-year planning horizon was considered, which is the time required for one replacement regeneration and one coppice regeneration (Figure 1).
Revenue was based on the per ton price of dry matter (Pms), calculated on the basis of per cubic meter price of charcoal (mdc), in such way as to allow changes in basic density (Db), due to genetic improvement or coppice regeneration (WHITTOCK et al.; 2004). The equation used for the calculation is given as follows:
where Fc is the conversion factor from m³ of timber to m³ of charcoal and Pc is the price per m³ of charcoal.
Matthews (1992) and Underdown and Bush (2002) argue that, as a result of an established root system, volume yield from coppice regeneration can be up to 25% higher than that of the high-tree planted stand.
Loss from mortality, on the other hand, and/or postharvest damage to stumps, can dramatically reduce yield in the coppice method in comparison to the high-tree planted stand (FARIA et al. 2002; MATTHEWS, 1992).
Yield of the stand adopting replacement regeneration, and yield of the stand adopting coppice regeneration, were calculated as follows:
where: Prmelhorado is yield of the stand adopting replacement regeneration, Pr is yield of the original stand, gg is percentage of genetic gain, gv is percentage of genetic gain relative to volume gain, Prtalhadia is yield of the stand adopting coppice regeneration and %Pr is variation in yield of coppice regeneration relative to yield of original stand.
Genetic gain was divided in gain in volume and basic density, with 90% corresponding to gain in volume and 10% to gain in basic density. Scenarios were constructed, considering gains of 0%, 10%, 20%, 30%, 40% and 50% relative to original stand yield. In like manner, coppice yields of 70%, 80%, 90%, 100%, 110%, 120% and 130% were considered, relative to the original stand.
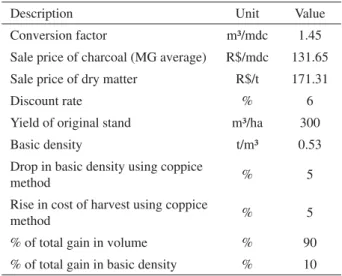
According to Albertsen et al. (2000), the cost of harvest in coppiced stands is higher than in original high-tree stands. To adjust this situation, cost of harvest for the coppiced stand was increased by 5% in relation to cost of harvest for the original stand. Table 2 provides a summary of additional information used in the economic assessment. Table 2 – Data used in the economic assessment.
Tabela 2 – Dados utilizados na avaliação econômica.
Description Unit Value
Conversion factor m³/mdc 1.45
Sale price of charcoal (MG average) R$/mdc 131.65
Sale price of dry matter R$/t 171.31
Discount rate % 6
Yield of original stand m³/ha 300
Basic density t/m³ 0.53
Drop in basic density using coppice
method % 5
Rise in cost of harvest using coppice
method % 5
% of total gain in volume % 90
% of total gain in basic density % 10
mdc* = cubic meter of charcoal
1 *Pc Fc Pms
Db
=
Pr Pr 1 *
100 100
melhorado
gg gv
⎛ ⎛ ⎞ ⎛ ⎞⎞
= ⎜ + ⎜ ⎟ ⎜ ⎟⎟
⎝ ⎠ ⎝ ⎠
⎝ ⎠
% Pr
Pr Pr*
100 talhadia=
2.2 Identifi cation of input variables
Opportunities and threats infl uencing the yield in each management regime were identifi ed, and input variables (inputs) included the yield of the high-tree planted stand, or original stand, and basic density.
As regards productivity, the most likely volume value for the high-tree planted stand was assumed as 300 m³/ha, while maximum and minimum values were assumed as 20% above and below that respectively. 2.3 Identifi cation of the output variable
Both the deterministic analysis (risks are not taken into account) and the risk analysis adopted the Net Present Value (VPL) method as output variable, computed for an annual interest rate of 6%. According to Rezende e Oliveira (2008), VPL is given by the following equation:
where Rj is value of revenues; Cj is value of costs; i is interest rate; j is period in which revenues or costs occur; n is project duration.
2.4 Risk analysis
The risk analysis was conducted running the Monte Carlo method so as to simulate values for the input variables and, as a result of the random values generated, to obtain values for the output variable.
Cash fl ows were structured, and 10,000 simulations were run for the output variable using pseudorandom numbers, in other words, a series of values was generated for the variable and, consequently, its simple and cumulative frequency distribution was obtained.
3 RESULTS AND DISCUSSION
3.1 Deterministic economic analysis of managemen t regimes
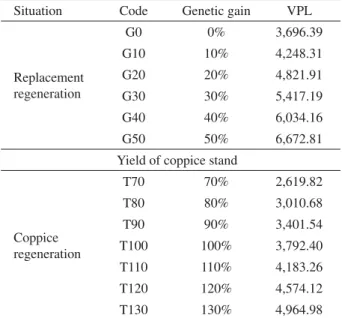
Table 3 provides VPL results according to deterministic analysis (risks are not taken into account), indicating that all tested alternatives are economically viable. In the situation of replacement regeneration it was noted that, with improved genetic gain, volume yield increases and so does VPL. Likewise, for different yields of the coppiced stand in relation to the original stand, as yield increases, so does expected return. Rezende et al. (2005) found the same VPL pattern relating to yield in studies of optimum cutting age for Eucalyptus.
In the harvest season, should there be a clone available capable of producing the same yield as the high-tree planted stand (zero genetic gain = G0), the VPL will be R$ 3,696.39. Assuming the yield of the coppiced stand is the same as that of the high-tree planted stand (T100), the VPL will be R$ 3,792.40, therefore coppice regeneration
should be preferred over replacement regeneration. On the other hand, if the yield of the coppiced stand is only 90% of that produced by the original stand (T90), the VPL then drops to R$ 3,401.54, in which case replacement is a better option than coppice regeneration.
Should there be a clone yielding 10% more than the high-tree planted stand (10% genetic gain = G10), then replacement should be more profi table than coppice regeneration, providing yield from coppicing is not more than 10% the yield of the high-tree planted stand (T110). For genetic gain of 30% (G30) or over, in no event should coppice regeneration be more viable economically than replacement regeneration.
This analysis is interesting for decision makers, as it provides return possibilities according to different management options prior to implementing them in the harvest season. For that, it is necessary to have prior information on expected yields of the coppiced stand and also on clones available for new crop planting.
Rocha et al. (2006) reported 13% to 22% gains in diameter for Eucalyptus urophylla. Botrel et al. (2007), in a study with Eucalyptus clones in Minas Gerais, found a 6.98% gain in basic density and a 6.89% gain Table 3 – VPL for different percentages of genetic gain in replacement regeneration and different yields of coppice regeneration in relation to the high-tree planted stand (original).
Tabela 3 – VPL para as diferentes porcentagens de ganho genético do povoamento reformado e as diferentes produtividades da talhadia em relação ao povoamento do alto fuste (ou original).
Situation Code Genetic gain VPL
Replacement regeneration
G0 0% 3,696.39
G10 10% 4,248.31
G20 20% 4,821.91
G30 30% 5,417.19
G40 40% 6,034.16
G50 50% 6,672.81
Yield of coppice stand
Coppice regeneration
T70 70% 2,619.82
T80 80% 3,010.68
T90 90% 3,401.54
T100 100% 3,792.40
T110 110% 4,183.26
T120 120% 4,574.12
T130 130% 4,964.98
(
)
(
)
0 0
1 1
n n
j j
j j
j j
VPL R i − C i −
= =
in dry matter. These results are strong indicators of the difficulty encountered today in attaining significant volume yield gains of wood or dry matter resulting from genetic improvement or from updated management and silvicultural techniques.
3.2 Economic analysis of management regimes under risk conditions
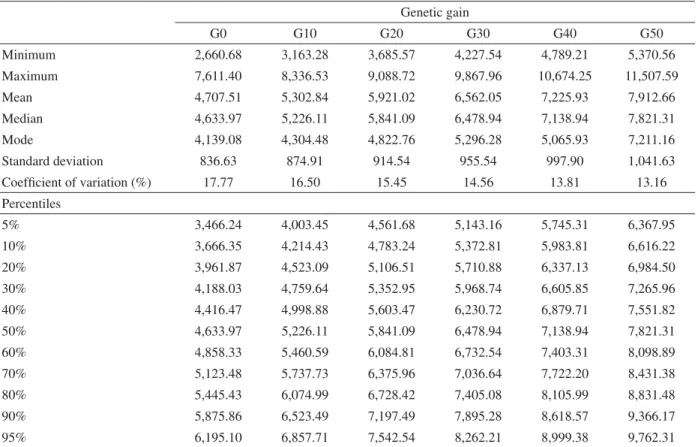
Results of Monte Carlo simulation for replacement regeneration and coppice regeneration are provided in Tables 4 and 5 respectively. No probability of negative VPL values occurring were noted in any of the simulations, in other words, there is no risk that the options being tested are economically inviable.
The values of standard deviation help confi rm that risks of economic inviability are virtually nonexistent. In Table 4, for instance, for the no genetic gain (G0) situation, a standard deviation of R$ 836.63 indicates that more than 5.6 standard deviations would be required for a zero
VPL. For the 50% genetic gain (G50) situation, risks of negative VPLs are even slighter, requiring for that a drop of 7.6 standard deviations in VPL.
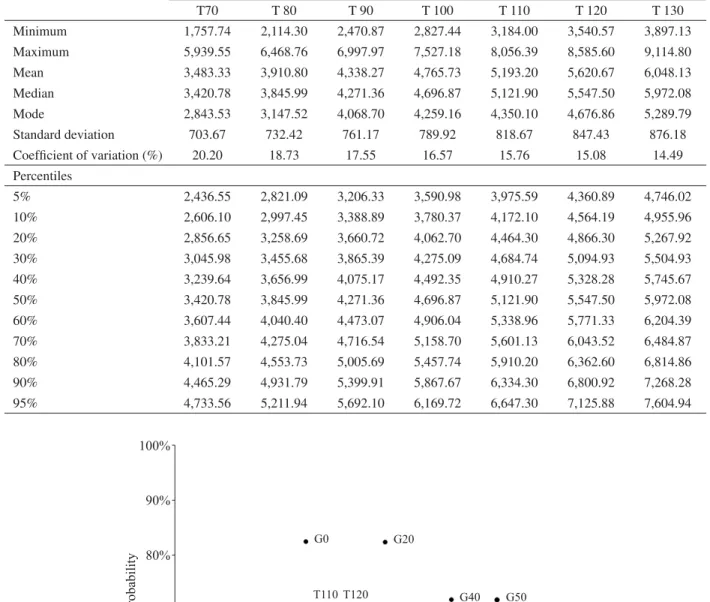
As is illustrated in Table 5, for the situation where the yield of the coppiced stand equals that of the original stand (T100), the percentile analysis indicated a 10% probability of VPL having minimum values of R$ 3,780.37 and a 90% probability of it having maximum values of R$ 5,867.67.
Mode values are lower than median values and these in turn are lower than mean values, indicating that the probability distribution of VPL values is approximately normal with positive skewness.
Figure 2 provides several genetic gain situations for the high-tree planted stand, and yields from coppicing relative to the original planted stand. The analysis considered the point at which the cumulative distribution function intersects the theoretical curve of frequency distribution. VPL occurrence probabilities were noted to range between 70% and 85% according to each different situation. Table 4 – Descriptive statistics of VPL (R$/ha), considering different percentages of genetic gain of the high-tree planted stand. Tabela 4 – Estatísticas descritivas do VPL (R$/ha), considerando as diferentes porcentagens de ganho genético do povoamento do alto fuste.
Genetic gain
G0 G10 G20 G30 G40 G50
Minimum 2,660.68 3,163.28 3,685.57 4,227.54 4,789.21 5,370.56
Maximum 7,611.40 8,336.53 9,088.72 9,867.96 10,674.25 11,507.59
Mean 4,707.51 5,302.84 5,921.02 6,562.05 7,225.93 7,912.66
Median 4,633.97 5,226.11 5,841.09 6,478.94 7,138.94 7,821.31
Mode 4,139.08 4,304.48 4,822.76 5,296.28 5,065.93 7,211.16
Standard deviation 836.63 874.91 914.54 955.54 997.90 1,041.63
Coeffi cient of variation (%) 17.77 16.50 15.45 14.56 13.81 13.16
Percentiles
5% 3,466.24 4,003.45 4,561.68 5,143.16 5,745.31 6,367.95
10% 3,666.35 4,214.43 4,783.24 5,372.81 5,983.81 6,616.22
20% 3,961.87 4,523.09 5,106.51 5,710.88 6,337.13 6,984.50
30% 4,188.03 4,759.64 5,352.95 5,968.74 6,605.85 7,265.96
40% 4,416.47 4,998.88 5,603.47 6,230.72 6,879.71 7,551.82
50% 4,633.97 5,226.11 5,841.09 6,478.94 7,138.94 7,821.31
60% 4,858.33 5,460.59 6,084.81 6,732.54 7,403.31 8,098.89
70% 5,123.48 5,737.73 6,375.96 7,036.64 7,722.20 8,431.38
80% 5,445.43 6,074.99 6,728.42 7,405.08 8,105.99 8,831.48
90% 5,875.86 6,523.49 7,197.49 7,895.28 8,618.57 9,366.17
Table 5 – Descriptive statistics of VPL (R$/ha), considering different yields from coppicing.
Tabela 5 – Estatísticas descritivas do VPL (R$/ha), considerando as diferentes produtividades da talhadia.
Yield of coppiced stand
T70 T 80 T 90 T 100 T 110 T 120 T 130
Minimum 1,757.74 2,114.30 2,470.87 2,827.44 3,184.00 3,540.57 3,897.13
Maximum 5,939.55 6,468.76 6,997.97 7,527.18 8,056.39 8,585.60 9,114.80
Mean 3,483.33 3,910.80 4,338.27 4,765.73 5,193.20 5,620.67 6,048.13
Median 3,420.78 3,845.99 4,271.36 4,696.87 5,121.90 5,547.50 5,972.08
Mode 2,843.53 3,147.52 4,068.70 4,259.16 4,350.10 4,676.86 5,289.79
Standard deviation 703.67 732.42 761.17 789.92 818.67 847.43 876.18
Coeffi cient of variation (%) 20.20 18.73 17.55 16.57 15.76 15.08 14.49
Percentiles
5% 2,436.55 2,821.09 3,206.33 3,590.98 3,975.59 4,360.89 4,746.02
10% 2,606.10 2,997.45 3,388.89 3,780.37 4,172.10 4,564.19 4,955.96
20% 2,856.65 3,258.69 3,660.72 4,062.70 4,464.30 4,866.30 5,267.92
30% 3,045.98 3,455.68 3,865.39 4,275.09 4,684.74 5,094.93 5,504.93
40% 3,239.64 3,656.99 4,075.17 4,492.35 4,910.27 5,328.28 5,745.67
50% 3,420.78 3,845.99 4,271.36 4,696.87 5,121.90 5,547.50 5,972.08
60% 3,607.44 4,040.40 4,473.07 4,906.04 5,338.96 5,771.33 6,204.39
70% 3,833.21 4,275.04 4,716.54 5,158.70 5,601.13 6,043.52 6,484.87
80% 4,101.57 4,553.73 5,005.69 5,457.74 5,910.20 6,362.60 6,814.86
90% 4,465.29 4,931.79 5,399.91 5,867.67 6,334.30 6,800.92 7,268.28
95% 4,733.56 5,211.94 5,692.10 6,169.72 6,647.30 7,125.88 7,604.94
Figure 2 – Probability of success and return (VPL) in R$/ha for various management regimes.
The option providing the best risk-return combination is the 20% genetic gain situation (G20), as it combines a high probability of return occurrence (82.52%) with a high return (VPL = R$ 6,765.36). It should be noted, however, that attaining a 20% genetic gain with eucalyptus stands at present is a diffi cult task, due to the current technological stage of Brazilian silviculture.
The no genetic gain (G0) situation provides the second best risk-return combination. Here, the risk is lower (probability of return occurrence = 82.61%) than in G20, but then return too is lower (VPL = R$ 5,532.09).
The no genetic gain (G0) situation is really what happens in practice with several forestry companies, since replacement regeneration uses the same clone as that of the original stand. Where the yield of the coppiced stand being 10% higher than the yield of the original stand (T110) is considered a plausible alternative, one should be aware of the risk of that not occurring in practice as a result of technology defi ciency (operational risk).
In accepting the above risk, assuming that technology will enable yield from coppicing to be 10% higher than yield from the original stand (T110), coppice regeneration is a better option than replacement regeneration if there is no genetic gain (G0), that is, if the yield of the future stand equals that of the original stand. Considering that the yield of the coppiced stand equals that of the original stand (T100), the best option is replacement regeneration, if there is no genetic gain (G0).
4 CONCLUSIONS
Deterministic and risk analyses for the various options of replacement regeneration and coppice regeneration of Eucalyptus stands led to the following conclusions:
- replacement regeneration is economically viable, even if the yield of the new stand is the same as that of the original stand;
- coppice regeneration is economically viable, even if the yield is only 70% of the original stand (high-tree planted stand);
- the best risk-return ratio option is substituting (replacement regeneration) the original stand with another yielding 20% more;
- the probabilistic analysis running the Monte Carlo method revealed that invariably there is economic viability for the various replacement and coppice regeneration options being studied, minimizing uncertainties and consequently increasing confi dence in decision-making.
5 REFERENCES
ALBERTSEN, T.; ECKERSLY, P.; BLENNERHASSETT, S.; MOORE, R.; HINGSTON, R. Blue gum timberbelt design
for Alley farming. Canberra, 2000.
BORRALHO, N. M. G.; COTTERILL, P. P.; KANOWSKI, P. J. Genetic parameters and gains expected from selection for dry weight in Eucalyptus globulus ssp. globulus in Portugal.
Forest Science, Bethesda, v. 38, n. 1, p. 80-94, 1992.
BOTREL, M. C. G.; SILVA, J. R. M. da; TRUGILHO, P. F.; ROSADO, S. C. da S.; FERNANDES, B. R. Ganho genético em propriedades físicas e mecânicas de clones de Eucalyptus.
Scientia Florestalis, Piracicaba, n. 76, p. 13-19, dez. 2007.
COELHO JUNIOR, L. M.; REZENDE, J. L. P.; OLIVEIRA, A. D.; COIMBRA, L. A. B.; SOUZA, A. N. Análise de investimento de um sistema agrofl orestal sob situação de risco.
Cerne, Lavras, v. 14, n. 4, p. 368-378, out./dez. 2008.
FARIA, G. E.; BARROS, N. F.; NOVAIS, R. F.; LIMA, J. C.; TEIXEIRA, J. L. Produção e estado nutricional de povoamentos de Eucalyptus grandis, em segunda rotação, em resposta à adubação potássica. Revista Árvore, Viçosa, v. 26, n. 5, p. 1901-1912, out. 2002.
GITMAN, L. J. Princípios de administração fi nanceira. São Paulo: Habra, 2002.
MATTHEWS, J. D. The coppice system. In: ______.
Silvicultural systems. Oxford: Clarendon, 1992. p. 190-224.
NOBRE, S. R.; RODRIGUEZ, L. C. E. Um método para composição e avaliação econômica de regimes de talhadia simples.
Scientia Forestalis, Piracicaba, n. 60, p. 29-44, dez. 2001.
REZENDE, J. L. P.; OLIVEIRA, A. D. de. Análise econômica e
social de projetos fl orestais. 2. ed. Viçosa, MG: UFV, 2008. 386 p.
REZENDE, J. L. P.; OLIVEIRA, A. D. de; RODRIGUES, C. Efeito dos tributos no custo de produção, na rotação e na reforma de Eucalyptus spp. Cerne, Lavras, v. 11, n. 1, p. 70-83, jan./mar. 2005.
RODRIGUES, F. L.; LEITE, H. G.; SILVA, M. L.; GOMES, A. N. Determinação de estratégias ótimas de reforma, condução da brotação e compra de terras, utilizando programação linear. Revista Árvore, Viçosa, v. 23, n. 2, p. 169-186, abr./jun. 1999.
SCOLFORO, J. R. S.; ANDRADE, I. S.; OLIVEIRA, A. D. de; ABREU, E. C. R.; CARVALHO, L. M. T. de. Tendências da produção em volume, peso de matéria seca e carbono dos refl orestamentos em Minas Gerais. In: SCOLFORO, J. R. S.; CARVALHO, L. M. T. de; OLIVEIRA, A. D. de (Ed.). Inventário
fl orestal de Minas Gerais: monitoramento dos refl orestamentos e tendências da produção em volume, peso de matéria seca e carbono, 2005 - 2007. Lavras: UFLA, 2008. cap. 2, p. 93-150.
SESBOU, P. A.; NEPVEU, G. Viabilité infraspécifi que et effet du recépage sur la densité du bois, le rendement papetier et la longueur des fi bres chez Eucalyptus camaldulensis traité em taillis. Silvae Genetica, Frankfurt, v. 40, n. 5/6, p. 173-179, 1991.
SHARDA, V. N.; SAMRAJ, P.; SAMRA, J. S.; LAKSHMANAN, V. Hydrological behaviour of fi rst
generation coppiced bluegum plantations in the Nilgiri sub-watersheds. Journal of Hydrology, Amsterdam, v. 211, n. 1/4, p. 50-60, Nov. 1998.
TRUGILHO, P. F.; LIMA, J. T.; MORI, F. A.; LINO, A. L. Avaliação de clones de Eucalyptus para produção de carvão vegetal. Cerne, Lavras, v. 7, n. 2, p. 104-114, 2001.
UNDERDOWN, M.; BUSH, D. Coppicing eucalypt plantations: boon or bane? Australian Forest Growers, Melbourne, v. 25, n. 2, p. 18-19, 2002.
VOLKER, P. W.; DEAN, C. A.; TIBBITS, W. N.;
RAVENWOOD, I. C. Genetic parameters and gains expected from selection in Eucalyptus globulus in Tasmania. Silvae
Genetica, Frankfurt, v. 39, n. 1, p. 18-21, 1990.