Autor Correspondente | Corresponding Author Recebido | Received: 07/06/2013 Aprovado | Approved: 02/12/2013 Publicado | Published: dez./2013
Summary
This is a review of the current existing literature concerning the inspection of fruits and vegetables with the application of computer vision, where the techniques most used to estimate various properties related to quality are analyzed. The objectives of the typical applications of such systems include the classification, quality estimation according to the internal and external characteristics, supervision of fruit processes during storage or the evaluation of experimental treatments. In general, computer vision systems do not only replace manual inspection, but can also improve their skills. In conclusion, computer vision systems are powerful tools for the automatic inspection of fruits and vegetables. In addition, the development of such systems adapted to the food industry is fundamental to achieve competitive advantages.
Key words: Computer vision; Image analysis; Automatic inspection; Quality control; Real time.
Resumo
Este trabalho apresenta uma revisão da literatura existente, mais recente, sobre visão computacional aplicada à inspeção de frutas e verduras. Foram analisadas as técnicas mais empregadas para estimar diversas propriedades relacionadas com a qualidade. Os objetivos das aplicações típicas de tais sistemas incluem a classificação, a estimativa da qualidade segundo características internas ou externas, o seguimento dos processos da fruta durante o armazenamento ou a avaliação de tratamentos experimentais. Em geral, um sistema de visão computacional não só pode substituir a inspeção manual, mas também melhorar suas capacidades. Conclui-se que os sistemas de visão computacional são potentes ferramentas para a inspeção automática da qualidade de frutas e verduras, e o desenvolvimento de sistemas deste tipo, adaptados à indústria de alimentos, é fundamental para adquirir vantagens competitivas.
Palavras-chave: Visão computacional; Análise de imagens; Inspeção automática; Controle de qualidade; Tempo real.
Autores | Authors
Erick SALDAÑA University of São Paulo (USP), Department
of Agro-industry, Food and Nutrition, “Luiz de Queiroz” Agricultural College Piracicaba/SP - Brazil e-mail:erick_16_13@hotmail.com
Raúl SICHE Universidad Nacional de Trujillo (UNT),
Facultad de Ciencias Agropecuarias Av. Juan Pablo II, s/n, Ciudad Universitaria Trujillo - Perú e-mail: rsiche@unitru.edu.pe
Mariano LUJÁN Padua University (UNIPD), Dipartimento
di Agronomia Animali Alimenti Risorse Naturali e Ambiente (DAFNAE), Automation Engineering Padova/Veneto - Italia e-mail: marianowilmer.lujancorro@studenti.
unipd.it
Roberto QUEVEDO Universidad de Los Lagos (ULagos), Food
Science and Technology Department Osorno/Los Lagos - Chile e-mail:rquevedo@ulagos.cl
and quality control of fruits and vegetables
the same day from the same tree. Food products naturally evolve in colour or texture after harvesting, and these characteristics depend on their maturity and their storage conditions (humidity and temperature, fungal infections, presence of volatile substances, storage duration, etc.). In addition, the colour of a particular area of the skin of a healthy fruit can match the colour of a spot on the surface of another fruit of the same variety. Moreover, it is essential to detect the presence of stems, leaves, dirt or any foreign material on quality control lines, and not confuse these with other skin blemishes. All this greatly complicates the development of algorithms capable of extracting quality decisions from image analyses, especially taking into account the fact that markets demand very fast image processing to achieve commercial production, so it is necessary to find a compromise between speed and precision.
This survey provides a comprehensive review of recent advances in computer vision inspection as applied to fruits and vegetables. It includes the analysis of the different technologies used, together with applications and developments intended for the external quality control of these products. The instructions are not only based on the analysis of images acquired in the visible spectrum but also on images obtained by ultraviolet induced fluorescence (UVIF) spectrum or acquired in the near infrared (NIR) spectrum. A review of other advanced techniques such as hyperspectral-image analysis, that produced by magnetic resonance (MR) and X-rays was also included, because such techniques now represent the most advanced technologies in this field and allow researchers to expand the scope of the inspection of fruits and vegetables to their internal quality characteristics.
2 Theoretical support
2.1 Computer vision system
Computer vision is the science that develops the theoretical groundwork and algorithms to extract and analyze automatically useful information about an object or set of objects observed (GUNASEKARAN, 1996; SUN, 2000; SUN and BROSNAN, 2003; ZHENG et al., 2006a, b; DU and SUN, 2006). In the inspection process and technical evaluation using electronic media, computer vision has the advantage of being fast, consistent, objective, non-invasive and inexpensive. In recent years, computer vision has been used to objectively measure the quality attributes of different food colours (BROSNAN and SUN, 2004; CUBERO et al., 2011; DU and SUN, 2004; JACKMAN et al., 2011).
Due to the huge diversity of shapes, textures and colours, the success of an online monitoring system of food depends largely on the hardware configuration of the computer vision system, which generally consists of
1 Introduction
The application of computer vision in industry has increased considerably in recent years, and one can find applications in the terrestrial and aerial mapping of natural resources, crop monitoring, precision agriculture, robotics, automatic guiding, non-destructive inspection of product properties, quality control and sorting in processing lines and the general automation of processes (CUBERO, 2012).This wide range of applications is due to the fact that computer vision systems provide significant amounts of information about the nature or attributes of scene analyses. Furthermore, this technology allows for the possibility of studying scenes in regions of the electromagnetic spectrum in which the human eye is not sensitive, such as ultraviolet radiation (UV) or infrared spectral regions (ZUDE, 2008).
One area where the use of this technology has spread rapidly is in the inspection of food products (SUN, 2007; LORENTE et al., 2012) and in particular in the automatic inspection of fruits and vegetables. The quality of a piece of fruit or vegetable, fresh or processed, is defined by a series of physicochemical characteristics that make it more or less attractive to consumers, such as its maturity, size, weight, shape, colour, presence of dirt and diseases, presence or absence of stem, presence of seeds, sugar content, etc..These features cover all the factors that influence the appearance of a product and may eventually include nutritional and sensory qualities or properties related to its conservation. Most of these factors have traditionally been evaluated by a visual inspection performed by qualified personnel, but today have mostly been replaced by commercial automatic inspection systems based on computer vision and image analysis (DU and SUN, 2006). In manual sorting processes, there is a relatively high risk of human error, and decisions made by workers can be affected by psychological factors such as fatigue or acquired habits. One study carried out with different varieties of apple, where qualified staff compared several parameters such as shape, size and colour, showed the limited human capacity to reproduce the estimation of quality, which the authors defined as “inconsistency” (PAULUS et al., 1997). Moreover quality requirements are increasing due to new governmental regulations and consumer market requests.
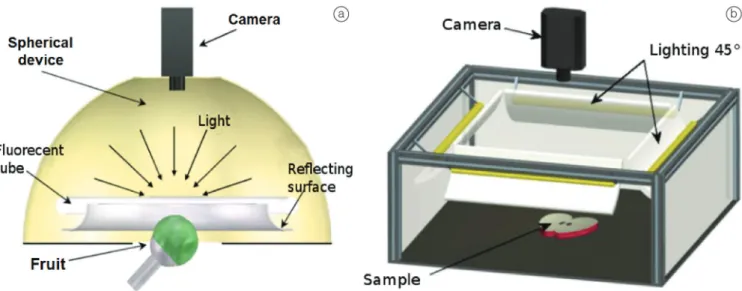
a plane object is being illuminated, in order to avoid direct reflections on the camera. Fernandez et al. (2005) used this setting to illuminate apple slices to monitor and evaluate their dehydration based on colour and shape. Pedreschi et al. (2006) used a similar system to illuminate potato chips in a system designed to measure the kinetics of colour change under different frying temperatures.
Moreover, if the object is roughly spherical, it is more convenient to use a hemispherical diffuser device in order to illuminate it uniformly. Riquelme et al. (2008) used a device of this nature to illuminate and inspect olives. However, in these systems and in those which generally illuminate the object from above, the top of the object appears brighter than the edges, so creating a false change in intensity which must be corrected later. They proposed a methodology to correct this effect in citrus by constructing an elevation model of the fruit used to estimate the theoretical height and angle of the incidence of light for each pixel. This made it possible to estimate the appropriate corrections of the reflectance observed. Figure 2 shows two examples of lighting systems for illuminating spherical and flat objects.
A system can prevent unwanted glare and reflections on the objects by using a lighting system with polarizing filters and the use of cross-polarization techniques prevents the occurrence of specular reflection in the images. Blasco et al. (2007a) used this technique to avoid glare on the images of citrus fruit illuminated with fluorescent tubes, and thus estimated the colour and surface defects more accurately. When the object under inspection is translucent, or when the information is obtained from an analysis of its contour, back lighting can be used, which is achieved by placing the object between the light and the camera. Blasco et al. (2009a) adopted this solution for the online inspection of tangerine segments moving on semitransparent conveyor belts. By illuminating the slices from below, these images showed a vigorous contrast with the background, allowing for an easier morphological analysis of the contour, the seeds appearing darker than the rest of the wedge, facilitating their detection.
The emission spectrum of the light source is fundamental to the acquisition of a proper image. Fluorescent tubes are valid for applications where visible light is important (for example, sorting by colour), but produce little radiation in the infrared region. Moreover, with the use of conventional ballasts, there is a characteristic oscillation of the light intensity, an aspect that must be corrected by the use of high frequency electronic ballasts. Incandescent lamps emit more infrared radiation, but typically generate a lot of heat and have a low colour temperature,which is a major drawback in applications based on colour (CUBERO, 2012).
a lighting device, camera solid state (CCD), a personal computer monitor and a high-resolution colour device (Figure 1). The quality of the images to be captured is a direct function of two elements of the system: camera and illumination (lighting system).
While the camera is a commercial device where it is only necessary to choose the model that best fits the needs of each case, the lighting system can be created and configured in a specific way. Therefore the investigator must decide how to design and subsequently build the lighting system, depending on the particular application and the geometry of the object to be inspected.
2.2 Lighting
A good illumination system should provide uniform radiation across the scene, avoiding the presence of shine or shadows, and as far as possible must be spectrally uniform and stable over time. If the scene is not lit properly, it will increase the uncertainty and classification error, leading to the need for a pre-processing of the images, thus increasing the time required to analyze each image.
The arrangement of the light sources significantly affect the images acquired, due to the fact that some areas may receive more light than others, changing the total amount of radiation reflected from the objects in these areas. An uneven illumination can be corrected by calibrating the image using a white board of known reflectance (reference white), but this correction consumes some of the computational resources. Moreover, it is very important to consider the geometry of the inspected object. For example, directing the illumination at an angle of 45° with respect to the vertical is effective when
2.3 Image acquisition
The cameras are devices that acquire images, converting the light received from the scene into electronic signals. The most popular industrial cameras are based on CCD, which consist of a series of sensors (pixels), each of which is composed of a photocell and a capacitor (PETERSON, 2001). The charge acquired by the capacitor depends on the amount of light received by the photocell. These charges are converted to voltage and then into video signals. Some cameras are based on a linear CCD, consisting of a one-dimensional array of sensors that acquire a narrow strip of the scene. These cameras, known as linear scan cameras are suitable for applications where the object moves under the camera or where the camera moves over the object, so that the complete picture of its surface is acquired gradually, line to line. However, matrix cameras are the ones most commonly used in commercial applications. These take on a scene using a CCD in a two-dimensional matrix. Colour cameras can be built with a single CCD, consisting of pixels that are sensitive to the primary bands of red, green and blue (RGB), but more sophisticated, high quality cameras are also available, with three CCD. In these cameras, the light coming through the main lens is divided into three light beams through a series of lenses and mirrors, which create three copies of the scene, one from the red filter, another from the green filter and the third from the blue filter. After each filter there is a monochrome CCD sensor, so that each acquires a single RGB signal. The newest cameras are based on the complementary metal oxide semiconductor (CMOS) system. The integration with semiconductors has increased the density of the sensors, allowing for rapid technological development. These sensors have lower power consumption and lower manufacturing costs, and Nowadays lighting systems based on light emitting
diodes (LEDs) are becoming more frequent and economic. They usually have low power consumption, are robust and produce very little heat, but on the other hand, are directional and the light output is still quite limited.
In addition, special mention must be made of lighting systems that induce the phenomenon of fluorescence, due to the possible damage or production of invisible characteristics to the human eye. At certain wavelengths, the radiation received excites certain molecules, whose subsequent relaxation results in the body emitting lower energy radiation light (longer wavelengths). For example, induced fluorescence in the ultraviolet spectrum allows for certain types of external damage on fruits and produces fluorescence in the visible spectrum (CUBERO, 2012). Obenland and Neipp (2005) used the fluorescence of chlorophyll to locate incipient lesions on the skin caused by hot water treatments of lemons. Moreover, Ariana et al. (2006a) used UVIF to detect different types of defect in three varieties of apple. Light emission at 740 nm, after UV excitation, allows for the detection of defects. Slaughter et al. (2008) used the same method to detect damage caused by frost, which is very difficult to detect with visible light. They obtained a success rate between 64% and 88%, depending on the severity of the damage. Another application was that described by Lefcout and Kim (2006), using UVIF to detect contaminants in fruits such as apples, where they found that 668 nm was the peak fluorescence response from contaminants.
Table 1 shows a review of the different applications of computer vision in fruits and vegetables, including the spectral range data, the technique used and the resulting accuracy.
950 nm in combination with visible images for classifying apples in real time. Unay and Gosselin (2006) used four band-pass interference filters centred at 450 nm, 500 nm, 750 nm and 800 nm to detect defects in apples. More recently hyperspectral image acquisition systems have been used to inspect fruits and vegetables (SUN, 2010). These systems use narrow band filters to generate hyperspectral images composed of n monochromatic images, each corresponding to the radiance / reflectance at a specific wavelength. Depending on the technology used there are different hyperspectral image acquisition systems, the three most popular being the image spectrographs (POLDER et al., 2001), the acoustic-optical tunable filters (FSAO) (BEI et al., 2004) and the liquid crystal tunable filters (LCTF) (EVANS et al., 1998). are currently being widely implemented in webcams and
mobile devices (CUBERO, 2012).
Frequently the inspection of products or specific features requires image acquisition systems that are sensitive to different wavelengths throughout the spectrum. In these cases, multispectral cameras can be used, which combine various visible and invisible bands using appropriate filters and sensors. Aleixos et al. (2002) developed a multispectral camera for image acquisition in the visible and NIR spectra of the same scene, in order to inspect citrus fruit using an automatic sorting machine. Lleó et al. (2009) used a camera sensitive to three bands in the visible spectrum and to NIR in order to estimate the maturity of peaches. Throop et al. (2005) proposed a special camera designed to acquire images at 740 and
Table 1. The application of computer vision in the quality and safety evaluation of fruits and vegetables.
Products Applications Spectral
range Analysis Precision References
Apple
Firmness and soluble
solids content 500–1040
Artificial neural
networks 0.74-0.94 Noh and Lu (2007) Firmness and soluble
solids content 680–950
Multiple linear
regression 0.88-0.89 Peng and Lu (2008) Firmness and soluble
solids content 500–1000
Multiple linear
regression 0.75-0.86 Qin et al.(2009)
Detection of stains 400–1000 Principal component
analysis 93.95% ElMasry et al. (2008)
Detection of stains 400–1000 Principal component
analysis 86.00% Xing and De Baerdemaeker (2005)
Detection of stains 400–1000 Principal component
analysis 86.36% Xing et al.(2007) Detection of bitter
spots 900–1700
Least squares
regression - Nicolai et al. (2006)
Chilling injury 400–1000 Artificial neural
networks 98.40% ElMasry et al. (2008)
Stem/Chalice 400–1000 Principal component
analysis 98-100% Xing et al. (2007)
Sugar content 685–900 Least squares
regression 0.91 Zhao et al. (2009)
Starch Index 1000–1700
Discriminant analysis of partial least
squares
80.80% Menesatti et al. (2009)
Sugar content 650–1000 Least squares
regression 0.97 Guo et al. (2007)
Internal defects 400–1000
Discriminant analysis of partial least
squares
99% Ariana et al. (2006b)
Chilling injury 447–951 Nearest neighbours 93.30% Cheng et al. (2004)
Strawberry Peach Cucumbers
Internal defects and
colour 400–1000
Principal component
analysis 86% Ariana and Lu (2010)
Chilling injury 900-1000
Principal component analysis and Linear discriminant analysis
microprocessor with an operating system with which the user can develop software for image processing. Thus the camera also becomes a processing unit and does not need an additional computer. Furthermore, the use of the Internet has increased the availability of so-called IP cameras, which are able to transfer images to a remote computer via Internet.
In addition to traditional systems that acquire images using cameras, flatbed scanner shave also been used to get images of small objects such as nuts or leaves (MENESATTI et al., 2008), and even medical equipment for the analysis of the internal quality of fruit and vegetables, such as those based on X-ray or magnetic resonance (HERNÁNDEZ-SÁNCHEZ et al., 2007; MILCZAREK et al., 2009).
Regarding the format of the images, if these are to be stored for subsequent processing, the format that is stored may affect subsequent processing of the images. Compression formats such as the Joint Photographic Group (JPEG), take advantage of the inherent limitations of the human eye to discard non-appreciable information, which makes them useful in applications where the size of the storage memory is relevant (CUBERO, 2012). However, this format reduces the information available in the image and generates some noise, which may complicate subsequent image processing. The formats that do not reduce the image quality, such as the Tagged Image File Format (TIFF) or Bit Mapped Picture (BMP), are recommended for applications where such a loss of information is an important factor. In any case, online applications do not require the storage of images, but are acquired, processed and instantly discarded (CUBERO, 2012).
2.4 Image processing techniques
2.4.1 Colour space transformations
There are three aspects that determine colour, namely the type of emission source that irradiates an object, the physical properties of the object itself (which reflects the radiation consequently detected by the sensor), and the in-between medium (e.g., air or water) (MENESATTI et al., 2012). In general, a computer vision system captures the colour of each pixel within the image of the object using three colour sensors (or one sensor with three alternating filters) per pixel (FORSYTH and PONCE, 2003). The RGB model is the most often used colour model, in which each sensor captures the intensity of the light in the red (R), green (G) or blue (B) spectrum, respectively (LEÓN et al., 2006). However, the RGB model is device-dependent and not identical to the intensities of the CIE system. Another problem with the RGB model is that it is not a perceptually uniform space. The differences between colours (i.e., Euclidean Image spectrographs separate the reflection of a
narrow zone of the scene into its spectral components via a prism or grating, and project the spectral information to an image sensor, which usually consists of a CCD camera or linear scanning CMOS (KIM et al., 2001). A FSAO is an electronically adjustable band pass spectral filter formed of a glass which, when excited by an acoustic wave, refracts a certain ampleness and is thus is separated from the rest of the light spectrum .The wavelength of the light is separated based on the frequency of the acoustic signal applied by the glass, and the LCTF operation is based on the combination of Lyot filters. These filters consist of a sandwich structure comprising a liquid crystal sheet and a quartz sheet between two linear polarizers, the quartz sheet and the liquid crystal constituting a retarder. The main success of the Lyot filter is the electronic control of the process of interference between ordinary and extraordinary beams of the incident radiation, producing the desired frequency selectivity in the transmitted radiation (HECHT, 1998). A LCTF comprises a series of stacked Lyot filters, thus achieving the range and selectivity at the desired frequency. All these systems can be sensitive to approximately 2500 nm, and it is important that both the spectrograph or filter and the camera used are sensitive in the same spectral range.
Although there are several examples of the application of hyperspectral systems in other fields, their incorporation in commercial food product warehouses is very complicated, due to the high cost of the computational system required for the acquisition and processing of these images. Some applications include that developed by Nicolai et al. (2006) to find certain types of damage in apples using the infrared region, and that developed by Karimi et al. (2009), who studied the changes in reflectance (350 to 2500 nm) of avocados coated with various formulations.
nontrivial illuminant invariant description of a scene from an image taken under unknown lighting conditions, either by directly mapping the image to a standardized illuminant invariant representation, or by determining a description of the illuminant which can be used for subsequent colour correction of the image (BARNARD et al., 2002). The procedure of computational colour constancy includes two steps: estimating illumination parameters and using these parameters to get the colour of the objects under a known canonical light source. The first step, illumination estimation, is important in colour constancy computation. So far, a number of leading colour constancy algorithms have been proposed that focus on the illumination estimation. These algorithms can generally be divided into two major groups: unsupervised approaches and supervised ones. The algorithms falling into the first category include Max RGB, the grey world algorithm, Shades of grey (SoG), and Grey surface identification (GSI). The other colour constancy category includes the training-based solutions such as Bayesian colour constancy, Neural Network method and the support vector regression.
3 Applications in the inspection and control of quality characteristics
The ultimate purpose in many computer vision based inspection systems is to estimate one or several features of interest of the products at a particular time, and relate them to the consumer who appreciates quality. Other systems are designed to determine the evolution of the product in time in order to determine whether one particular treatment or process is valid or not. In most of these applications, image analysis is used to evaluate characteristics such as colour, size, shape, texture or the presence of damage (CUBERO, 2012).This review presents some of the research in computer vision for the external quality assessment of foods.
3.1 Colour
Colour is visually one of the most important parameters in define the quality of any food, and its evaluation has always been crucial and a theme of concern in the food industry as well as in food research and development. In this context the sensory properties of food such as its appearance and surface colour, which are the first parameters visually evaluated, consequently have a relationship with consumer acceptance or rejection of the product even before it enters the mouth. Currently, new tools are being used to measure changes in the colour characteristics of food, the computer vision technique being projected as an alternative to sensory evaluation. The efficient use of computer vision techniques to assess food colour and quality requires a calibration process based on absolute colour in a format of common distances) in the RGB space do not correspond to colour
differences as perceived by humans (PASCHOS, 2001). Standard RGB (sRGB; red, green, blue) and L*a*b* are commonly applied in quantifying standard food colours (MENESATTI et al., 2012). sRGB is an independent colour model device whose tri-stimulus values (sR, sG, sB) reproduce the same colour in different devices, and represent linear combinations of the CIE XYZ. It is therefore used to define the mapping between RGB (non-linear signals) from a computer vision system and a device-independent system such as CIE XYZ (MENDOZA et al., 2006). sRGB is calculated based on the D65 illumination conditions, RGB values measured by computer vision, and a power function with a gamma value of 2.4. The camera sensors (e.g., CCD or CMOS) generate output signals and the rendering is device-dependent, since the display device specifications have different ranges of colour. In order to overcome this problem, the sRGB values are often transformed into other colour systems such as L*a*b* (MENESATTI et al., 2012).
2.4.2 Colour calibration methods
The quality of digital image is principally defined by its reproducibility and accuracy; without reproducibility and accuracy of the images, any attempt to measure the colour or geometric properties is of little use (VAN POUCKE et al., 2010). In general, a computer vision camera employs a single array of light-sensitive elements on a CCD chip, with a filter array that allows some elements to see red (R), some green (G) and some blue (B). ‘White balance’ is carried out to measure relative intensities manually or automatically (MENDOZA et al., 2006). A digital colour image is then generated by combining three intensity images in the range from 0–255. Since they are device-dependent, the RGB signals produced by different cameras are different for the same scene. These signals will also change with time since they are dependent on the camera settings and scenes (VAN POUCKE et al., 2010).
Abdullah et al. (2006) transformed the HSI coordinates into RGB coordinates, and used the H component to classify starfruit into four maturity categories.
However, both RGB and HSI are non-uniform colour spaces. This means that the Euclidean distance between two colour points located in different regions of these spaces will not produce the same difference in perception as a standard observer. To try to solve this problem, uniform spaces were defined as the CIE L* a* b* and Hunter Lab (HUNTERLAB, 2001), which are usually used for colour comparisons (LEÓN et al., 2006). Mendoza et al. (2006) compared different colour spaces such as sRGB, the HSI and L* a* b* in terms of their suitability for colour quantification on curved surfaces, and showed the L* a* b* to be more appropriate.
Sometimes it is sufficient to use a single coordinate of the L*, a* b* to establish a classification of the fruit. Liming and Yanchao (2010) used the a* coordinate to classify strawberries into three colour categories. In comparison with human selection, the system based on image analysis successfully reached 89%. The hue angle and chroma are characteristics derived from the above mentioned uniform spaces. To analyze the colour of the mango, Kang and Trujillo (2008) quantified the effect of the curvature to calculate the hue angle and chroma, and demonstrated that the first one provided a valuable quantitative description of the colour and of the colour changes in batch like single mango with heterogeneous colours
It is frequently important to determine the colour of a fruit to determine subsequent postharvest treatments. For example, tangerines are frequently harvested when they are still green, and submit them to a de-greening treatment. In these cases, the fruit is stored in a chamber with a specific humidity and determined ethylene concentration. The duration of this treatment depends on the colour of the fruit at the time of harvesting, which is expressed as a standard colour index (JIMÉNEZ-CUESTA et al., 1981). In another investigation, Fathi et al. (2011) used image analysis to measure the influence of different osmotic treatments on the colour of kiwis. For this purpose, they converted the original RGB coordinates to L* a* b* to evaluate the colour differences. According to Xul et al. (2009), the colour of the skin frequently also reveals the symptoms of internal injuries in apples.
Computer vision systems also have a wide application in agronomical fields, a typical case being the estimation of crop yields. Okamoto and Lee (2009) were able to detect green citrus fruits on the tree between leaves with similar colours. For this purpose they used hyperspectral images in the range from 369 to 1042 nm. Safren et al. (2007) also proposed a method based on computer vision for the automatic estimation of crop yields of Golden delicious apples from hyperspectral images interchange for colour data, since knowledge of the image
characteristics could correlate better with product quality. Colour is one of the most important attributes in fruits and vegetables because it directly influences the consumer decision to accept or reject a particular product. Thus producers strive to prevent colour defects in the products that reach the market, and to ensure that the different batches of products (for example canned, bagged, etc.) show similar colours. In the industry, colour is measured using a colorimeter (HOFFMAN, 2000). The colour coordinates provided by these devices usually refer to the colour space of the International Commission of Illumination (CIE) 1931, and are denoted by X, Y and Z. Colorimeters are used to measure small regions or in applications where the sample has a uniform colour, and are not well adapted to the measurement of objects with heterogeneous colours (GARDNER, 2007). When it is necessary to measure the colour of larger areas or if the sample contains distinctly different colours, one must measure the colour in a different way. Image analysis could be an effective solution, since the camera provides images where the colours of the pixels are determined individually. It should be mentioned that whereas colorimeters are easy to calibrate devices, the calibration of image analysis depends on many factors and is more complex.
The colour of a pixel in an image is expressed by three coordinates in a colour space. The most widely used in computers and digital images are the spaces based on the primary colours red, green and blue. When the objects inspected have different colours, a simple relationship between them can frequently discriminate them, which saves processing time. For example, Blasco et al. (2009c) used the colour space to discriminate four categories of pomegranate arils and classify them in real time. The tests showed that a model based on discriminate analysis using RGB coordinates as the variables provided the same classification results as a thresholding carried out on the R/G, with success rates exceeding 90%.This latter method greatly reduced the processing time and was easy for an operator to grasp in the case of developing an industrial application.
= Z z
Zn (9)
Where Xn, Yn, Zn are tri-stimulus values of the specific white object, in this case using illuminant D65 (daylight) and an observer with the values shown in Equation 10.
= = =
Xn 95.047; Yn 100; Zn 108.883 (10)
The values for: var X; var Y;var Z, can then be calculated using Equations 11, 12 and 13.
> = 1/ 3 ≤ = +
si x 0.008856 var X (x) ; si x 0.008856 var X (7.787 * x) (16 / 116) (11)
> = 1/ 3 ≤ = +
si y 0.008856 var Y (y) ; si y 0.008856 var Y (7.787 * y) (16 / 116) (12)
> = 1/ 3 ≤ = +
si z 0.008856 var Z (z) ; si z 0.008856 var Z (7.787 * z) (16 / 116) (13)
Subsequently the values for L*, a* and b* can be calculated in the CIELab colour space, using equation 14 to calculate the lightness L*, equation 15 for the value of a* and equation 16 for the value of b*.
= −
L* (116 * var Y) 16 (14)
= −
a* 500 * (var X var Y) (15)
= −
b* 200(var Y var Z) (16)
3.2 Size and volume
The size is a characteristic of particular importance in the food industry as the cost of many products is directly related to their size. The estimate of this attribute in regular objects, such as spherical or nearly spherical fruits is relatively easy, but it becomes more complex in fruits and vegetables with irregular shapes. The variables used to estimate the size are area, perimeter, length and width. Due to irregularities in the shape of natural agricultural products, the orientation of the object relative to the camera has an important influence when these measurements are estimated by image analysis. For this reason, many authors combine information obtained from images taken at different angles between the object and the camera. For example, Blasco et al. (2003) estimated the size of Golden delicious apples acquiring four images of each fruit, and choosing the view in which the stem was located closer to the centroid (center of mass) of the object, considering that the current regulations require the equatorial diameter to be used as the measurement of size. Throop et al. (2005) measured the size of 14 varieties of apple while they were being transported by rollers, adjusting the speed of rotation and translation such that the images captured were of one full turn of each fruit. Thus the equatorial diameter and the area of the apples taken at different stages of growth. Bulanon et al. (2009)
pursued a similar objective applied to citrus fruit, although with a different approach, using a combination of images from the visible and thermal spectra, analyzed by two methods of image fusion. With this system they improved the detection of fruit and showed better performance as compared to the use of thermal imaging alone.
According to Saldaña et al. (2013), to convert the RGB colour space of an image obtained by a computer vision system, to the L* a* b* colour space, this must be done in two phases. The first phase involves the conversion from RGB to XYZ, and the second phase from XYZ to the CIELab colour space. As a first step, the RGB values must be normalized to rgb (values between 0 and 1) using Equations 1, 2 and 3 for each value of R, G and B respectively.
+
> = ≤ =
2.4
R R 0.055 R R
si 0.04045 r ; si 0.04045 r
255 1.055 255 12.92 (1)
+
> = ≤ =
2.4
G G 0.055 G G
si 0.04045 g ; si 0.04045 g
255 1.055 255 12.92 (2)
+
> = ≤ =
2.4
B B 0.055 B B
si 0.04045 b ; si 0.04045 b
255 1.055 255 12.92 (3)
Subsequently, using the matrix M for the D65-2ºilluminant-observer(Equation 4), the values are converted from rgb values to XYZ values. The D65-2° illuminant-observer was used because it is the standard recommended by the CIE since it is more adapted to the illumination used.
=
X r
Y 100 * [M] g
Z b
(4)
Where:
=
0.4124 0.3576 0.1805 [M] 0.2126 0.7152 0.0722 0.0193 0.1192 0.9505
(5)
Thus, developing Equation 4 and using matrix 5, the values for X, Y and Z are obtained from Equation 6.
= + +
= + +
= + +
X 100 * r * 0.4124 100 * g * 0.3572 100 * b * 0.1805 Y 100 * r * 0.2126 100 * g * 0.7152 100 * b * 0.0722 Z 100 * r * 0.0193 100 * g * 0.1192 100 * b * 0.9505 (6)
Subsequently the values for x, y, z, are obtained using Equations 7, 8 and 9 respectively.
= X x
Xn (7)
= Y y
3.3 Shape
The consumer is always more prone to purchase fruits or vegetables showing their characteristic shapes. Products with deformities or strange shapes cannot be traded or have to be sold at lower prices. Therefore the automatic quality control of these products must take this fact into account (CUBERO, 2012).The shape is a subjective measurement that can be estimated from the measurements of other features, and is frequently used to categorize the fruits.
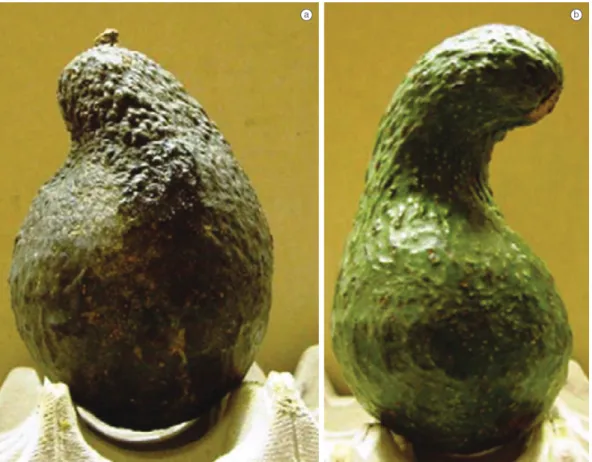
Although there are many possibilities offered by new technologies to accurately measure the intrinsic quality of food products, human beings are more flexible and adaptable at evaluating and assessing the quality factors than the machines (PAULUS et al., 1997). Human visual inspection is invaluable in the classification operations of some food products (Figure 3).Computer vision is used in the construction of explicit and significant descriptions of physical properties, from images (BALLARD and BROWN, 1982).
There are some applications where computer vision is the only alternative, for example when wavelengths outside human sensibility, such as the NIR or X-rays, are used. Also, the increase in resolution of computer vision systems allows one to automatically detect human attributes that we cannot see (DUBOIS and GLANZ, 1986). To complete the picture, developed countries currently were calculated. Subsequently the apple was assumed
to be an ellipse and the height estimated from its main axis, using this data to obtain the orientation of the fruit with respect to the camera.
The volume was also used as an indirect measurement of size, although it is a particularly difficult challenge to estimate the volume of natural objects starting from a flat image. According to Koc (2007), in the scientific literature one of the most frequently mentioned ways of estimating the volume of food products that present symmetry around their axes, is by using computer vision to subdivide the objects into different partitions. One method consists of obtaining the contour of the object from a flat projection and divided it into vertical sections of a predetermined width. Once this is done half of the height of each vertical section is rotated around the axis X, in order to obtain the width of the slices, for which it is simple to estimate the volume. The volumes of all the slices are then added up to estimate the total volume of the object. Koc (2007) determined the size of watermelons using this theory, and compared the results with those obtained using the traditional method of water displacement, concluding that the difference between the volumes estimated by imaging and by water displacement were not statistically significant.
coefficients of Fourier harmonics to describe the size, shape and orientation of each fruit. Menesatti et al. (2008) also used background light to estimate the profile of hazelnuts to discriminate between different cultivars. They used the Fourier ellipse analysis to extract features to estimate the shape using a partial least squares (PLS) model. Antonucci et al. (2012) carried out a similar work to discriminate between different varieties of almond.
The determination of the shape of horticultural products is of interest for a number of reasons, which are detailed in the following sentences: for the improvement and selection of cultivars since the shape of the fruit is necessary for a number of different purposes such as the description of the cultivar in the evaluation of consumer preferences, research into the heritability of the traits of shape in fruits (RASHIDI and GHOLAMI, 2008), analysis of the distribution of mechanical stress in the skin of a fruit crop (CONSIDINE and BROWN, 1981), and the characteristics that determine the relationship between the shape of the fruit and seed yield (NERSON and PARIS, 2001).The sugar beet crop relates not only to the root form and imperfect levels in the soil during harvesting (MILFORD, 1973) but also to the sucrose content (TSIALTAS and MASLARIS, 2010). Another aspect is to determine the relationship between the shape and the maturity of the fruit in products where the shape is used as an index of maturity. The maturity of the mangoin some cultivars can be evaluated by examining the position and angle that the shoulder makes with the stem and its attachment to the fruit (THOMPSON, 1996). Peaches and tangerines are considered mature when the fruit shoulders and suture are well developed and filled in, although this criterion has to be accompanied by other indicators such as skin colour (CRISOSTO, 1994). The angle of bananas decreases when they mature (STUDMAN, 2001). The shape of the folds or lobes in sweet peppers is directly related to the quality and health status (NOORDAM, 2005). The compacting of the heads in broccoli and cauliflower can be used as another maturity index, since the broccoli head should ideally have a compact form. The compact form is preferred for the heads because in this case the dew and rainwater drain from the heads, instead of promoting the growth of fungi and bacteria (MAYBERRY, 2000). In the food industry, for example, due to the heat transfer coefficients, the mass depends on the shape and surface area of the object that is being analyzed (SENADEERA et al. 2003; GOÑI et al., 2007). Vegetable processing plants prefer the product to be homogeneous in order to minimize waste and obtain a final product with a uniform shape, which fits in the package well. Manufacturers of French fried potatoes (chips) prefer tubers with oval and elongated shapes, a length of at least 50 mm and a diameter in the range from 40 to 60 mm (NIVAP, 2010). The tomato processing industries are interested in the development of varieties with an have to confront the absence of manual labour willing to
accept seasonal work and the low wages typically paid by a classification or packing installation. As a result, over the last two decades, the inspection of fresh fruits and vegetables using computer vision has been gaining ground over its counterpart, the use of manual labour, in most food industries in the developed countries. Today, on-line classification systems of fruits based on computer vision systems are common in the U.S. and European countries, Japan, Korea (KONDO, 2010), Canada, Australia and New Zealand. The parameters measured on-line by the computer vision system are the size, colour, shape and surface defects, such as spots or lesions. To give a complete overview of the technology it should be noted that at present the most promising branch of computer vision is the use of hyperspectral imaging, which combines spatial and spectral computer vision systems with the use of the spectrograph (KIM et al., 2007).
The descriptions of images made by man are usually abstract or artistic, not quantitative. As a result, identification of the shape of a fruit is easy for the brain, but difficult for a computer. The shapes of manufactured objects can be described using precise mathematical terms, while irregular shapes, such as biological products can be approximated by fitting to a curve. For example, Beyer et al. (2002) suggested the possibility of representing the two dimensional (2D) shape of a cherry by the cardioid, a special case of the Limaçon of Pascal. However, fruit sorting is not as strict as the inspection of industrial parts, so that in many situations it is necessary to find a curve that matches a given fruit, especially considering that the process of finding a curve takes time (YING et al., 2003). For example, Liming and Yanchao (2010) defined four classes of strawberry shape: long-conical, square, conic and rounded. To estimate the shape of a strawberry, linear sequences (widths) are extracted from the contour of the fruit, and the length normalizing to eliminate the influence of size, in order to use the k-means method to assign each fruit to a respective class. Circularity is another feature which has been used to determine the shape of fruits (UNAY and GOSSELIN, 2007). Sadrnia et al. (2007) used the relationship of aspect (length by width) to estimate the shape of watermelons. Furthermore, they used the correlation coefficients of the parameters of estimated mass, volume, size, density, sphericity coefficient and average diameter to generate a model to determine whether a particular fruit is standard or not.
of citrus, using the RGB values of each pixel and its neighbours (in 3×3 and 5×5 windows). With this method they managed to detect 91.5% of all the defects in the four varieties of oranges and tangerines, with only 3.5% of false detections.
The co-occurrence matrix of colour and its mathematical characteristics represent one of the most highly used methods to describe texture. Pydipati et al. (2006) used this method to determine whether the texture from HSI colour characteristics could be used in conjunction with other statistical information to identify diseased and healthy leaves from citrus trees, under laboratory conditions. They evaluated samples of healthy citrus leaves and others affected with melanosis and scabies. Zhao et al. (2009) described a similar method to differentiate between healthy skin and five different types of skin damage on images acquired from grapefruit skin with a microscope. Menesatti et al. (2009) used the contrast, homogeneity, second angular moment and correlation of the co-occurrence matrix of gray levels to evaluate the starch content of apples, which is directly related to their maturity. To estimate this they used images from the visible spectrum and the NIR spectrum in the 1000-1700 nm range. Elmasry et al. (2007) evaluated the maturity of strawberries based on pseudo-RGB images (constructed from monochrome images at 450, 500 and 650 nm). Ripe fruits had a rougher texture than green ones.
Other less conventional methods using fractal texture characteristics derived from the Fourier spectral analysis, and an example of this was described by Quevedo et al. (2008), who supervised the ripening of bananas detecting the senescence of skin blemishes.
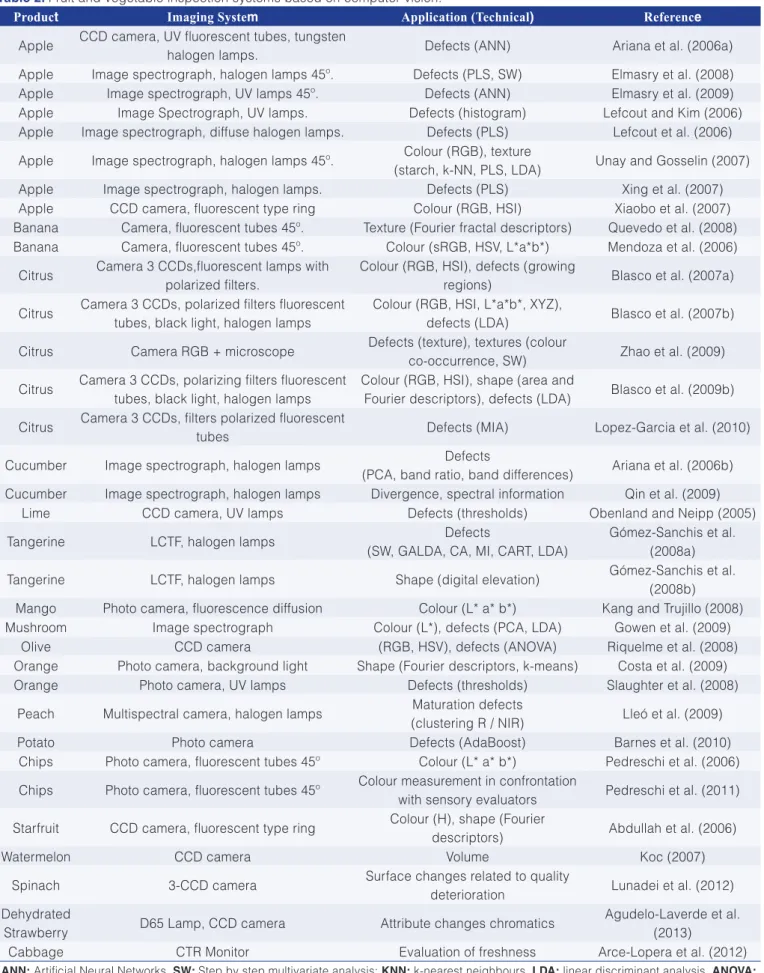
Table 2 summarizes the most recent works related to inspection systems for food products using computer vision.
almost square shape, in order to pack more efficiently, although some companies are interested in developing extremely elongated tomatoes with a cucumber shape. These fruits would be of advantage in the preparation of tomato slices for burgers, where less extremities would have to be discarded (ESPINOZA, 2003).
3.4 Texture
The perception of a colour by a computer vision system is different if the surfaces of the objects have different textures. For this reason, the study of the texture is often integrated into colour difference studies, including those used to detect the presence of external defects. The texture can play an important role in image segmentation, since it is an effective tool for troubleshooting in the recognition of standards to automatically inspect fruits and vegetables.
Image segmentation is based on techniques oriented to the pixels (those that process the pixels individually, without considering the neighbours), and is very sensitive to noise or local particularities at the scene. On the other hand the texture-based segmentation of regions of interest requires more complex algorithms besides analyzing the colour, since it also takes into account the spatial relationships between neighbouring pixels to characterize the different regions of an image and detect changes between them (BLASCO et al., 2007a).
Often fruits belonging to the same variety have a high rate of variability in texture and colour, complicating the image analysis. Figure 4 illustrates the wide variation of colours and textures in images of oranges from the same cultivar (cv. “Valencia”). Lopez-Garcia et al. (2010) proposed a method that combines colour and texture information in the Principal Component Analysis (PCA) model for the detection of skin defects in four varieties
Table 2.Fruit and vegetable inspection systems based on computer vision.
Product Imaging System Application (Technical) Reference
Apple CCD camera, UV fluorescent tubes, tungsten
halogen lamps. Defects (ANN) Ariana et al. (2006a)
Apple Image spectrograph, halogen lamps 45º. Defects (PLS, SW) Elmasry et al. (2008) Apple Image spectrograph, UV lamps 45º. Defects (ANN) Elmasry et al. (2009) Apple Image Spectrograph, UV lamps. Defects (histogram) Lefcout and Kim (2006) Apple Image spectrograph, diffuse halogen lamps. Defects (PLS) Lefcout et al. (2006)
Apple Image spectrograph, halogen lamps 45º. Colour (RGB), texture
(starch, k-NN, PLS, LDA) Unay and Gosselin (2007) Apple Image spectrograph, halogen lamps. Defects (PLS) Xing et al. (2007) Apple CCD camera, fluorescent type ring Colour (RGB, HSI) Xiaobo et al. (2007) Banana Camera, fluorescent tubes 45º. Texture (Fourier fractal descriptors) Quevedo et al. (2008) Banana Camera, fluorescent tubes 45º. Colour (sRGB, HSV, L*a*b*) Mendoza et al. (2006)
Citrus Camera 3 CCDs,fluorescent lamps with polarized filters.
Colour (RGB, HSI), defects (growing
regions) Blasco et al. (2007a)
Citrus Camera 3 CCDs, polarized filters fluorescent tubes, black light, halogen lamps
Colour (RGB, HSI, L*a*b*, XYZ),
defects (LDA) Blasco et al. (2007b)
Citrus Camera RGB + microscope Defects (texture), textures (colour
co-occurrence, SW) Zhao et al. (2009)
Citrus Camera 3 CCDs, polarizing filters fluorescent tubes, black light, halogen lamps
Colour (RGB, HSI), shape (area and
Fourier descriptors), defects (LDA) Blasco et al. (2009b)
Citrus Camera 3 CCDs, filters polarized fluorescent
tubes Defects (MIA) Lopez-Garcia et al. (2010)
Cucumber Image spectrograph, halogen lamps Defects
(PCA, band ratio, band differences) Ariana et al. (2006b) Cucumber Image spectrograph, halogen lamps Divergence, spectral information Qin et al. (2009)
Lime CCD camera, UV lamps Defects (thresholds) Obenland and Neipp (2005)
Tangerine LCTF, halogen lamps Defects
(SW, GALDA, CA, MI, CART, LDA)
Gómez-Sanchis et al. (2008a)
Tangerine LCTF, halogen lamps Shape (digital elevation) Gómez-Sanchis et al. (2008b) Mango Photo camera, fluorescence diffusion Colour (L* a* b*) Kang and Trujillo (2008) Mushroom Image spectrograph Colour (L*), defects (PCA, LDA) Gowen et al. (2009)
Olive CCD camera (RGB, HSV), defects (ANOVA) Riquelme et al. (2008)
Orange Photo camera, background light Shape (Fourier descriptors, k-means) Costa et al. (2009) Orange Photo camera, UV lamps Defects (thresholds) Slaughter et al. (2008)
Peach Multispectral camera, halogen lamps Maturation defects
(clustering R / NIR) Lleó et al. (2009)
Potato Photo camera Defects (AdaBoost) Barnes et al. (2010)
Chips Photo camera, fluorescent tubes 45º Colour (L* a* b*) Pedreschi et al. (2006)
Chips Photo camera, fluorescent tubes 45º Colour measurement in confrontation
with sensory evaluators Pedreschi et al. (2011)
Starfruit CCD camera, fluorescent type ring Colour (H), shape (Fourier
descriptors) Abdullah et al. (2006)
Watermelon CCD camera Volume Koc (2007)
Spinach 3-CCD camera Surface changes related to quality
deterioration Lunadei et al. (2012) Dehydrated
Strawberry D65 Lamp, CCD camera Attribute changes chromatics
Agudelo-Laverde et al. (2013)
Cabbage CTR Monitor Evaluation of freshness Arce-Lopera et al. (2012)
ANN: Artificial Neural Networks, SW: Step by step multivariate analysis; KNN: k-nearest neighbours, LDA: linear discriminant analysis, ANOVA:
fresh-cut starfruits (Averrhoa carambola L.) using automated machine vision system. Journal of Food Engineering, Essex, v. 76, n. 4, p. 506-523, 2006. http://dx.doi.org/10.1016/j. jfoodeng.2005.05.053.
AGUDELO-LAVERDE, L. M.; SCHEBOR, C.; BUERA, M. D. P. Water content effect on the chromatic attributes of dehydrated strawberries during storage, as evaluated by image analysis,
Food Science and Technology, London, v. 55, n. 2, p. 157-152, 2013. http://dx.doi.org/10.1016/j.lwt.2012.06.022
ALEIXOS, N.; BLASCO, J.; NAVARRO, F.; MOLTO, E. Multispectral inspection of citrus in real-time using machine vision and digital signal processors. Computers and Electronics in Agriculture, Netherlands, v. 33, n. 2, p. 121-137, 2002. http://dx.doi. org/10.1016/S0168-1699(02)00002-9
ANTONUCCI, F.; COSTA, C.; PALLOTTINO, F.; PAGLIA, G.; RIMATORI, V.; DE GIORGIO, D.; MENESATTI, P. Quantitative method for shape description of almond cultivars (Prunusamygdalus batsch). Food and Bioprocess Technology, New York, v. 5, n. 2, p. 768-785, 2012. http://dx.doi.org/10.1007/ s11947-010-0389-2
ARCE-LOPERA, C.; MASUDA, T.; KIMURA, A.; WADA, Y.; OKAJIMA, K. Luminance distribution as a determinant for visual freshness perception: evidence from image analysis of a cabbage leaf. Food Quality and Preference, Barking, v. 27, n. 2, p. 202-207, 2012. http://dx.doi.org/10.1016/j. foodqual.2012.03.005
ARIANA, D.; GUYER, D.; SHRESTHA, B. Integrating multispectral reflectance and fluorescence imaging for defect detection on apples. Computers and Electronics in Agriculture, Netherlands, v. 50, n. 2, p. 148-161, 2006a. http://dx.doi. org/10.1016/j.compag.2005.10.002.
ARIANA, D.; LU, R.; GUYER, D. Near-infrared hyperspectral reflectance imaging for detection of bruises on pickling cucumbers. Computers and Electronics in Agriculture, Netherlands, v. 53, n. 2, p. 60-70, 2006b. http://dx.doi. org/10.1016/j.compag.2006.04.001.
ARIANA, D. P.; LU, R. Evaluation of internal defect and surface color of whole pickles using hyperspectral imaging. Journal of Food Engineering, Essex, v. 96, n. 4, p. 583-590. 2010. http:// dx.doi.org/10.1016/j.jfoodeng.2009.09.005.
BALLARD, D.; BROWN, C. Computer Vision. New Jersey: Prentice-Hall, 1982. p. 252-253.
BARNARD, K.; CARDEI, V.; FUNT, B. A Comparison of computational color constancy algorithms e part i: methodology and experiments with synthesized data. IEEE Transactions on Image Processing, Piscataway, v. 11, n. 9, p. 972-984, 2002.
BARNES, M.; DUCKETT, T.; CIELNIAK, G.; STROUD, G.; HARPER, G. Visual detection of blemishes in potatoes using minimalist boosted classifiers. Journal of Food Engineering,
4 Conclusions
The use of technology based on computer vision generates substantial improvements in the quality inspection of processed and unprocessed fruits and vegetables, due to the capabilities of this system in overcoming the limitations of human capacity, allowing for a long-term evaluation of the processes objectively or of appreciating the events taking place outside the visible electromagnetic spectrum. Hyperspectral systems provide information on certain components or damage that may be perceived only at certain wavelengths, and can be used as a tool to develop new computer vision systems adapted for particular purposes. In addition, the online sorting systems allows one to inspect large quantities of fruits or vegetables individually and provide statistics on the batch inspected.
Moreover, the UV and NIR acquisition systems are becoming more easily available. Smart cameras that incorporate image processors are very common in other fields of research and their use is likely to be extended in coming years. IP cameras will also be included soon in remote monitoring applications or inspections based on the web of agrifood processes, including the storage of fruits and vegetables. There is also a stunning development of more powerful image processing techniques causing a gradual increase in computational capacity that encourages the development of more powerful software for image processing in real time. Adaptive algorithms have given promising results in other fields. New advances in pattern recognition and massive data processing should be included in future applications of computer vision to enhance the robustness and accuracy of decisions. There are also new lighting systems that improve the results of image processing with advances in lighting systems. This development should be both spectral and spatial, as it must be able to cover the spectrum analyzed in a uniform manner. LEDs will lead to a great technological leap, contributing both from the point of view of energy efficiency and from the wide variety of solutions they tackle, especially for field applications. Regarding the inspection of processed fruit, few studies have yet been carried out on the application of computer vision, probably due to the low economic interest with respect to fresh fruit and the complexity of these processed fruits. However, the current status of the inspection systems opens new possibilities for the creation of complex and robust algorithms capable of running real-time inspection lines. It is important to begin to develop these algorithms and determine appropriate decision methods adapted to the specific problems of these fruits.
References
hyperspectral image feature extraction for cucumber chilling damage inspection. Transactions of the ASAE, St. Joseph, v. 47, n. 4, p. 1313-1320, 2004.
CONSIDINE, J.; BROWN, K. Physical aspects of fruit growth: theoretical analysis of distribution of surface growth forces in fruit in relation to cracking and splitting. Plant Physiology, Minneapolis, v. 68, n. 2, p. 371-376, 1981.
COSTA, C.; MENESATTI, P.; PAGLIA, G.; PALLOTTINO, F.; AGUZZI, J.; RIMATORI, V.; RUSSO, G.; RECUPERO, S.; RECUPERO, G. Quantitative evaluation of Tarocco sweet orange fruit shape using optoelectronic elliptic Fourier based analysis. Postharvest Biology and Technology, Amsterdam, v. 54, n. 1, p. 38-47, 2009. http://dx.doi.org/10.1016/j. postharvbio.2009.05.001
CRISOSTO, C. Stone fruit maturity indices: a descriptive review.
Postharvest News and Information, United Kingdom, v. 5, n. 6, p. 65N-68N, 1994.
CUBERO, S.; ALEIXOS, N.; MOLTO, E.; GOMEZ-SANCHIS, J.; BLASCO, J. Advances in machine vision applications for automatic inspection and quality evaluation of fruits and vegetables. Food and Bioprocess Technology, New York, v. 4, n. 4, p. 487- 504, 2011. http://dx.doi.org/10.1007/s11947-011-0585-8
CUBERO, E. Diseño e Implementación de Nuevas Tecnologías Basadas en Visión Artificial para la Inspección no Destructiva de la Calidad de Fruta en Campo y Mínimamente Procesada. 2012. 212p. Tiesis (Tesis Doctoral)- Departamento de Expresión Gráfica Arquitectónica, Universidad Politécnica de Valencia. Valencia, 2012.
DU, C.; SUN, D. Recent developments in the applications of image processing techniques for food quality evaluation.
Trends in Food Science & Technology, Cambridge, v. 15, n. 5, p. 230-249, 2004. http://dx.doi.org/10.1016/j.tifs.2003.10.006.
DU, C.; SUN, D. Learning techniques used in computer vision for food quality evaluation: a review. Journal of Food Engineering, Essex, v. 72, n. 1, p. 39-55, 2006. http://dx.doi.org/10.1016/j. jfoodeng.2004.11.017.
DUBOIS, S.; GLANZ, F. An autoregressive model approach to two-dimensional shape classification. IEEE Transactions on Pattern Analysis and Machine Intelligence, New York, v. 8, n. 1, p. 55-66, 1986. 10.1109/TPAMI.1986.4767752.
ELMASRY, G.; WANG, N.; ELSAYED, A.; NGADI, M. Hyperspectral imaging for nondestructive determination of some quality attributes for strawberry. Journal of Food Engineering, Essex, v. 81, n. 1, p. 98-107, 2007. http://dx.doi.org/10.1016/j. jfoodeng.2006.10.016
ELMASRY, G.; WANG, N.; VIGNEAULT, C.; QIAO, J.; ELSAYED, A. Early detection of apple bruises on different background colors using hyperspectral imaging. Food Science and Technology, Essex, v. 98, n. 3, p. 339-346, 2010. http://dx.doi.org/10.1016/j.
jfoodeng.2010.01.010.
BEI, L.; DENNIS, G.; MILLER, H.; SPAINE, T.; CARNAHAN, J. Acousto-optic uunable filters: fundamentals and applications as applied to chemical analysis techniques. Progress in Quantum Electronics, United Kingdom, v. 28, n. 2, p. 67-87, 2004. http:// dx.doi.org/10.1016/S0079-6727(03)00083-1
BEYER, M.; HAHN, R.; PESCHEL, S., HARZ, M., KNOCHE, M. Analysing fruit shape in sweet cherry (Prunus avium L.). Scientia Horticulturae, Amsterdam,v. 96, n. 1-4, p. 139-150, 2002. http:// dx.doi.org/10.1016/S0304-4238(02)00123-1
BLASCO, J.; ALEIXOS, N.; MOLTO, E. Machine vision system for automatic quality grading of fruit. Biosystems Engineering, London, v. 85, n. 4, p. 415-423, 2003. http://dx.doi.org/10.1016/ S1537-5110(03)00088-6
BLASCO, J.; ALEIXOS, N.; MOLTO, E. Computer vision detection of peel defects in citrus by means of a region oriented segmentation algorithm. Journal of Food Engineering, Essex, v. 81, n. 3, p. 535-543, 2007a. http://dx.doi.org/10.1016/j. jfoodeng.2006.12.007.
BLASCO, J.; ALEIXOS, N.; GOMEZ, J.; MOLTO, E. Citrus sorting by identification of the most common defects using multispectral computer vision. Journal of Food Engineering, Essex, v. 83, n. 3, p. 384-393, 2007b. http://dx.doi.org/10.1016/j. jfoodeng.2007.03.027.
BLASCO, J.; ALEIXOS, N.; CUBERO, S.; GÓMEZ-SANCHÍS, J.; MOLTÓ, E. Automatic sorting of satsuma (Citrus unshiu) segments using computer vision and morphological features. Computers and Electronics in Agriculture, Netherlands, v. 66, n. 1, p. 1-8, 2009a. http://dx.doi.org/10.1016/j.compag.2008.11.006.
BLASCO, J.; ALEIXOS, N.; GOMEZ-SANCHIS, J.; MOLTO, E. Recognition and classification of external skin damage in citrus fruits using multispectral data and morphological features.
Biosystems Engineering, London, v. 103, n. 2. p. 137-145, 2009b. http://dx.doi.org/10.1016/j.biosystemseng.2009.03.009.
BLASCO, J.; CUBERO, S.; GOMEZ-SANCHIS, J.; MIRA, P.; MOLTO, E. Development of a machine for the automatic sorting of pomegranate (Punica granatum) arils based on computer vision.
Journal of Food Engineering, Essex, v. 90, n. 1, p. 27-34, 2009c. http://dx.doi.org/10.1016/j.jfoodeng.2008.05.035.
BROSNAN, T.; SUN, D. Improving quality inspection of food products by computer vision - a review. Journal of Food Engineering, Essex, v. 61, n. 1, p. 3-16, 2004. http://dx.doi. org/10.1016/S0260-8774(03)00183-3
BULANON, D.; BURKS, T.; ALCHANATIS, V. Image fusion of visible and termal images for fruit detection. Biosystems Engineering, London, v. 103, n. 1, p. 12-22, 2009. http://dx.doi. org/10.1016/j.biosystemseng.2009.02.009.
GUNASEKARAN, S. Computer vision technology for food quality assurance. Trends in Food Science & Technology, Cambridge, v. 7, n. 8, p. 245-256, 1996. http://dx.doi.org/10.1016/0924-2244(96)10028-5
GUO, F.; CAO, Q.; NAGATA, M.; Tallada, J. G. NIR hyperspectral imaging measurement of sugar content in peach using PLS regression. Journal of Shanghai Jiao Tong University (Science), Shanghai , v. E-12, n. 5, p. 597-601, 2007.
HECHT, E. Optics. 3 ed. Massachusetts: Addison Wesley Longman, 1998. 694 p.
HERNÁNDEZ-SÁNCHEZ, N.; HILLS, B.; BARREIRO, P.; MARIGHETO, N. A NMR study on internal browning in pears. Postharvest Biology and Technology, Amsterdam, v. 44, n. 3, p. 260-270, 2007. http://dx.doi.org/10.1016/j. postharvbio.2007.01.002.
HOFFMAN, G. CIE Colour Space, 2000. Disponível em: <http:// www.fho-emden.de/~hoffmann /ciexyz29082000.pdf>. Acesso em: 03 janeiro 2013.
HOFSHI, R.; ARPAIA, M. Avocado fruit abnormalities and defects revisited. California Avocado Society Yearbook, Temecula, v. 86, p. 147-162, 2002.
HUNTERLAB. Application Note: Hunter L,a,b Versus CIE 1976 L*a*b*. HunterLab: The color management Company, v. 13, n. 2, 2001. Disponível em: <http://www.hunterlab.com/appnotes/ an02_01.pdf>. Acesso em: 03 janeiro 2013.
HURLBERT, A. Colour constancy. Current Biology, London, v. 17, n. 21, p. R906-R907. 2007.
JACKMAN, P.; SUN, D.; ALLEN, P. Recent advances in the use of computer vision technology in the quality assessment of fresh meats. Trends in Food Science & Technology, Cambridge, v. 22, n. 4, p. 185-197, 2011. http://dx.doi.org/10.1016/j. tifs.2011.01.008.
JIMÉNEZ-CUESTA, M.; CUQUERELLA, J.; MARTINEZ-JAVEGA, J. Determination of a color index for citrus fruit degreening.
Proceedings of the International Society of Citriculture, Tokyo, v. 2, p. 750-753, 1981.
KANG, S.; TRUJILLO, F. Colour vision system evaluation of bicolour fruit: a case study with ‘B74’ mango. Postharvest Biology and Technology, Amsterdam, v. 49, n. 1, p. 77-85, 2008. http://dx.doi.org/10.1016/j.postharvbio.2007.12.011.
KARIMI, Y.; MAFTOONAZAD, N.; RAMASWAMY, H.; PRASHER S.; MARCOTTE, M. Application of hyperspectral technique for color classification avocados subjected to different treatments.
Food and Bioprocess Technology, New York, v. 5, n. 1, p. 252-264, 2009.
KIM, M.; CHEN, Y.; MEHL, P. Hyperspectral reflectance and fluorescence imaging system for food quality and safety.
Transactions of the ASAE, St. Joseph, v. 44, n. 3, p. 721-729, 2001.
London v. 41, n. 2, p. 337-345, 2008. http://dx.doi.org/10.1016/j. lwt.2007.02.022
ELMASRY, G.; WANG, N.; VIGNEAULT, C. Detecting chilling injury in Red Delicious apple using hyperspectral imaging and neural networks. Postharvest Biology and Technology, Amsterdam, v. 52, n. 1, p. 1-8, 2009. http://dx.doi.org/10.1016/j. postharvbio.2008.11.008
ESPINOZA, M. Researcher Seeks to Solve Tomato Shape Riddle, Develop new Varieties. Ohio State University Extension, 2003. Disponível em: <http://www.ag.ohio-state.edu/~news/ story.php?id=2673>. Acesso em: 03 janeiro 2013.
EVANS, M.; THAI, C.; GRANT, J. Development of a spectral imaging system based on a liquid crystal tunable filter.
Transactions of the ASAE, St. Joseph, v. 41, n. 6, p. 1845-1852, 1998.
FATHI, M.; MOHEBBI, M.; ALIRAZAVI, S. Application of image analysis and artificial neural network to predict mass transfer kinetics and color changes of osmotically dehydrated kiwifruit.
Food and Bioprocess Technology, New York, v. 4, n. 8, p. 1357-1366, 2011.
FERNANDEZ, L.; CASTILLERO, C.; AGUILERA, J. An application of image analysis to dehydration of apple discs. Journal of Food Engineering, Essex, v. 67, n. 1-2, p. 185-193, 2005. http://dx.doi. org/10.1016/j.jfoodeng.2004.05.070
FORSYTH, D.; PONCE, J. Computer Vision: A Modern Approach. New Jersey: Prentice Hall. 2003. p. 720.
GARDNER, J. Comparison of calibration methods for tristimulus colorimeters. Journal of Research of the National Institute of Standards and Technology, Gaithersburg, v. 112, n. 3, p. 129- 138, 2007. http://www.nist.gov/jres.
GÓMEZ-SANCHIS, J.; GOMEZ-CHOVA, L.; ALEIXOS, N.; CAMPS-VALLS, G.; MONTESINOS, C.; MOLTO, E.; BLASCO, J. Hyperspectral system for early detection of rottenness caused by Penicillium digitatum in mandarins. Journal of Food Engineering, Essex, v. 89, n. 1, p. 80-86, 2008a. http://dx.doi. org/10.1016/j.jfoodeng.2008.04.009
SANCHIS, J.; MOLTÓ, E.; CAMPS-VALLS, G.; GÓMEZ-CHOVA, L.; ALEIXOS, N.; BLASCO, J. Automatic correction of the effects of the light source on spherical objects. An application to the analysis of hyperspectral images of citrus fruits. Journal of Food Engineering, Essex, v. 85, n. 2, p. 191-200, 2008b. http://dx.doi.org/10.1016/j.jfoodeng.2007.06.036
GOÑI, S.; PURLIS, E.; SALVADORI, V. Three-dimensional reconstruction of irregular foodstuffs. Journal of Food Engineering, Essex, v. 82, n. 4, p. 536-547, 2007. http://dx.doi. org/10.1016/j.jfoodeng.2007.03.021