NUMERICAL PREDICTION OF THERMAL AND DYNAMIC
CHARACTERISTICS OF A FIRE-INDUCED CEILING-JET
Mohamed Seddik Khetata
Final Report of the Thesis Presented to the
School of Technology and Management
Polytechnic Institute of Bragança
To the Fulfilment of the Requirements for the Master of Science Degree in
Industrial Engineering
(Mechanical Engineering branch)
NUMERICAL PREDICTION OF THERMAL AND DYNAMIC
CHARACTERISTICS OF A FIRE-INDUCED CEILING-JET
Mohamed Seddik Khetata
Final Report of the Thesis Presented to the
School of Technology and Management
Polytechnic Institute of Bragança
To the fulfilment of the Requirements for the Master of Science Degree in
Industrial Engineering
(Mechanical Engineering branch)
Supervisor at IPB: Prof.Dr.Paulo Alexandre Gonçalves Piloto Supervisor at UHBC: Prof.Dr. Abdallah Benarous
ACKNOWLEDGMENT
My thanks go especially to my parents Ahmad Khetata and HakimaBoumaza who supported me from the beginning and without their i would not be where i am today.
I would like to thank my major professor at IPB, Dr Paulo Alexandre Gonçalves Piloto for his expertise and guidance and his important advices not just in my work even in all domains of my life experience in Portugal. I must also express my gratitude to professor Luis Mesquita and all the staff of the Instituto Politécnico de Bragança (IPB) for all the facilities provided for allowing studies in perfect conditions. Special thanks to Dr Augusta Mata for her pedagogic and social assistance.
My kind acknowledgements to my supervisor at the Hassiba Benbouali University (UHBC) of Chlef (Algeria), Pr Abdallah Benarous for his support and guidance and all the key persons of the ERASMUS+ program, especially Pr. Dr Lamri Belkacem and Mr Kada Abdelhak. A special thanks to Pr. Dr Mahmoudi Hacene from UHBChlef.
ABSTRACT (EN)
The aim of this thesis is to test the ability of some correlative models such as Alpert correlations on 1972 and re-examined on 2011, the investigation of Heskestad and Delichatsios in 1978, the correlations produced by Cooper in 1982, to define both dynamic and thermal characteristics of a fire induced ceiling-jet flow. The flow occurs when the fire plume impinges the ceiling and develops in the radial direction of the fire axis. Both temperature and velocity predictions are decisive for sprinklers positioning, fire alarms positions, detectors (heat, smoke) positions and activation times and back-layering predictions. These correlative models will be compared with a 3D numerical simulation software CFAST. For the results comparison of temperature and velocity near the ceiling. These results are also compared with a Computational Fluid Dynamics (CFD) analysis, using ANSYS FLUENT.
Key words
ABSTRACT (PT)
O objetivo desta tese é testar a capacidade de alguns modelos de correlação, tais como o modelo de Alpert definido em 1972 e redefinido em 2011, a investigação de Heskestad e Delichatsios em 1978 e as correlações produzidas por Cooper em 1982, para definir as características dinâmicas e térmicas de um fluxo de gases tipo jato produzido junto ao teto induzido por fogo. O fluxo ocorre quando a chama de fogo atinge o teto e se desenvolve na direção radial em relação ao eixo do fogo. Ambas as previsões de temperatura e velocidade são decisivas para posicionamento de “sprinklers”, posicionamento de detetores de incêndio, posicionamento de detetores de calor e fumo, tempos de ativação de alarmes e previsões de estratificação de camadas de escoamento. Estes modelos correlativos serão comparados com um modelo 3D de um programa de simulação numérica CFAST, para a comparação dos resultados de temperatura e da velocidade perto do teto. Estes resultados são ainda comparados uma análise de dinâmica de fluidos computacional CFD, utilizando ANSYS FLUENT.
Palavras chave
INDEX
ACKNOWLEDGMENT ... I ABSTRACT (EN) ... III ABSTRACT (PT) ... V INDEX ... VII LIST OF FIGURES ... XI LIST OF TABLES ... XIII LIST OF TABLES OF ANNEX A ... XIII LIST OF TABLES OF ANNEX B ... XIII LIST OF TABLES OF ANNEX C ... XIII LIST OF TABLES OF ANNEX D ... XIV NOTATION ... XV
1- INTRODUCTION ... 1
1.1- State of the art ... 1
1.2- Ceiling jet fires ... 11
1.2.1- Fire plume characteristics ... 12
1.2.2- Examples of ceiling jet fires ... 13
1.3- Plan of thesis ... 14
2- FIRE EVENTS AND DYNAMICS ... 15
2.1- Fire in open car park ... 15
2.2- Different fire scenarios in car parks ... 16
2.2.1- Classification of cars (car classes) ... 16
2.2.2- Fire scenarios ... 16
2.2.3- Localized fires ... 17
2.2.3.1- Small fires ... 18
2.2.3.2- Large fires ... 19
2.3.1- General definition of fire ... 21
2.3.2- Definition of heat release rate (HRR) ... 22
2.3.3- Convective heat release rate ... 23
2.3.4- Heat release rate from vehicles ... 23
2.4- Definition of fire compartment ... 26
2.4.1- Phases of fires in compartment ... 27
2.4.2- Characteristics of fire compartment ... 28
2.5- Definition of different fire events ... 29
2.6- Fire detection ... 32
2.6.1- location of fire detectors systems in compartment ... 33
2.6.2- Rules for the perfect work of fire detectors ... 33
3- HEAT TRANSFER ... 35
3.1- Convection ... 35
3.2- Conduction ... 36
3.3- Radiation ... 36
4- CORRELATIVE MODELS ... 37
4.1- Definition of correlative models ... 37
4.2- Alpert correlations ... 37
4.2.1- Maximum Velocity and Temperature during the fire event ... 38
4.2.2- Maximum Temperature and Velocity for different ratio r/H ... 40
4.3- Cooper correlations ... 41
4.3.1- Maximum Velocity and Temperature during the fire event ... 42
4.3.2- Maximum Temperature and Velocity for different ratio r/H ... 43
4.4- Heskestad and Delichatsios correlations ... 45
4.4.1- Maximum Velocity and Temperature during the fire event ... 46
4.4.2- Maximum Temperature and Velocity for different ratio r/H ... 47
4.5.1- Maximum temperature comparison for class 1 ... 49
4.5.2-Maximum temperature comparison for class 2 ... 50
4.5.3- Maximum temperature comparison for class 3 ... 51
4.5.4- Maximum temperature comparison for class 4 and 5 ... 52
4.5.5- Maximum velocity comparison for class 1 ... 53
4.5.6- Maximum velocity comparison for class 2 ... 54
4.5.7- Maximum velocity comparison for class 3 ... 56
4.5.8- Maximum velocity comparison for class 4 and 5. ... 57
5- CFAST MODEL ... 58
5.1- Definition of CFAST ... 58
5.2- The model ... 58
5.2.1- Simulation environment ... 59
5.2.2- Thermal properties ... 59
5.2.3- Compartments ... 59
5.2.4- Wall vents ... 60
5.2.5- Fires ... 60
5.2.6- Defining targets ... 60
5.2.7- Defining the fire detectors ... 61
5.2.8- Output results ... 61
5.3- Comparison of results ... 65
5.3.1- Maximum temperature comparison for class 1 ... 65
5.3.2- Maximum temperature comparison for class 2 ... 66
5.3.3- Maximum temperature comparison for class 3 ... 66
5.3.4- Maximum temperature comparison for class 4 and 5 ... 67
5.3.5- Maximum velocity comparison for all car classes ... 68
6- FLUENT MODEL ... 70
6.1.1- Continuity equation ... 70
6.1.2- Navier-stokes equation ... 70
6.1.3- Energy equation ... 71
6.2- The model ... 72
6.2.1- Material models ... 73
6.2.2- Boundary condition ... 74
6.2.3- Heat flux ... 74
6.3- Discussion of results ... 75
6.3.1- Velocity results from ANSYS fluent simulation ... 75
6.3.2-Temperature results from ANSYS fluent simulation ... 76
7- CONCLUSIONS ... 78
REFERENCES ... 79
Annex A: Information about fire scenarios ... 83
Annex B: Results from correlative models ... 84
1- Alpert's results ... 84
2- Cooper's results ... 84
3- Heskestad and Delichatsios's results ... 85
4- Maximum temperature comparison between correlative models ... 85
5- Maximum velocity comparison between correlative models ... 86
Annex C: Results from CFAST simulation... 88
1- Positions of targets and heat alarm in CFAST simulation ... 88
2- Maximum temperature from CFAST numerical simulation ... 89
3- Maximum velocity from CFAST numerical simulation ... 89
4- Maximum temperature comparison between the correlations and CFAST ... 90
5- Maximum velocity comparison between the correlations and CFAST ... 91
LIST OF FIGURES
Figure 1-Schematic diagram for small localised fire ... 12
Figure 2- The three zones of the axisymmetric buoyant plume[16] ... 12
Figure 3- Front (F) and rear (R) fire plume [19] ... 15
Figure 4- Fire scenarios in open car park ( Dimensions given in m) [19] ... 17
Figure 5- Schematic fire for small localised fire [20] ... 19
Figure 6- Localised fire impacting on ceiling of compartment [20] ... 21
Figure 7- The geometry of the compartment for localized fire vehicle ... 21
Figure 8- Experience of Calorimeter hood [26] ... 24
Figure 9- HRR (MW) vs. time (min) of five car fire tests and reference curve [26] ... 24
Figure 10- Curves of HRR for car classes1,2,3,4 and 5 ... 26
Figure 11- Phases of fire development [27] ... 28
Figure 12- Localized fire of our case of study ... 29
Figure 13- The burning of old and new cars in open car park [24] ... 30
Figure 14- Heat released from cars of class 3, old and new generation [24] ... 30
Figure 15- Curves of Rates of Heat Release from Burning of 3 Vehicles, Class 3 [19] ... 31
Figure 16- HRR vs time for car fires initiated by fuel pool fire [26] ... 32
Figure 17- Fire detectors: heat alarm (left), sprinklers (right) [29] ... 33
Figure 18- Velocity near the ceiling from Alpert correlations ... 39
Figure 19- Temperature near the ceiling from Alpert correlations ... 39
Figure 20- Vmax of all car classes calculated by Alpert correlations ... 40
Figure 21- Tmax of all car classes calculated by Alpert correlations ... 41
Figure 22- Velocity near the ceiling from Cooper correlations ... 42
Figure 23- Temperature near the ceiling from Cooper correlations ... 43
Figure 24- Vmax of all car classes calculated by Cooper correlations ... 44
Figure 25- Tmax of all car classes calculated by Cooper correlations ... 44
Figure 26- Velocity near the ceiling from Heskestad and Delichatsios correlations ... 46
Figure 27- Temperature near the ceiling from Heskestad and Delichatsios correlations ... 47
Figure 28- Vmax of car classes from Heskestad and Delichatsios correlations ... 48
Figure 29- Tmax of car classes from Heskestad and Delichatsios correlations ... 48
Figure 30- Comparison of the value of Tmax from the correlative models for class 1 ... 49
Figure 31- Comparison of the value of Tmax from the correlative models for class 2 ... 51
Figure 33- Comparison of the value of Tmax from the correlative models for class 4,5 ... 53
Figure 34- Comparison of the value of Vmax from the correlative models for class 1 ... 54
Figure 35- Comparison of the value of Vmax from the correlative models for class 2 ... 55
Figure 36- Comparison of the value of Vmax from the correlative models for class 3 ... 56
Figure 37- Comparison of the value of Vmax from the correlative models for class 4,5 ... 57
Figure 38- The geometry of our case of fire compartment ... 60
Figure 39- Grid size of the compartment ... 61
Figure 40- Results of temperature from CFAST simulation ... 62
Figure 41-Results of velocity from CFAST simulation ... 62
Figure 42- Results of Tmax from CFAST simulation ... 63
Figure 43- CFAST simulation for Tmax ... 63
Figure 44- Results of Vmax from CFAST simulation ... 64
Figure 45- CFAST simulation for Vmax ... 64
Figure 46- Comparison of Tmax for class one ... 65
Figure 47- Comparison of Tmax for class two ... 66
Figure 48- Comparison of Tmax for class three ... 67
Figure 49- Comparison of Tmax for class 4,5 ... 68
Figure 50- Comparison of Vmax for all car classes ... 69
Figure 51- Mesh of the model ... 72
Figure 52- Properties of the Air ... 73
Figure 53- Results of velocity from ANSYS fluent simulation of car class 1 ... 75
Figure 54- Results of temperature from ANSYS fluent simulation of car class 1 ... 76
LIST OF TABLES
Table 1- HRR of different car classes ... 25
Table 2- Thermal properties of Concrete and Steel ... 28
Table 3- Properties of concrete based on data points ... 74
Table 4- HRR and heat flux of class 1 ... 75
LIST OF TABLES OF ANNEX A Table 1- Definition of car categories (classes)... 83
Table 2- car mass, mass of combustible materials, theoretical energy of combustion... 83
Table 3- Rough Measure of Energy Released or Generated from Various Sources[16]... 83
LIST OF TABLES OF ANNEX B Table 4-T and V getting form Alpert's correlations... 84
Table 5- T and V getting form Cooper's correlations... 84
Table 6- T and V getting form Heskestad and Delichatsios correlations... 85
Table 7- Comparison between correlative models for T of class 1... 85
Table 8- Comparison between correlative models for T of class 2... 85
Table 9- Comparison between correlative models for T of class 3... 86
Table 10- Comparison between correlative models for T of class 4,5... 86
Table 11- Comparison between correlative models for V of class 1... 86
Table 12- Comparison between correlative models for V of class 2... 86 Table 13- Comparison between correlative models for V of class 3... Table 14- Comparison between correlative models for V of class 4,5...
86 87
LIST OF TABLES OF ANNEX C
Table 15- Data of the six targets in the compartment 88
Table 16- Data of the six heat alarms in compartment 88
Table 20- Results of CFAST simulation for maximum temperature 90 Table21- Comparison of T between correlative models and CFAST for class 1 90 Table22- Comparison of T between correlative models and CFAST for class 2 90 Table23- Comparison of T between correlative models and CFAST for class 3 90 Table24- Comparison of T between correlative models and CFAST for class 4,5 91 Table25- Comparison of V between correlative models and CFAST for class 1 91 Table26- Comparison of V between correlative models and CFAST for class 2 91 Table27- Comparison of V between correlative models and CFAST for class 3 91 Table28- Comparison of V between correlative models and CFAST for class 4,5 92
LIST OF TABLES OF ANNEX D
Table 29- Maximum velocity from ANSYS fluent 93
NOTATION
Latin lower case letters
g Components of acceleration due to gravity [m/s2]
h Heat flux [w/m ]
h Net heat flux[w/m ]
m Plume mass flow rate [kg/s]
r Radial coordinate of plumes and ceiling jets [m]
t Time [min]
Latin upper case letters
C Specific heat at constant pressure [kJ/(kg K)]
D Diameter of fir source [m]
E Energy of combustion [MJ]
H Height of the compartment [m]
H Vertical distance between the floor and the ceiling [m] H Distance between the fire source of the car and the floor
K , , Thermal conductivity in x,y,z directions
L Flame height [m]
L Horizontal flame length
Q Volumetric heat source
Q Total heat release rate (HRR) [kW]
Q Convective heat release rate [kW]
Q∗ Heat release coefficient related to the diameter of the local fire
Q∗! Non-dimensional hate release rate [W]
T Gas temperature [°C]
T Maximum temperature in the jet flow [°C]
T" Surface temperature of the member [°C]
T($) Plume temperature along the symmetrical vertical flame axis
[°C]
V Velocity vector
V Maximum velocity [m/s]
V ; ; Velocity in x,y,z directions
Z Vertical distance [m]
Z( Height of virtual source above burning item [m]
Z′ Vertical position of the virtual heat source [m]
Greek letters
) Convection
)* Coefficient of heat transfer by convection
+ Emissivity
+, Emissivity of fire
+" Surface emissivity of the member
- Stephan Boltzmann constant =5.67×1001 w/m k
∅ Configuration factor
δ
Thickness of ceiling jet [m]
λ Thermal conductivity [kW/(m °C)]
ρ Density [kg/m5]
ρ6 Ambient air density[kg/m5]
1- INTRODUCTION
One of the most interesting issues in fire engineering and fire safety is the rapidity of detecting fire using fire detection systems which operate in function of the hot gases and smoke. Our study case is fire induced the ceiling jet.
The velocity and temperature of the hot gases due the fire in compartment are two major values that we must take in consideration in the studies of fire, the main goal of this work is doing different numerical simulations using two commercial software, which are CFAST( Consolidated Model of Fire and Smoke Transport), an advanced calculation method based on the two zone models: and CFD ( Computational fluid dynamics). Also simple calculation methods, based on the correlative models devoted to fire plumes and ceiling jets were used to compare results of temperature and velocity near the ceiling which is considering unconfined in six radial positions of a localized fire. Five car categories in different fire scenarios of burning car in open car parking were considered for analysis.
After the different numerical simulation and calculation there are a set of results which are discussed in this work, showing in which region of targets positions the results correlate and are in agreement between them, or exist a relative difference.
These kind of results give us more information about the activation time of fire detectors which can be sprinklers or heat alarms. By this way the fire will be sufficiently small and easily controlled.
1.1- State of the art
This work presents the analysis of a fire induced ceiling jet and a comparison between correlative models and two zone models. The main objective is to compare the temperature and velocity of the gas near the ceiling for different ratio parameter (r/H). The radial coordinate of plumes and ceiling jets (r ) and the height if the compartment (H).
however the value of T refers to maximum temperature in the jet flow close to the ceiling. Therefore at all radial positions, especially close to the fire plume gas temperature decreases as the ceiling height increases. Measurements of gas velocity have been made in similar fire tests, using different radial positions, including the fire plume. The gas velocity is nearly constant in the fire plume but decreases sharply with radial distance beyond the fire plume.
In 1981, the National Bureau of Standards Centre for Fire Research completed an investigation about the structure and heat transfer properties of fire and fire plumes in horizontal ceiling [3]. The experiment used natural gas as fire source with a specific diameter, and emphasized two different heating release rates. The profiles of the average velocity and temperature were defined and compared with predictions of differential and integral results. The integral model provides good results for average velocity, temperature and composition in both combustion and non-combusting plumes, also for analysing plume properties, which could be extended to treat the properties of the ceiling jet. Some compromises were also dictated by the need to ultimately extend the approach to the ceiling-jet region. Estimates of radiative heat fluxes, however, were less satisfactory. Measurements reported by Alpert, Zukoski and co-workers were evaluated and presented investigation for a reasonable prediction of both flow properties and ceiling heat fluxes. There have been numerous attempts to model the properties of natural fires, integral models are typified by Wilcox and Taminini. Alpert has developed a comprehensive model describing this flow, and also provides some data on the ceiling of heat transfer rate and temperature and velocity. The previous work about flame impingement on a ceiling, measurements of the structure of the flow have been very limited. Predicting radiation in turbulent combustion flows represents a significant theoretical problem in its own right, even when the flow structure is known [3].
In January 1986, a master thesis submitted to the Worcester Polytechnic Institute in Fire Protection Engineering shows how to use the fire plume theory in the design and analysis of fire detector and sprinkler [5]. The correlations for t fires were developed using data from a series of wood crib burn tests. In their updated paper, Heskestad and Delichatsios also provided correlations for ceiling jet temperature and velocity from t fires, based only on the convective heat release rate. The test fires had a convective heat release fraction of approximately 75%. Modelling fuels having different convective fractions will produce some degree of error. This thesis demonstrates how the response of fire detection and automatic sprinkler systems can be designed or analysed. National Bureau of Standards furniture calorimeter test data is compared to heat release rates predicted by a power-law fire growth model. The test was a burning tray with alcohol, located in the centre of a test room, with presence of sprinkler devices located on the ceiling in a square array. Other tests were done at the West Glocester facility to measure the effects of ceiling height and fire growth rate on the response of fire detectors. These tests included only open flaming fires and no smouldering fires. All tests were conducted under a large, flat ceiling with no walls. Three ceiling heights were selected for the tests. The height of the ceiling above the fuel surface changed with each different fuel configuration. Fire growth rate was varied by using three different wood crib configurations. This gives nine possible combinations of fire growth rate and ceiling height. Several of the tests were repeated to help determine the repeatability of the testing procedures. As result, equations were presented to calculate fire gas temperatures and velocities. The equations were proposed by Heskestad and Delichatsios to model temperatures and velocities along a flat ceiling with no walls [5].
can be used to aid in the development and verification of compartment fire models and to improve the design and placement of heat detectors and sprinklers. Results from the steady-state unconfined ceiling jet have been used to predict the ceiling jet characteristics for confined ceiling jets at early times in the fire. The basis for comparison is the fact that the unconfined ceiling jet has been studied extensively. Using the unconfined ceiling jet allowed the study of the jet characteristics alone without any interference from the developing upper layer. The unconfined ceiling jet simulates a condition where the walls are much further from the plume centreline [6].
the 1imited number of thermocouple pairs and their distribution, each experiment was repeated 3 to 4 times. Each time, the probe was positioned at a different distance from the ceiling. This provided enough data to complete velocity and temperature profiles. By default, this procedure also demonstrated the high degree of repeatability obtained. It is concluded that there is a general agreement between the different correlative models. Poreh et al used model that agrees well with Heskestad and Delichatsios at one of the radial position, but overestimates the data by 30% and 50% when r/H is smaller than 0.7. Cooper's model predicts an unreasonably high V at small r/H values and probably is not accurate in that range (r/H<0.4). Alpert's data were obtained using a hot-wire probe while Heskestad's measurements were made employing a bidirectional probe. The empirical equation from this work seems to closely agree with that of Alpert is in a general agreement with Heskestad and Delichatsios's correlation, both of which are for large-scale experiments. The velocity measurements by the authors are also much more detailed than those by other investigators. You and Faeth concluded that Alpert's integral model generally underestimates the measured maximum temperature, Heskestad and Delichatsios also show lower temperature in their large-scale experimental results. In addition, accurate determination of the location of maximum temperature requires very detailed measurements [7].
quantifying the maximum temperature and maximum velocity at a given position in the ceiling jet flow and apply to situations where the flow can be considered unconfined. These methods are the basis for acceptable design [8].
In March 2002, National Institute of Standards and Technology (NIST) and U.S. Department of Commerce and Technology Administration completed a research about Comparison of CFAST and FDS for Fire Simulation with the two tests [9]. This work uses three methods: hand calculations, a zone model code (CFAST), and a computational fluid dynamics code (FDS) [10], to examine both two fire tests. The two tests used different fuels, propane gas and a hydrocarbon solvent, and occurred in two quite different locations. CFAST has both a user's manual describing how to run the code and a theory manual describing the internal workings and theory behind the code, as conclusion about this tests. The first tool examined was the application of simple hand calculations to the two fire tests. Hand calculations cannot be expected to yield precise information on a fire investigation. However, one can expect that a hand calculation yields sufficient information regarding a fire to determine whether or not a more detailed analysis is needed. This work has clearly shown that CFAST is in need of significant improvements if it is to be used in a performance-based code regime for analysing entire compartments. Far-field mass flows, temperature changes, and propagation of gas species are not well predicted by CFAST. Even near-field predictions of temperatures and mass flows can be in substantial error. FDS, as well as other Computational Fluid Dynamics (CFD) methods in general, is a relative newcomer to fire protection. CFD models such as FDS are not easy to use. Furthermore, their computational requirements greatly limit their applicability [9].
favourably with other ceiling jet data and analysis. The velocity and temperature measurements were obtained for unconfined ceiling jets under ceiling transient and steady-state conditions. These experimental and mathematical modelling studies have provided the necessary understanding to predict some of the general transport behaviour in fires based on empirical correlations. The results of these investigations have advanced the understanding of fire phenomena and improved the design of fire protections systems. However, detailed measurements in well controlled experiments are required for model development. In particular, characterizations of the velocity field in fire plume configurations are notably absent [11].
the original. The original power of r/H may have been selected with some degree of arbitrariness to obtain the rational number. Accordingly, a re-examination of data underlying the 1972 ceiling jet formulas has produced new regression fits that should be more reliable than the original formulas. Such algebraic formulas are useful for predicting detection and activation times of ceiling mounted devices, e.g., fire sprinklers. To determine what mass flux of agent droplets from these activated sprinklers arrives at the fire source [12].
presented for two ratio parameters (r/H=0.5 and 0.9) from the plume centreline. The average temperature is derived as the mean of the temperature in the four cells just below the ceiling. The temperature gradient in the ceiling jet is also analysed. The maximum temperature in FDS is roughly 30-50% higher than predicted with equation for maximum temperature of Alpert. The difference is a bit less for the inert case. The maximum temperature was almost always located in the cell closest to the ceiling. This is regarded reasonable in regard to previous research on the location of the maximum temperature, because the cell closest to the ceiling covers 1-2%, depending on simulation, of the ceiling height. A comparison of the velocity calculated equation for maximum velocity of Alpert and the maximum and average velocity in FDS is presented for two ratio parameter distances (r/H=0.5 and 0.9) from the plume centre line. The average velocity is derived as the mean of the velocity in the four cells just below the ceiling. The velocity gradient in the ceiling jet is also analysed. The maximum velocity in FDS is roughly 70-80% higher than predicted with equation for maximum velocity of Alpert. There is a negligible difference between the inert and adiabatic case. Close to the plume there is a reasonable correspondence of the gas velocities. However, further way from the plume the average gas velocity was calculated with FDS roughly 10-25% higher than predicted with Alpert correlations [13].
bricks were placed in the tunnel on the floor, one thermocouple and one heat flux meter were placed as targets on the floor. General conclusion about the results of this test and comparison between these results and some equations about the velocity and temperature near the ceiling are presented, being the equation proposed by Li et al very good to define gas velocities and temperatures for the test [14].
1.2- Ceiling jet fires
The studies about fire plume and ceiling jet are very important for improving fire detection system designs and practices, such as the designs of activation devices for heat alarm and many types of smoke and fire detectors.
Figure 1-Schematic diagram for small localised fire
Figure 2- The three zones of the axisymmetric buoyant plume[16]
1.2.1- Fire plume characteristics
Hot products caused by buoyancy are generated in a fire to rise to the ceiling while mixing with room air to form a fire plume, which has the following properties : virtual origin, denoted Z(depends on the diameter of the fire source (D) and the total energy released (Q). When Z( lie beneath the fuel source, it is negative and means that the area of the fuel source is large compared to the energy being released over that area. On the other hand, Z( is positive when located above the fuel source. So, the fuel releases high energy over a small area. :( is given by:
Z( = 0.083Q ?
@− 1.02D (1)
temperature is the other main parameter which can achieve the highest value near the centreline of the plume and is denoted by T(. The third parameter is plume mass flow rate (m ). The plume mass flow increases steadily with height, since ambient air is continually entrained over the plume height [17]. The last parameter is the plume radius (r) that corresponds approximately to the point where the centreline temperature decreases to 0.5T( [16] and the centreline velocity has decreased to 0.5U(.
1.2.2- Examples of ceiling jet fires
This section is going to present some examples about fires in unconfined ceiling jet. One famous example is the fire induced ceiling jet in tunnels. A buoyant smoke layer in a tunnel can be summarized into four phases or regions [17], the ceiling is impinging by the plume, then after impingement smoke under the ceiling spread radially which happening in the second region, on the third phase there is the interaction with side walls, and then the transition to the fourth phase which is one-dimensional spreading. In fire tunnels the smoke flow should be in two opposite directions. The complex heat transfer, including convective and radiative heat loss to the boundaries, when a smoke flow travels along the tunnel, there would be a boundary layer contacting the tunnel ceiling. The smoke flow temperature would decrease along the tunnel primarily due to the heat loss to the tunnel ceilings through this boundary layer [17].
1.3- Plan of thesis
Chapter one presents the state of the arte, contains different experimental investigation done by the researchers and comparison of the results for the temperature and velocity of the gas near the ceiling for different parameters. This chapter also includes an introduction about ceiling jet fire.
Chapter two contains a definition of different fire scenarios in open car parking, using a localized fire for the event of a car fire. Different car classes burning events will be presented with the results of the Heat Release rate (HRR) for each class.
Chapter three provides a general definition of heat transfer with discussion of the different modes of heat transfer which are included in this phenomenon.
Chapter four presents different correlative models (Alpert, Cooper, Heskestad and Delichatsios) to estimate the maximum temperature and velocity near the ceiling. The results are compared for different fire events and different fire compartments.
Chapter five is dedicated to the numerical simulation using CFAST software. A brief definition of CFAST will be presented followed by a discussion of the results about the maximum temperature and velocity between this simulation and results from the correlative models.
Chapter six is dedicated to the computational fluid dynamics, where this fire event is going to be simulated, based on specific solution for equations.
2- FIRE EVENTS AND DYNAMICS
In order to define some fire scenarios, a typical car fire inside a compartment was chosen. Different fire events were defined, taking into consideration the class of the car. The compartment was fixed and will be explained in this chapter. The ability to predict the dynamics of the fire and protect the compartment from fire damage is of great importance.
2.1- Fire in open car park
A car park may be considered as open if for every parking level, the ventilation areas in the walls are situated in at least two opposite facades, equal at least 1/3 of the total surface area of all the walls and correspond to at least 5% of the floor area of one parking level. The burning car is divided into two plumes which are called as the front fire plume and the rear fire plume [18]. Due to many causes of fire in car park that will be discussed on the next paragraph, the flames extend out of the car burning from the windscreen and the rear window, the hot gases move upward due to buoyancy and the fire plume impinges the ceiling of the car park. The burning car is divided into two plumes where the heat release rate included is equal to the heat release by the vehicle. See Figure 3.
Figure 3- Front (F) and rear (R) fire plume [19]
2.2- Different fire scenarios in car parks
The fire scenario (position and number of the vehicles) should represent the most unfavourable situation for the elements in the compartment (or substructure). The INERIS - Institut National de l'Environnement Industriel et des Risques, considers that fire scenarios with cars of class 3 should be used to evaluate the structural stability of the car park under fire. And the fire resistance of the structure should be ensured during the entire fire scenario, or at least, if allowed by National requirements, up to a certain resistance time R of the elements defined as for the standard ISO (International Organization for Standardization) curve. In addition, a scenario including a commercial vehicle (van containing 250 kg of highly flammable material: E =19 500 MJ) corresponds to an extreme situation and should only be used to check the global behaviour of the structure, assuming local collapse, without progressive collapse [18]. There are basically two approaches available when determining the fire design for a given scenario. One is based on knowledge of the amount and type of combustible materials in the compartment of fire origin.
2.2.1- Classification of cars (car classes)
The cars type used in fire scenario are classified depending on their theoretical energy of combustion (E). The different classes are presented in table one of annex A. According to statistical studies of actual fires in car parks, 90% of the vehicles involved in a fire are classified as class 1, 2 or 3 [19].
2.2.2- Fire scenarios
Scenario 1: assuming that one car burning at mid-span under the beam (corresponding to the maximum bending moment position), it is unrealistic to have two cars improperly parked in the same time which are burning beneath the steel beams and at mid-span assuming that the source of heat is defined by the burning of one car, see next figure. The relative position between the fire source and the limits of the compartment are assumed to be 0.3m above the ground floor and within an area equivalent to a circle with a diameter of 2m.
minutes [18]. The heat release rate of this scenario can be determined by the envelope of both
fire events, considering the fire travelling time.
Scenario 3: may link seven class 3-cars, having the possibility of a commercial vehicle in a special position of each fire event. The heat release rate of this scenario can be determined by the envelope of all fire events, considering the fire travelling time.
Scenario 4: may involves four class 3-cars parked face to face, with the possibility to have a commercial vehicle in each position. For all scenarios, the fire spread time from a vehicle to another may be considered equal to12 minutes, but the initial document by ECCS (European Convention for Constructional Steelwork) recommended a time delay equal to 15 minutes [19].
Scenario 5: involving three cars -class3, parked side by side. The scenario of three cars class 3 involved in a fire is an envelope scenario of around 98.7% of all possible scenarios [19]. The uses of fire scenarios is to define the curve of the real heat release rate of burning car. The five scenarios are represented in Figure 4.
Figure 4- Fire scenarios in open car park ( Dimensions given in m) [19]
2.2.3- Localized fires
fire D is smaller or equal to 10 m and if the heat release rate E is smaller or equal than 50 MW.
2.2.3.1- Small fires
From Figure 5, the highest temperature is located at the vertical flame axis, which is called the plume centreline (plume zone). This temperature decreases from the source to the edge of the flame in Z direction. It is roughly constant in the continuous flame region and represents the mean flame temperature. The temperature decreases sharply above the flames as an increasing amount of ambient air is entrained into the plume. The design formula to calculate the temperature in the flame, for small localised fire, was proposed by Heskestad, see Eurocode EN1992-1-2. Considering a localised fire as shown in Figure 5, the flame height L is given by [20-21]:
l = −1.02D + 0.0148Q(?@) (2)
When the flame is not impacting the ceiling of a compartment ( l< H), or in case of fire in open air, the temperature T( ) in [°C] in the plume along the symmetrical vertical flame axis is given by [21]:
T( )=20+0.25Q /5(Z − Z()(0 @
J)≤900 (3)
where
And Q is the convective part of the rate of heat release [kW], with Q ≈ 0,76 Q by default. Z( is defined as the virtual origin of the fire.
Figure 5- Schematic fire for small localised fire [20]
2.2.3.2- Large fires
In this case the fire plume impinges on the ceiling of the compartment (l ≥H), the flame turns and moves horizontally beneath the ceiling due to the ceiling surface. Using design formulation based on fire model developed by Hasemi, which is a simple tool for the calculation of the localised effect on horizontal elements located above the fire [21]. A schematic diagram of localised fire when the flame impinges the ceiling is represented in Figure 6, for the case of unconfined ceiling jet. The gas flows from the plume and continuous moving radially outward, loosing heat to the cooler zone of the compartment and also to the ceiling. The maximum temperature and maximum velocity occurs relatively close to the ceiling. When l ≥H, the horizontal flame length (L ) in [m] is given by the equation 5, using formulas from [20] to determine the heat flux received by the surface area at the ceiling level, but not for calculation the ceiling jet temperature [21].
L = (2.9H(Q∗!)(.55) − H (5)
Where Q!∗ in [w] is non-dimensional hate release rate and is given by:
Q∗!=1.11 × 10QP× H .L
(6)
Z(= −1.02D + 0.00524Q /L (7)
When the flame is impacting the ceiling (l ≥H; see Figure 6) the heat flux QhR in [w/m ] received by the fire exposed unit surface area at the level of the ceiling is given by [20]:
Where (y) is a parameter [-] given by:
y =l + H + Zr + H + ZUU (11)
Where (r) is the horizontal distance [m] between the vertical axis of the fire and the point along the ceiling where the thermal flux is calculated, see Figure 6, (Z′) is the vertical position
of the virtual heat source [m] and is given by:
Where Q∗ is heat release coefficient related to the diameter of the local fire
Q∗ = Q/(1.11 × 10P× D .L) (14)
The net heat flux (h ) [W/m ] received by the element exposed per surface area at the level of the ceiling, is given by:
h = h − α × (T − 20) − Tε ε σ[(T + 273)\− (239)\] (15)
Hasemi´s method is a simple tool for the thermal evaluation of the localized effect of a fire on horizontal elements located above the fire [19].
h = 100000 y≤0.30 (8)
h = 136300 − 121000 y 0.30<y<1.0 (9)
h = 15000 y05.^ y ≥1.0 (10)
Figure 6- Localised fire impacting on ceiling of compartment [20]
Taking an example of a localised fire in open car park and assuming that fire scenario number 1 was selected, see Figure 7, the main parameters of the fire induce ceiling jet are represented. For this case it is assumed that this fire is equivalent to a pool fire with a diameter D=2 m, an elevation surface Hs equivalent to 0.3 m above the ground and a remaining distance H up to the ceiling equals 2.7 m.
Figure 7- The geometry of the compartment for localized fire vehicle
2.3 - Definition of fire (HRR)
2.3.1- General definition of fire
processes of interest in an enclosure fire mainly involve mass and heat fluxes. The combustion and therefore the fire cannot happen without meeting of the three elements simultaneously: the presence of a fuel or flammable Material, which can be solid (wood, coal, paper....), liquid (gasoline, alcohol ...) or gas (propane, butane), the presence of the oxidizer (oxygen, air, peroxide) and also the ignition source, which is necessary to start burning (spark, flame). The study of fire or combustion includes a number of disciplines such as: heat and mass transport, fluid mechanics, and chemical kinetics.
A fire is as a source of heat which is released at a specified rate. This heat may be defined by the product of enthalpy (the conversion factor is the heat of combustion) and mass loss rate (the conversion factor is the yield of a particular species) as it burns. A fire is constrained if the enthalpy conversion depends on the oxygen concentration otherwise it is unconstrained. Burning can take place in the portion of the plume in the lower layer (if any), in the upper layer, or in a door jet. For an unconstrained fire, the burning will all take place within the fire plume. For a constrained fire, burning will take place where there is sufficient oxygen. When insufficient oxygen is entrained into the fire plume, unburned fuel will successively move into and burn in: the upper layer of the fire compartment, the plume in the doorway to the next compartment, the upper layer of the next compartment, the plume in the doorway to the third compartment, and so forth until it is consumed or gets to the outside [22].
2.3.2- Definition of heat release rate (HRR)
The Heat Release Rate (HRR) is an important parameter to characterise a fire compartment, called also energy release rate. The burning of objects (cars, building....) releases a certain quantity of energy per unit time, it is measured in W, usually noted by (Q). Fire development is generally characterized in terms of HRR and time. Table 3 of annex A
indicates that
for many design purposes the design fire energy output could be in the range2.3.3- Convective heat release rate
The convective heat transfer to ceilings during enclosure fires can be related to the heat transfer to unconfined ceiling surfaces from buoyant plume-driven ceiling jets [23]. This quantity is usually noted by (Q ) and is also expressed in power units [kW]. Conducting an energy balance of the combustion products, the HRR can be established from temperature measurements. Two measurements are required: the mass flow of combustion products and the variation of temperature through the calorimeter, Q ≈ 0.76Q convective heat flux to the member related to the difference between the bulk temperature of gas bordering the relevant surface of the member and the temperature of that surface [20].
2.3.4- Heat release rate from vehicles
Figure 8- Experience of Calorimeter hood [26]
Considering the experimental data collected by this project, the report introduced an HRR reference curve shown in Figure 9. A “wave” theory was also proposed in this report to account for the fire spread between multiple vehicles in a closed car park. According to this “wave” assumption, the cars will burn one after another, with a delay time of 12 minutes. By examining the HRR reference curve, one can infer that the fire of first car will start to decay when third car starts to ignite at around 24 minutes. It was also concluded that the fire can be confined within single vehicle with the provision of sprinklers or reliable detection system combined with adequate fire-fighting equipment [25].
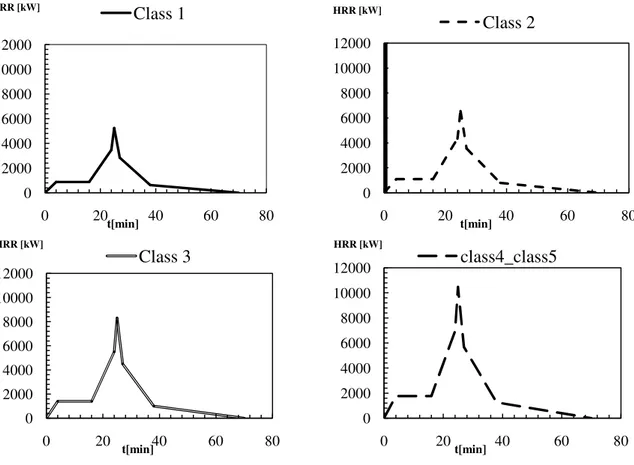
When there is a burning car for each class, this burning contains two plume regions, the front and the rear fire plumes, the total heat release rate of the vehicle is equal to the sum of the heat releases included in the two fires plume. The Table 1 shows the value of the total heat release rate (HRR) in [kW] of car class 1, class 2, class3, classe4 and 5 getting from tests of burning car in specific time which is in minutes. This classification was made in 1996 by European manufacturers and divide them into five categories.
Table 1- HRR of different car classes
As we can see from the results of cars burning tests both car class 4 and 5 have the same values of HRR. The heat release rate curves of the different car classes for the new generations is depicted Figure 10 and shows a comparison between these curves. During any time dependent fire, such as a class 3 vehicle, the energy release rate (HRR) increases from zero to a maximum value for time equal to 25 minutes and decreases to zero at the end of the event.
Time Time Class 1 Class 2 Class 3 Class 4 Class 5
Min Sec HRR [KW] HRR [KW] HRR[KW] HRR[KW] HRR[KW]
0 0 0 0 0 0 0
4 240 884 1105 1400 1768 1768
16 960 884 1105 1400 1768 1768
24 1440 3474 4342 5500 6947 6947
25 1500 5242 6553 8300 10484 10484
27 1620 2842 3553 4500 5684 5684
38 2280 632 789 1000 1263 1263
Figure 10- Curves of HRR for car classes1,2,3,4 and 5
2.4- Definition of fire compartment
Space within a building, extending over one or several floors, which is enclosed by separating elements such that fire spread beyond the compartment is prevented during the relevant fire exposure [20]. Fire compartment is a volume within a building which is completely surrounded with fire-resistant construction elements, which can be integrated right into the structure of the building. Fire compartments are not absolutely fire proof. Fire can work its way into or out of a fire compartment if it is intense enough, poorly managed, or not addressed quickly enough. Existing buildings can be retrofitted to create fire compartments. Movable barriers can be installed, or people can remodel parts of a building to create a fire compartment. Also known as a fire zone, a fire compartment can also sometimes address the potential of flood damage, as the same materials which keep fire out can sometimes keep water at bay as well. The fire compartments can consist of rooms or groups of rooms. When a fire starts inside a compartment, the sealed nature of the area can compartmentalize the fire, preventing it from spreading to other areas. The fire compartment used in this study represents a fire in open car park, being the dimensions defined in the next sections.
0 2000 4000 6000 8000 10000 12000
0 20 40 60 80
HRR [kW] t[min] Class 1 0 2000 4000 6000 8000 10000 12000
0 20 40 60 80
HRR [kW] t[min] Class 2 0 2000 4000 6000 8000 10000 12000
0 20 40 60 80
HRR [kW] t[min] Class 3 0 2000 4000 6000 8000 10000 12000
0 20 40 60 80
HRR [kW]
t[min]
2.4.1- Phases of fires in compartment
The fire in compartment is characterized by four principal phases. The first phase is the fire development which is the evolution of the size of the fire from a small incipient fire. If there is no action to stop the fire, it will have the maximum size. In this situation the fire size will be controlled by the amount of existing fuel or by the amount of ventilation, see Figure 11.
The second phase is the flashover which is usually obvious to the observer of fire growth. When an object begins to burn in a compartment, gives rise to the appearance of a fire plume of hot gases and smoke. By natural convection rises to the ceiling, where it begins to spread horizontally, forming a layer. An unconfined flame tends to follow the initial growth period, a law in which the heat release rate is proportional to the square of time. Thus the layer next to the ceiling increases temperature and thickness because the plume continues to transport mass and energy from the burning material. The temperature increase of that layer makes the emission of radiation, being primarily directed downward, higher and higher. This radiation focuses on the existing objects in the compartment is partially absorbed and increases the temperature of these objects, which continue to produce volatile combustibles. When the upper layer reaches of 600°C order, the incident radiation is sufficient to ignite these released volatile combustibles, bringing simultaneously all objects under fire. This incident radiation has an estimation value of 20 kW/m2 at ground level.
The third phase corresponds to the full development of the fire, which is affected by: a) the size and shape of the enclosure, b) the amount, distribution and type of fuel in the enclosure, c) the amount, distribution and form of ventilation of the enclosure and d) the form and type of construction materials comprising the roof (or ceiling), walls and floor of the enclosure [27].
Figure 11- Phases of fire development [27]
2.4.2- Characteristics of fire compartment
The compartment in this study is named open car parking and has the following geometry characteristics: 10m width, 10m depth, height= 3m. Is characterized by the existence of concrete slabs. The compartment consists in two major walls, one ceiling and one floor. This compartment uses six targets to determine the temperature near the ceiling and six detectors to determine the velocity near the ceiling. The heat flows through the ceiling, walls, and floor of a compartment. The thermal properties of concrete and steel are presented in Table 2. Steel was considered to define the target material and concrete was considered to define the material of each element. Two zones are expected to define the fire compartment, which are the lower layer zone and upper layer zone. The compartment has also two major wall vents, with 0m for sill, 3m for soffit and 10m width.
Table 2- Thermal properties of Concrete and Steel
Thermal properties concrete steel
Density 2200 kg/m5 7850 kg/m5
Thermal conductivity 0.002 kW/(m °C) 0.053 kW/(m °C)
Specific heat 0.9 kJ/(kg °C) 0.425 kJ/(kg °C)
Emissivity 0.7 0.7
Figure 12- Localized fire of our case of study
2.5- Definition of different fire events
A "fire event" shall be defined as an occurrence in which extinguishing media was used to suppress fire. This may mean a portable fire extinguisher, water from fire department efforts, the activation of a kitchen vent hood, a building's sprinkler system, or any other fire suppression system within a building. On the rare occasion when evidence of fire is present, and the fire has self-extinguished, this will also be identified as a fire event. In this study, the fire even of a burning car was considered.
Figure 13- The burning of old and new cars in open car park [24]
Figure 14- Heat released from cars of class 3, old and new generation [24]
Figure 15- Curves of Rates of Heat Release from Burning of 3 Vehicles, Class 3 [19]
Figure 16- HRR vs time for car fires initiated by fuel pool fire [26]
2.6- Fire detection
Detection is based upon heat transfer to the detector, plume and ceiling jet flow studies are important for improving fire detection system. Hot gases rise vertically from a fire and the surrounding air come in to form a plume. Upon reaching underneath the ceiling, the plume turns sideways and becomes a ceiling jet. The amount of air entrained to the fire plume will give the smoke production rate. Also, the magnitude of the horizontal gas velocities and temperature in the ceiling jet would determine whether fire detectors and sprinklers can be actuated [28]. For prediction of fire and prevent the damages caused by the fires whether be material or human damage, it necessary to use predictive fire systems or fire detectors or smoke detectors in the compartment. For instance if there is a fire in a room with the presence of the fire detectors, the fire will be sufficiently small to be easily controlled Sprinklers and heat alarms represent the most significant aspects of a fire management program, see Figure 17
Test Part 6 Test Part 9
Figure 17- Fire detectors: heat alarm (left), sprinklers (right) [29]
2.6.1- location of fire detectors systems in compartment
Ceiling-mounted fire detectors should be located so that the transfer of heat (thermally actuated) or mass (smoke actuated) to the detector is maximized in order to minimize the response time. It is thus necessary to calculate heat and mass transfer rates induced by a fire. Detector sensing elements are generally so small (compared to either the fire plume diameter or the total thickness of the near-ceiling flow outside the plume) that the heat transfer coefficient to a given sensing element will be nearly proportional to the square root of gas velocity, V, and independent of temperature [1].
The warning of fire by the heat detectors (alarms) is starting when the temperature in the area around the smoke detector reaches a certain level. Concerning the case of study, a burning car class 3 is considered in a compartment, which is consider an open car parking, with dimensions of 3m height, 10m for both of width and depth. The diameter of the fire is assume to be (D=2m). The distance between the fire source of the car and the floor (H`=
0.3m). Six heat alarm positions were defined, corresponding to a ratio between radial position and height of r/H=0, 0.37, 0.74, 1.11, 1.48 and 1.85.
2.6.2- Rules for the perfect work of fire detectors
3- HEAT TRANSFER
The most important thing for any fire hazard assessment is the ability to numerically estimate the quantity of heat transfer and fire gases coming from the fuel bed, and the surfaces in an enclosure. The heat transfer into the boundary surface of a compartment occurs by convection and radiation, and then flows through conduction to the walls. These three majors of heat transfer are the principal mechanisms by which heat is transferred between the gas layers and the enclosing compartment walls. Temperature and the flow of heat are the basic principles of heat transfer. The amount of thermal energy available is determined by the temperature, and the heat flow represents movement of thermal energy.
3.1- Convection
3.2- Conduction
Known as diffusion heat transfer, the heat transfer by conduction is the flow or movement of thermal energy, represented by collisions of atoms and molecules and their immediate neighbours within solids and non-flowing fluids. The process of heat conduction depends on the cross-section of the material and the physical material properties.
3.3- Radiation
It is a phenomenon of transmission of energy in the form of waves or particles through space or through a material medium. Thermal radiation is the energy transfer between two bodies via electromagnetic waves. This form of energy transfer is exhibit by all bodies, and requires no medium for the heat to be transferred. It can even be seen to occur in a vacuum. The amount of energy that can be radiated by a surface is given by the Stefen-Boltzmann law.
4- CORRELATIVE MODELS
4.1- Definition of correlative models
The correlative models is a set of formulas to estimate temperatures and velocities of hot gases which are formed and diffused just beneath an unconfined ceiling the fire. These types of correlations are often used in fire safety engineering in order to get an estimate of sprinkler or heat detector activation, presented ground-breaking correlations for flow velocities and excess temperatures for steady and unconfined ceiling jets, which are widely used because of its easy uses [26]. These equations can be used for the estimations of damages on a ceiling material, to predict if the material ignite or to evaluate if the structural behaviour will be affected. The correlative models are implemented in different software such as CFAST. Many investigators have studied the fire induced ceiling jet. Detailed measurements of velocity and temperature were produced, such as Alpert correlations in 1972 and re-examined in2011, the investigation of Heskestad and Delichatsios in 1978, and the correlations produced by Cooper in1982.
4.2- Alpert correlations
IF r/H >0,18
T = T∞+
5,38 × (ab)?J
H
(16)
IF r/H≤0,18
T = T∞+
16,9 × Q?J
H@J
(17)
IF r/H>0.15 V = 0.197 ×ac/J!c/?
b@/d (18)
F r/H≤0,15
V = 0.69 × (QH)e/5 (19)
T represents the maximum temperature given in [°C], T6is ambient temperature equal to 20°C, H is the ceiling height [m], and r is radial position given in [m], V represents the maximum velocity in [m/s].
These correlations are divided into two zones, one part applies to the region of impingement where the upward flow of gas in the plume turns to flow out beneath the ceiling horizontally. Equations 17 and 19 are independent of radius and are actually corresponding to axial plume flow temperatures and velocities, calculated at the ceiling height above the fire source. The other correlations apply outside of this turning region as the flow moves away from the impingement area [16]. Alpert correlations are valid after fire ignition and the ceiling must be considered unconfined and smooth. These correlations apply to a fire source located at least 1.8 H distant from walls. The thickness of ceiling jet δ is found to be within a range of approximately 5 to 12% of the ceiling height H. Furthermore, peaks of temperature and velocity occur within 1% of H measured from the ceiling. A1pert assumed a Gaussian behaviour for the velocity and temperature profiles and has developed an integral model for the boundary layer thickness. This layer position is defined from the ceiling at a distance of 0.01H.
4.2.1- Maximum Velocity and Temperature during the fire event
Class 1 Class2
Class3 Class4,5
Figure 18- Velocity near the ceiling from Alpert correlations
Class 1 Class 2
Class3 Class4,5
Figure 19- Temperature near the ceiling from Alpert correlations
0 2 4 6 8 10 12 14 16
0 20 40 60 80
V[m/s] t [min] ALPERT r/H=0 ALPERT r/H=0.37 ALPERT r/H=0.74 ALPERT r/H=1.11 ALPERT r/H =1.48 ALPERT r/H=1.85 0 2 4 6 8 10 12 14 16
0 20 40 60 80
V[m/s] t [min] ALPERT r/H=0 ALPERT r/H=0.37 ALPERT r/H=0.74 ALPERT r/H=1.11 ALPERT r/H=1.48 ALPERT r/H=1.85 0 2 4 6 8 10 12 14 16
0 20 40 60 80
V[m/s] t [min] ALPERT r/H=0 ALPERT r/H=0.37 ALPERT r/H=0.74 ALPERT r/H=1.1 ALPERT r/H=1.48 ALPERT r/H=1.85 0 2 4 6 8 10 12 14 16
0 20 40 60 80
V[m/s] t [min] ALPERT r/H=0 ALPERT r/H=0.37 ALPERT r/H=0.74 ALPERT r/H=1.11 ALPERT r/H=1.48 ALPERT r/H=1.85 0 200 400 600 800 1000 1200 1400 1600 1800
0 20 40 60 80
T[°C] t [min] ALPERT r/H=0 ALPERT r/H=0.37 ALPERT r/H=0.74 ALPERT r/H=1.11 ALPERT r/H=1.48 ALPERT r/ H=1.85
0 200 400 600 800 1000 1200 1400 1600 1800
0 20 40 60 80
T[°C] t [min] ALPERT r/H=0 ALPERTr/H=0.37 ALPERT r/H=0.74 ALPERT r/H=1.11 ALPERT r/H=1.48 ALPERT r/H=1.85
0 200 400 600 800 1000 1200 1400 1600 1800
0 20 40 60 80
T[°C] t [min] ALPERT r/H=0 ALPERT r/H=0.37 ALPERT r/H=0.74 ALPERT r/H=1.11 ALPERT r/H=1.48 ALPERT r/H=1.85 0 200 400 600 800 1000 1200 1400 1600 1800
0 20 40 60 80
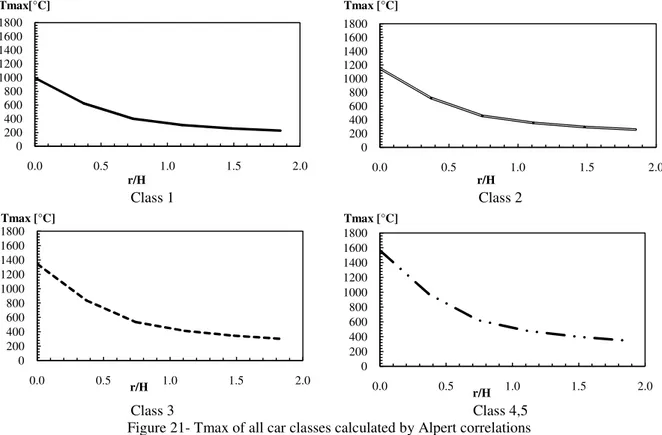
4.2.2- Maximum Temperature and Velocity for different ratio r/H
From the results of velocity and temperature in the hot zone layer, calculated by the correlations developed by Alpert, the maximum dynamic characteristic were extracted from the event for time equal to 25 minutes (1500s). The curves of maximum velocity and temperature are shown in Figure 20 and Figure 21 respectively versus r/H in different positions for car class 1, 2 ,3 and 4, 5.
Class 1 Class 2
Class 3 Class 4,5
Figure 20- Vmax of all car classes calculated by Alpert correlations
0.0 2.0 4.0 6.0 8.0 10.0 12.0 14.0 16.0
0.0 0.5 1.0 1.5 2.0
Vmax [m/s] r/H 0.0 2.0 4.0 6.0 8.0 10.0 12.0 14.0 16.0
0.0 0.5 1.0 1.5 2.0
Vmax [m/s] r/H 0.0 2.0 4.0 6.0 8.0 10.0 12.0 14.0 16.0
0.0 0.5 1.0 1.5 2.0
Vmax [m/s] r/H 0.0 2.0 4.0 6.0 8.0 10.0 12.0 14.0 16.0
0.0 0.5 1.0 1.5 2.0
Vmax [m/s]
Class 1 Class 2
Class 3 Class 4,5
Figure 21- Tmax of all car classes calculated by Alpert correlations
Both maximum temperature and velocity decrease with the ratio r/H, as expected. These values also increase with the class of the fire event.
4.3- Cooper correlations
The investigations of Cooper were done in detail about a ceiling jet in a region r/H > 0.2, measured horizontally from the centre axis of the plume to the wall. Correlations for velocity and temperature have been derived [15]. Using steady-state and time varying heat release rates in full-scale multi-room fire scenarios to generate an experimental data base to use in mathematical fire simulation models. The tests focused on smoke filling and selected measurements of the increasing temperatures over time [23]. Cooper developed correlations for the maximum temperature and velocity with limits which are dependent on the ratio r/H, and defined in the following equations.
0≤r/H≤0.75 T = 28.1EXP(−1.77 × b
!) × E /5×i0L/5+T∞ (20)
If 0.75≤r/H≤4.0 T =5.77×(b
!)0(.11× Q ?
J× H0@J+ T∞ (21)
If 0.2≤r/H≤4.0 V = 0.26 × (r
H)0e.e× Qe/5× H0e/5 (22)
0 200 400 600 800 1000 1200 1400 1600 1800
0.0 0.5 1.0 1.5 2.0
Tmax[°C] r/H 0 200 400 600 800 1000 1200 1400 1600 1800
0.0 0.5 1.0 1.5 2.0
Tmax [°C] r/H 0 200 400 600 800 1000 1200 1400 1600 1800
0.0 0.5 1.0 1.5 2.0
Tmax [°C] r/H 0 200 400 600 800 1000 1200 1400 1600 1800
0.0 0.5 1.0 1.5 2.0
Tmax [°C]
4.3.1- Maximum Velocity and Temperature during the fire event
The same calculation was done using Cooper correlative model, using the same data, the same dimensions of event, and the same positions for targets and sensors. Figure 22 and Figure 23 present the results for the velocity and the temperature of the hot gases, near the ceiling in a location expected to have maximum values.
Class 1 Class 2
Class 3 Class 4
Figure 22- Velocity near the ceiling from Cooper correlations
0 2 4 6 8 10 12 14
0 20 40 60 80
V[m/s] t [min] COOPER r/H=0.37 COOPER r/H=0.74 COOPER r/H=1.11 COOPER r/H=1.48 COOPER r/H=1.85 0 2 4 6 8 10 12 14
0 20 40 60 80
V[m/s] t [min] COOPER r/H=0.37 COOPER r/H=0.74 COOPER r/H=1.11 COOPER r/H=1.48 COOPER r/H=1.85 0 2 4 6 8 10 12 14
0 20 40 60 80
V[m/s] t [min] COOPER r/H=0.37 COOPER r/H=0.74 COOPER r/H=1.11 COOPER r/H=1.48 COOPER r/H=1.85 0 2 4 6 8 10 12 14
0 20 40 60 80
Class 1 Class 2
Class 3 Class 4,5
Figure 23- Temperature near the ceiling from Cooper correlations
4.3.2- Maximum Temperature and Velocity for different ratio r/H
The values of velocity and temperature of the gases near the ceiling are considered as maximum when the time is equal to 25 min. The variation of the maximum values during the event is plotted against the ratio r/H, depending of the fire class in Figure 24 and Figure 25.
0 500 1000 1500 2000 2500 3000
0 20 40 60 80
T[°C] t [min] COOPER r/H=0 COOPER r/H=0.37 COOPER r/H=0.74 COOPER r/H=1.11 COOPER r/H=1.48 COOPER r/H=1.85 0 500 1000 1500 2000 2500 3000
0 20 40 60 80
T[°C] t [min] COOPER r/H=0 COOPER r/H=0.37 COOPER r/H=0.74 COOPER r/H=1.11 COOPER r/H=1.48 COOPER r/H=1.85 0 500 1000 1500 2000 2500 3000
0 20 40 60 80
T[°C] t [min] COOPER r/H=0 COOPER r/H=0.37 COOPER r/H=0.74 COOPER r/H=1.11 COOPER r/H=1.48 COOPER r/H=1.85 0 500 1000 1500 2000 2500 3000
0 20 40 60 80

![Figure 8- Experience of Calorimeter hood [26]](https://thumb-eu.123doks.com/thumbv2/123dok_br/16813142.750992/44.892.240.660.103.409/figure-experience-of-calorimeter-hood.webp)
![Figure 13- The burning of old and new cars in open car park [24]](https://thumb-eu.123doks.com/thumbv2/123dok_br/16813142.750992/50.892.292.601.106.351/figure-burning-old-new-cars-open-car-park.webp)
![Figure 15- Curves of Rates of Heat Release from Burning of 3 Vehicles, Class 3 [19]](https://thumb-eu.123doks.com/thumbv2/123dok_br/16813142.750992/51.892.177.721.104.351/figure-curves-rates-heat-release-burning-vehicles-class.webp)
![Figure 16- HRR vs time for car fires initiated by fuel pool fire [26]](https://thumb-eu.123doks.com/thumbv2/123dok_br/16813142.750992/52.892.109.783.117.555/figure-hrr-time-car-fires-initiated-fuel-pool.webp)
![Figure 19- Temperature near the ceiling from Alpert correlations 0246810121416020406080V[m/s]t [min]ALPERT r/H=0ALPERT r/H=0.37ALPERT r/H=0.74ALPERT r/H=1.11ALPERT r/H =1.48ALPERT r/H=1.85024681012141602040 60 80V[m/s]t [min]ALPERT r/H=0ALPERT r/H=0.37ALPE](https://thumb-eu.123doks.com/thumbv2/123dok_br/16813142.750992/59.892.116.771.287.1002/figure-temperature-ceiling-alpert-correlations-alpert-alpert-alpert.webp)
![Figure 20- Vmax of all car classes calculated by Alpert correlations 0.02.04.06.08.010.012.014.016.00.00.51.01.52.0Vmax [m/s]r/H0.02.04.06.08.010.012.014.016.00.00.51.0 1.5 2.0Vmax[m/s]r/H0.02.04.06.08.010.012.014.016.00.00.51.01.52.0Vmax[m/s]r/H0.02.04.06](https://thumb-eu.123doks.com/thumbv2/123dok_br/16813142.750992/60.892.117.773.364.844/figure-vmax-classes-calculated-alpert-correlations-vmax-vmax.webp)
![Figure 22- Velocity near the ceiling from Cooper correlations 02468101214020406080V[m/s]t [min]COOPER r/H=0.37COOPER r/H=0.74COOPER r/H=1.11COOPER r/H=1.48COOPER r/H=1.850246810121402040 60 80V[m/s]t [min]COOPER r/H=0.37COOPER r/H=0.74COOPER r/H=1.11COOPER](https://thumb-eu.123doks.com/thumbv2/123dok_br/16813142.750992/62.892.116.778.331.748/figure-velocity-ceiling-cooper-correlations-cooper-cooper-cooper.webp)