Comparison
of Three Standards for
Evaluating Fetal Growth1
FRANCISCO MARDONES SANTANDER,~ GLORIA ICAZA NOGUERA,~
& MIRTA D~AZ v13~1.z~
Three birth weight standards wereapplied to 2986 live births and neonatal deaths in Santiago, Chile, in order to ascertain how useful the lOfh, 25fh, 75fh, and 90th percentile birth weights determined by these standards would be for selecting infants at high
risk of
neonatal death. This article reports the results of that study.A
study by Lubchenco et al. (2) thatdescribed intrauterine growth of a
United States population in Denver, Col-
orado, strongly stimulated the use of
growth charts for measuring
the
ade-quacy of birth weight. Since then various
local studies have been published that,
on the basis of the distribution of weight for each gestational age, classify births with weights lower than those of a certain cutoff percentile as “small for gestational age” (SGA); such births are deemed to involve cases of retarded growth unless
another examination shows the opposite
(2). Birth weights between the extreme percentiles, possibly the 10th and 90th or
the 25th and 75th, are considered ade-
quate for gestational age (AGA), while
those above the 90th or 75th are consid- ered large for gestational age (LGA).
Different available intrauterine growth curves set markedly different birth weight
‘Correspondence should be addressed to Dr. Fran- cisco Mardones Santander, The World Bank, Human Resources Division, 1818 H Street NW, Washington, DC 20433, USA. The study reported here was partially supported by Project 986/89, FONDECYT, Chile. This article wiB also be pub- lished in Spanish in the B&fin de la Oficim Sanitaria Panamericana, Vol. 112, No. 4, 1992.
‘Institute of Nutrition and Food Technology, Uni- versity of Chile, Santiago, Chile.
values corresponding to the inclusion
limits. In consequence, depending on the curve used, the same child may be clas- sified as belonging in different categories. This problem is particularly important in classifying SGA children, because several authors have shown that death rates are considerably higher among SGA children than among AGA ones for each gesta- tional age at birth; these mortality differ- ences have been described as more marked among term babies than among preterm ones (3-73).
The study described here grew out of a need cited by several authors (4, 7) for developing a means by which fetal growth standards could be used to predict mor-
tality risk, a subject which should be
studied in different populations.
The limits based on the percentiles noted above may be varied-according to the resources available for overseeing and intervening in the groups with great-
est need with different diagnostic and
therapeutic measures-by increasing or
reducing the population deemed at risk
of SGA or LGA (14). In view of this sit- uation, we propose that before defining the cutoff point, the fetal growth stand-
ard to be employed should be selected
(such as neonatal death) can be studied
in portions of a population deemed to
be SGA or LGA according to different standards.
When the distribution of birth weights by gestational age was studied in 97.75% of the live births in Chile in 1986 (17), the birth weight values of the lOth, 25th,
and 50th percentiles were found to be
greater than those of the Denver stand- ard (I), similar to those of the Aberdeen standard (la), and less than those of a
contemporary clinical survey conducted
in Santiago (29). These findings sug-
gested the possibility of choosing one of these various standards for clinical use based on neonatal death risk criteria.
The goal of the present study was to compare the three standards for apprais- ing fetal growth just mentioned by study- ing their diagnostic reliability and pre- dictive capacity in relation to neonatal deaths and survivals in Chile in 1986.
MATERIALS
AND METHODS
The study was carried out using birth weight and gestational age data obtained by the Civil Registry Service for all live births in the country in 1986. Data on birth weight, gestational age at birth, sex, and parity were available for 254,878 live births (98.3% of a total of 259,347) and 2,335 neonatal deaths (86.3% of a total of 2,705).
More than 98% of all births in Chile occur in hospitals. Gestational age is de- termined from the date of the mother’s last period; when that date is not re- corded by the pregnant woman or when the date reported does not agree with her clinical examination, it is estimated from
ultrasound examination (the country’s 26
health services have ultrasound equip-
ment) or postnatal examination by a pe- diatrician or both.
Public and private hospitals are re-
quired to report a births most significant
events on the birth certificate, which fam- ily members take to the Civil Registry for legal registration. Local Civil Registry of- fices are generally located in the mater- nity services of the hospitals themselves, which facilitates the registration process.
Birth registration has been further en-
couraged by making it a requirement for collecting financial social security bene- fits (including a family allotment for the insured and a single family subsidy when coverage is lacking) and for obtaining maternity leave in the case of working mothers.
Infant death certificates, which are re- quired for burial, are routinely filled out
by physicians-except in the 1% of cases
where infant deaths occur without med-
ical attention and are reported by
witnesses.
Although neonatal mortality by gesta-
tional age in preterm births seems to be more significant than mortality by birth weight, precise gestational age is difficult to determine from the pediatric point of view in neonates who are quite immature (20). Despite this difficulty, infants deemed to have less than 26 weeks of gestational age at birth were excluded from this study.
More than 20 years ago the Inter-
American Investigation of Mortality in
Childhood found underregistration of
neonatal deaths in Chile, especially in newborns weighing less than 1,000 g (21). Present estimates indicate that such un-
derregistration seems to be extremely
slight because of the great attention it receives. In this context, the latest PAHO report on health conditions in the Amer- icas, on the basis of data from the Latin
American Demographic Center, shows
Chile to be the Latin American country with the lowest underregistration of all deaths (1.2% in the period 1980-85) (22). The study reported here compared fe- tal growth standards found for popula-
tions in Denver, Colorado, U.S.A. (Z),
Aberdeen, Scotland (18), and Santiago,
Chile (19). The Denver standard, based on 5,635 cases broken down by sex, is
widely known in our country. The Ab-
erdeen standard, based on 46,703 births,
includes corrections for parity and the
child’s sex. The Santiago standard, based on 11,543 births, also takes the effects of sex and parity into account. This latter standard was derived from a middle-class
population delivering babies at the ma-
ternity clinic of the Catholic University’s Faculty of Medicine.
The standards compared give different values for a particular birth weight per- centile at each gestational age. Table 1 shows the birth weight values that each standard gives for the lOth, 25th, 75th, and 90th percentiles at week 40. As can be seen, the Santiago standard is the least strict for diagnosing SGA newborns, since the values of the 10th and 25th percen-
tiles are the highest and so include a
greater number of babies. The Denver standard is the most strict, while the Ab- erdeen standard falls between them. A comparison of other gestational age weeks shows differences of similar magnitude.
With respect to LGA, diagnosed using the 75th and 90th percentiles, the strict- ness of the three standards at week 40 are the reverse of those noted above. However, the birth weights cited by the Denver and Aberdeen standards for 75th and 90th percentile preterm newborns (not shown in Table 1) are higher than those cited by the Santiago standard.
The quantitative differences between
these three intrauterine growth curves
appear to reflect the presence or absence
of environmental or maternal factors ca-
pable of stimulating or retarding fetal
growth (15). Since the Santiago standard excludes a large number of such factors (19), its comparison with the other stand- ards shows that the birth weight values of the 10th and 25th percentiles increase throughout the range of gestational age, but that the birth weight values of the 75th and 90th percentiles decrease rela- tive to the other standards with respect to preterm births.
The Santiago and Aberdeen standards, in contrast to the Denver standard, do not include birth weight data for gesta-
Table 1. Birth weights (in grams) of the lOth, Xth, 75th, and 90th percentiles cited by the Denver, Aberdeen, and Santiago standards for newborns in the indicated gender and parity groups who were delivered at the gestational age of 40 weeks.
Standard, gender, and parity Denver
Males Females Aberdeen
Males, primipara Males, multipara Females, primipara Females, multipara Santiago
Males, primipara Males, multipara Females, primipara Females, multipara
10
2,700 2,630
2,870 2,950 2,730 2,810
3,027 3,152 2,897 3,022
Birth weights (g) of the indicated percentiles
25 75
2,995 3,610 2,905 3,440
3,130 3,710 3.,220 3,860 3,000 3,540 3,080 3,690
3,252 3,783 3,377 3,908 3,122 3,653 3,247 3,778
90
3,880 3,720
3,980 4,170 3,790 3,990
tional ages 24-25 weeks and 24-31 weeks, respectively. For this reason, to observe the effects of gestational age on mortality risk, the data were separated into three gestational age groupings: 26-31, 32-37,
and 38-42 weeks. In analyzing the last
two groupings the three standards were
compared, while in analyzing the first
grouping only the Denver and Santiago
standards were compared.
using sensitivity and specificity values (24). The most reliable indicator is that which
identifies groups yielding the highest
sensitivity and specificity values. (When the sum of the sensitivity and specificity values is 100 or less it means that the indicator has not succeeded in selecting
those affected better than mere random- ness-25.)
From the 1986 Santiago totals of 254,878 live births and 2,335 neonatal deaths for
which complete information was avail-
able, certain groups were excluded be- cause of their gestational age at delivery. Specifically, 330 newborns (0.13% of the total) had a gestational age of 25 weeks or less at birth, and 269 (0.1% of the total) had a gestational age of 43 or 44 weeks. Also, 247 neonatal deaths (10.6% of the total) occurred among infants with a ges- tational age of 25 weeks or less at birth, and eight neonatal deaths (0.3% of the total) occurred among infants with a ges- tational age of over 42 weeks at birth. All four of these groups were excluded from the study. Thus, 254,279 live births and 2,080 neonatal deaths were analyzed.
The three standards were compared using the lOth, 25th, 75th, and 90th per- centiles as cutoff points, the first two cut- off points being used to diagnose SGA and the last two to diagnose LGA. No other cutoff points were used, since none appeared in two of the three original publications (18, 19).
Sensitivity and specificity were derived
and assessed in combination through
comparative analysis of operating char-
acteristics (relative operating character- istics (ROC) analysis), which is useful for projecting the diagnostic reliability of these indicators onto a single chart (26, 27). There is always an inverse relationship between sensitivity and specificity; how- ever, by plotting sensitivity on one axis and 100 minus specificity on the other,
ROC analysis provides graphic expres-
sion of the relationship between the two in a positive sense (see Figure 1). In this way the probability of true positives is ex- pressed in relation to the probability of false positives; and as long as the former increase, so do the latter. The merits of different cutoff points can thus be weighed in terms of the relative probability of se- lecting true versus false positives.
For each of the three standards it was necessary to determine the SGA and LGA
infants among all the live births and
among the neonatal deaths (those dying at less than 28 days of age) by gestational age group. This was done using the pro-
cedures of the SAS computational pro-
grams package (23) and an IBM 4361 computer at the University of Chile.
The diagonal line that divides the chart into equal lower and upper areas is called the “line of indifference” because along it the sum of sensitivity plus specificity equals 100. The entire area below this line corresponds to points where sensitivity plus specificity equal less than 100, and
where the indicator involved does not
discriminate better than chance. Con-
versely, the ROC line or curve furthest
above the line of indifference recom-
mends itself as being, relatively speak- ing, the best of the various indicators being
compared in terms of sensitivity and
specificity.
The reliability with which the various To study predictive capacity, it is nec-
fetal growth standards could be used to essary to recall that the SGA and LGA
detect high mortality risk was appraised populations identified by the three stand-
Figure 1. Relative operating characteristics (ROC) analysis of SGA and LGA populations
identified by the Denver, Aberdeen, and Santiago standards in the groups with 38-42 weeks of gestational age (Figure I-A), 32-37 weeks of gestational age (Figure l-B), and 26-31 weeks of gestational age (Figure I-C).
995 99 98 95 90
2 1
2 5 10 20 3040506070 80 90 95 9899995
loo- spe&ty
A.
0 DenverA Aberdeen
n Santiago
99 5 99 98
95
90
$ ;I
E 50
c% 40 30 20
10
5
2
~1111II
I I
14
III
I I !!!I!!! I! !I
2 5 10 20 3040 5060 70 80 90 95 98 9999 5
lOO-specikily
C. 0 Denver
n Santlago
ards presented different prevalences of
health deficits; therefore, predictive ca- pacity cannot be derived from sensitivity and specificity (24). In contrast to sensi- tivity or specificity, which queries the va-
21I/XI ~~~~~~~ 11 I@ ! ! ! I!!!!! ! ! !!
2 5 10 20 3040506070 80 90 95 9899995
B.
1oo-speciflclty
l Denver A Aberdeen
n Santlago
lidity of a diagnosis in cases where dam- age is or is not already present, predictive capacity refers to the presence of damage in the (SGA or LGA) study subjects that places them at high risk (24).
RESULTS
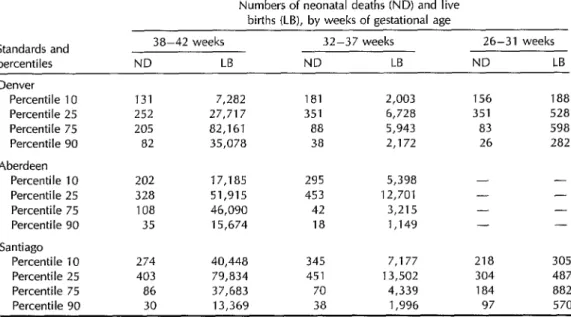
Table 2. The numbers of neonatal deaths (ND) and live births (LB) occurring among those portions of the 1986 Santiago study population with birth weights below the 10th and 25th percentile cutoffs and above the 75th and 90th percentile cutoffs of the Denver, Aberdeen, and Santiago standards, by gestational age at birth groupings.
Numbers of neonatal deaths (ND) and live births (LB), by weeks of gestational age Standards and
percentiles
38-42 weeks ND LB
32-37 weeks 26-31 weeks
ND LB ND LB Denver
Percentile 10 Percentile 25 Percentile 75 Percentile 90 Aberdeen
Percentile 10 Percentile 25 Percentile 75 Percentile 90 Santiago
Percentile 10 Percentile 25 Percentile 75
Percentile 90
131 7,282 181 2,003 156 188
252 27,717 351 6,728 351 528
205 82,161 88 5,943 83 598
82 35,078 38 2,172 26 282
202 17,185 295 5,398 -
328 51,915 453 12,701 -
108 46,090 42 3,215 -
35 15,674 18 1,149 -
274 40,448 345 7,177 218 305
403 79,834 451 13,502 304 487
86 37,683 70 4,339 184 882
30 13,369 38 1,996 97 570
- - -
were greatest when the Santiago stand-
ard was applied to the gestational age
groups of 38-42 and 32-37 weeks, and
also when the Santiago standard’s 10th
percentile cutoff was applied to the 26- 31 week group. When the 25th percentile
cutoff was employed, the Denver stand-
ard was found to detect the largest num- ber of SGA neonatal deaths in the 26-31
week group. Regarding LGA neonatal
deaths, again the situation was more
mixed: The Santiago standard detected the largest numbers in the 26-31 week group; the Denver standard detected the largest numbers in the 38-42 week group and also in the 32-37 week group when the 75th percentile cutoff was used; and the Santiago and Denver standards de- tected equal numbers (more than the Ab- erdeen standard) in the 32-37 week group
when the 90th percentile cutoff was
employed.
Table 3 shows sensitivity and specific- ity values. In general the Santiago stand-
42 Bulletin of PAHO 26(l), 2992
ard exhibited the greatest sensitivity for
SGA, followed by the Aberdeen stand-
ard. However, the situation was gener-
ally reversed with regard to specificity,
with the Denver standard being most
specific, followed by the Aberdeen stand- ard, the Santiago standard coming last.
Regarding LGA diagnosis, the Denver
standard appeared as sensitive or more sensitive than the Santiago standard in assessing the 38-42 and 32-37 week groups, while the Santiago standard was the most sensitive in assessing the 26-31 week group. The Aberdeen standard, the least sensitive, exhibited the greatest spec- ificity in assessing the two gestational age groups to which it was applied.
Figures l-3 display a combined ROC analysis of sensitivity and specificity (100 minus specificity) for the three different
gestational age groups. The results in-
dicate on the one hand that none of the
applied standards succeeded in distin-
Table 3. The sensitivity and specificity with which neonatal deaths were detected by the SGA and LGA groupings derived by applying the Denver, Aberdeen, and Santiago standards, by gestational age group.
Weeks of gestational age
Standards and 38-42 32-37 26-31
percentiles Sensitivity Specificity Sensitivity Specificity Sensitivity Specificity Denver
Percentile 10 16.5 96.8 23.7 93.7 20.9 97.7 Percentile 25 31.7 87.6 46.1 78.0 47.0 87.2 Percentile 75 25.7 63.1 11.5 79.8 11.1 62.6 Percentile 90 10.3 84.3 5.0 92.6 3.5 81.4 Aberdeen
Percentile 10 27.4 92.3 42.4 82.2 - - Percentile 25 44.6 76.6 65.1 57.2 - - Percentile 75 14.6 79.2 6.0 88.9 - - Percentile 90 4.8 92.9 2.6 96.0 -
Santiago
Percentile 10 37.2 81.8 49.6 76.1 32.6 93.5 Percentile 25 54.8 64.0 64.8 54.4 45.4 86.4 Percentile 75 11.7 82.9 10.1 85.1 27.5 48.2 Percentile 90 5.7 92.9 5.5 93.2 14.5 64.9
of neonatal death, because the charted values fall below the line of indifference. On the other, they indicate that the three
standards can distinguish SGA popula-
tions at relatively high risk of neonatal mortality, because all the SGA lines are
somewhat above the line of indiffer-
ence-and indeed are about the same
distance above it in most cases.
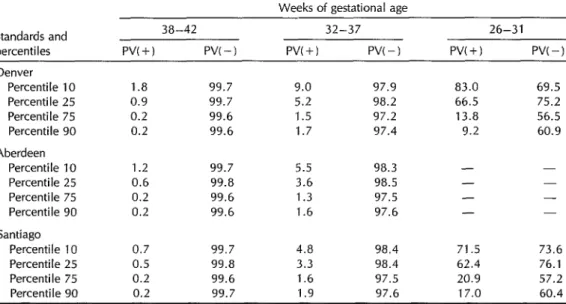
Regarding predictive capacity, Table 4
shows that positive SGA predictive val-
ues were clearly low except in the 26-31 week group. Likewise, positive LGA pre- dictive values were clearly low for all three gestational age groups. Negative predic- tive values were quite high in all cases
(regarding both SGA and LGA), except
in the 26-31 week group.
DISCUSSION AND
CONCLUSIONS
In evaluating the diagnostic power of
SGA as defined by the three standards with respect to neonatal death, we found
that the differences between the three
standards were not very marked, making selection of the most adequate standard difficult. Moreover, relative to what we observed regarding another health prob-
lem (deficient infantile growth--28), we
found that the ROC lines (see Figures l- 3) were not far above the line of indif- ference; the reason for this probably lies in a lack of concordance between the se- lected percentiles and the real risks of
neonatal death. In addition, we found
that the diagnostic power of LGA as de- fined by the three standards was non- existent, indicating an even greater lack of concordance between the selected per- centiles and real risks of neonatal death.
The positive predictive values of SGA as defined by the three standards were generally very low (see Table 4), because of the low incidence of neonatal deaths. The exception was SGA among the 26- 31 week group, where the incidence of neonatal deaths was much higher. The low incidence of neonatal deaths with a diagnosis of LGA also explains why the
Table 4. Positive (+) and negative (-1 predictive values of the SGA and LGA groupings derived by applying the Denver, Aberdeen, and Santiago standards, by gestational age group.
Weeks of gestational age Standards and
percentiles Denver
Percentile 10
Percentile 25 Percentile 75 Percentile 90 Aberdeen
Percentile 10 Percentile 25 Percentile 75 Percentile 90 Santiago
Percentile 10
Percentile 25 Percentile 75 Percentile 90
38-42 32-37 26-31
Pv(+) PVC-1 Pv(+) PVC-1 PVC+) w-1
1.8 99.7 9.0 97.9 83.0 69.5
0.9 99.7 5.2 98.2 66.5 75.2
0.2 99.6 1.5 97.2 13.8 56.5
0.2 99.6 1.7 97.4 9.2 60.9
1.2 99.7 5.5 98.3 -
0.6 99.8 3.6 98.5 -
0.2 99.6 1.3 97.5 - -
0.2 99.6 1.6 97.6 - -
0.7 99.7 4.8 98.4 71.5 73.6
0.5 99.8 3.3 98.4 62.4 76.1
0.2 99.6 1.6 97.5 20.9 57.2
0.2 99.7 1.9 97.6 17.0 60.4
very low. Conversely, all the negative
predictive values for both SGA and LGA were very high, in accord with the high proportion of survivors, except in the 26-
31 week group where survivors were
fewer. Overall, it is to be expected that a better definition of the populations at risk would improve predictive capacity.
An important conclusion of this study is that the limits defining the risk of neo- natal death do not closely correspond to the SGA or LGA percentiles selected ac- cording to the three standards involved. This has been pointed out previously in a study working with data from the United Kingdom (29). The basic reason for this weak correlation between the newborn’s well-being and the percentile birth weights defined by the various standards seems to lie in the fact that the so-called stan-
dards of fetal growth have been con-
structed by relating birth weight to ges- tational age, ascribing to it certain limits of normality with a measure of statistical distribution, without validating its diag- nostic reliability and capacity for predict- ing injury to health.
44 Bulletin of PAHO 26(Z), 1992
Wilcox has noted the importance of
studying the combined behavior of birth weight and gestational age in seeking to
construct fetal growth standards cor-
rectly, the reason for this being that the true direction of cause and effect is un- known (6). Hoffman et al. also propose this kind of analysis for understanding the combined effect of birth weight and gestational age on infant survival (30), as
does Falkner in stressing that perinatal
outcome is the key aim in judging the
adequacy of prenatal growth (32). It is to be expected that better deter- mination of the probabilities of death or functional injury, derived from adequate
measurement of the combined effect of
birth weight and gestational age, will re- sult in fetal growth standards with greater
diagnostic reliability and predictive ca-
The results of that study, based on neo- natal mortality data determined by birth
weight and gestational age at birth in 10.
Denver for the period 1958-1969, to-
gether with the results of a later study also from Denver for the period 1974- 1980 (7), were used extensively in clinical practice. Still, progress in perinatal care 11. since then has produced quite a marked decrease in the risks of neonatal death, which in turn has created a need to ex- 12. plore the use of new curves where the risks of death are better adjusted to the
present reality of a given population. 13.
REFERENCES
1.
2.
3.
4.
5.
6.
7.
8.
9.
Lubchenco LO, Hansman C, Dressler M, Boyd E. Intrauterine growth as estimated from liveborn birth-weight data at 24 to 42 weeks of gestation. Pediatrics. 1963; 32(5):793-800.
Thomson AM. Fetal growth and size at birth. In: Barron SL, Thomson AM, eds. Obstetrical epidemiology. London: Aca- demic Press; 1983; 89-142.
Battaglia FC, Frazier TM, Hellegers AE. Birth weight, gestational age and preg- nancy outcome, with special reference to high birth weight-low gestational age in- fants. Pediafrics. 1966;37(3):417-22. Lubchenco LO, Searls DT, Brazie JV. Neonatal mortality rate: relationship to birth weight and gestational age. 1 Pediafr. 1972;81(4):814-22.
Goldstein H. Factors related to birth weight and perinatal mortality. Br Med Bull. 1981;37(3):259-64.
Wilcox AJ. Birth weight, gestation and the fetal growth curve. Am J Obsfef Gynecol. 1981;139(8):863-67.
Koops BL, Morgan LJ, Battaglia FC. Neo- natal mortality risk in relation to birth weight and gestational age: update. 1 Pe- diafr. 1982;101(6):969-77.
Williams RL, Creasy RK, Cunningham GC, Havens WE, Norris FD, Tashiro M. Fetal growth and perinatal viability in Califor- nia. Obsfef Gynecol. 1982;59(5):624-32. Bernard RI’, Sastrawinata S. Infant out- come, fetal growth, and pregnancy care: relationships in Indonesian university ob-
14.
15.
16.
17.
18.
19.
20.
21.
22.
stetrics. Acfa Paediafr Stand. 1985;319 (suppl):lll-19.
Sporken JMJ, de Boo T, Boon JM, Hein HR. Survival probabilities of infants de- livered prior to the 34th week of preg- nancy as estimated by means of a logistic model. Eur ] Obsfef Gynecol Reprod Biol. 1985;19:215-21.
Institute of Medicine. Preventing low birth weight. Washington, DC: National Acad- emy Press; 1985.
Mardones Santander F, Mardones Restat F. Mortalidad infantil de 10s pequefios para la edad gestacional. Rev Ckil Pediafr. 1987;58(1):100. (Letter to the editor). Mardones Santander F, Mardones Restat F, Rosso P, Diaz M, Icaza G. La mortal- idad infantil de 10s pequefios para la edad gestacional en Chile. Rev Lafinoam Peri- nafol. 1987;7(1):33-41.
Habicht J-P, Meyers LD, Brownie C. In- dicators for identifying and counting the improperly nourished. Am J Clin Nufr. 1982;35(5 suppl):1241-54.
Keirse MJNC. Epidemiology and etiology of the growth retarded baby. Clin Obsfef Gynaecol. 1984;11(2):415-36.
Murrells TJ, Smith TM, Catford JC. The use of logic models to investigate social and biological factors in infant mortality: I, methodology. Sfaf Med. 1985;4:175-87. Mardones Santander F, Mardones Restat F, Dachs N, Dfaz M. Distribucibn de1 peso al nacer para cada edad gestacional en Chile. Rev Ckil Pediafr. 1989;60(3):181-88. Thomson AM, Billewicz WZ, Hytten FE. The assessment of fetal growth. J Obsfef Gynecol Br Comm. 1968;75(9):903-16. Juez G, Lucero E, Ventura-Jun& P, Gon- zdlez H, Tapia JL, Winter A. Crecimiento intrauterine en reciGn nacidos chilenos de clase media. Rev Ckil Pediafr. 1989;60(4): 198-202.
Oto MA, Burgos J, Martinez V. Mortali- dad neonatal en un hospital de Santiago. Rev Ckil Pediafr. 1986;57(3):278-82. Legarreta A, Aldea A, L6pez L. Omisi6n de1 registro de defunci6n de niiios ocur- ridas en maternidades. Bol
Of
Sanif Panam. 1973;75(4):303-14.23. SAS Institute, Inc. SAS user’s guide: basics, version 5 edition. Cary, North Carolina: 1985. 24. Vecchio TJ. Predictive value of a single
diagnostic test in unselected populations. N Engl ] Med. 1966;274(21):1171-73. 25. Youden WJ. Index for rating diagnostic
tests. Cancer. 1950;2:32-35.
26. Erdreich LS, Lee ET. Use of relative op- erating characteristics analysis in epide- miology. Am J Epidemiol. 1981;114(5):649- 62.
27. Brownie C, Habicht J-P, Cogill B. Com- paring indicators of health and nutritional status. Am J Epidemiol. 1986;124(6):1031- 44.
28. Mardones Restat F, Jones G, Mardones Santander F, Dachs N, Habicht J-P, Diaz M. Growth failure prediction in Chile. Inf J Epidemiol. 1989;18(suppl 2):44-49. 29. Hepburn M, Rosenberg K. An audit of
the detection and management of small for gestational age babies. Br ] Obsfef Gy- naeco2. 1986;93(3):212-16.
30. Hoffman HJ, Stark CR, Lundin FE, Ash- brook JD. Analysis of birth weight, ges- tational age, and fetal viability; U.S. births. Obsfef Gynecol Surv. 1974;29(9):651-81. 31. Falkner F. Key issues in perinatal growth.
Acfa Paediafr Stand. 1985;319(suppl):21-25.
Video on Foster Care
for
Children with
HIV/AIDS
An l&minute video called With Loving Arms, produced by the Child Welfare League of America, portrays three different foster care situa-
tions in which the children have HIV/AIDS, focusing on the needs of
both these children and their foster parents. Viewers are reminded that a consistent primary care giver is essential in the life of any child,
with or without AIDS. Babies who are abandoned in the hospital can
suffer extreme emotional deprivation, which can adversely affect their
immune system. This interrelationship between the immune system
and stress may account for the fact that children with AIDS placed in foster day-care settings are living longer than expected.
Wifh Loving Arms is accompanied by a discussion guide. It is in-
tended for community-based AIDS organizations, policy making and
advocacy groups, child welfare administrators, practitioners, and any-
one working with HIV-infected children. For further information, con-
tact the Child Welfare League of America, 440 First Street, N.W., Suite
310, Washington, D.C. 20001-2085; telephone (202) 638-2952.
Source: Holmes, E., With loving arms, Canadian AIDS News V(1):13, NovlDec 1991.