T
Moderators of the association between discrimination and
alcohol consumption: indings from a representative sample
of Brazilian university students
Moderadores da associação entre padrão de consumo de álcool e discriminação:
resultados de uma amostra representativa de universitários brasileiros
Isabela Zeni Coelho,1 João Luiz Bastos,1 Roger Keller Celeste2
Abstract
Introduction: Few studies about discrimination and patterns of alcohol consumption among youth populations have been conducted outside the United States addressing different types of discriminatory experiences, in addition to racially motivated events. This study investigated moderators of the association between discrimination attributed to single and multiple reasons and patterns of alcohol consumption.
Methods: This cross-sectional study enrolled a representative sample (n = 1,264) of undergraduate students from Florianópolis, southern Brazil, in 2013. Analyses included adjustment of associations for covariates in ordinal logistic regression models
and the examination of effect modiication by common mental
disorders, year of study and age.
Results: Discrimination was reported by 65.8% of the students, and alcohol consumption, by 80.0%. Over half of the students reported being discriminated against for two or more reasons. The odds of alcohol-related problems were higher among last-year students that reported discrimination (odds ratio [OR]
= 1.9, 95% conidence interval [95%CI] 1.0-3.4) or multiple
reasons for being discriminated against (OR = 2.3, 95%CI
1.3-4.3), when compared to irst-year students that did not report
discrimination. For the whole sample, there were no associations between discrimination, discrimination attributed to multiple reasons and patterns of alcohol consumption (OR = 1.0, 95%CI 0.8-1.4; and OR = 0.9, 95%CI 0.5-1.6).
Conclusions: The effects of discrimination on the patterns of alcohol consumption are seen at a critical period in university
life, speciically during the completion of undergraduate studies.
Keywords: Social discrimination, prejudice, students, alcohol-related disorders.
Resumo
Introdução: Há uma escassez de estudos sobre discriminação e consumo de álcool conduzidos fora dos Estados Unidos com populações jovens e abordando outros tipos de discriminação, além da racial. Este estudo investigou a associação entre experiências de discriminação, suas motivações e consumo de
álcool, conforme potenciais modiicadores de efeito.
Métodos: Realizou-se um estudo transversal com amostra representativa (n = 1.264) de graduandos de uma universidade pública de Florianópolis, sul do Brasil, em 2013. As associações foram ajustadas para covariáveis através de regressão logística
ordinal, incluindo modiicação de efeito por transtornos mentais
comuns, ano de estudo e idade.
Resultados: Entre os estudantes, 65,8% relataram ter sofrido discriminação, e 80,0 % referiram consumir álcool. Mais da metade dos estudantes indicou que suas experiências de discriminação foram motivadas por duas ou mais razões. A chance de apresentar problemas relacionados ao consumo de álcool foi maior entre os alunos do último ano da graduação, que referiram discriminação (odds ratio [OR] = 1,9, intervalo de coniança de 95% [IC95%] 1,0-3,4) ou múltiplas motivações para terem sido discriminados (OR = 2,3, IC95% 1,3-4,3), quando comparados com os calouros, que não relatam discriminação. Para o conjunto da amostra, não houve associação entre discriminação, suas motivações e o padrão de consumo de álcool (OR = 1,0, IC95% 0,8-1,4 e OR = 0,9, IC95% 0,5-1,6).
Conclusões: Os efeitos da discriminação sobre o padrão de consumo de álcool se manifestam em um período crítico da vida
universitária, especiicamente durante a inalização dos estudos
de graduação.
Descritores: Discriminação social, preconceito, estudantes, desordens relacionadas ao consumo de álcool.
1 Graduate Program in Public Health, Universidade Federal de Santa Catarina (UFSC), Florianópolis, SC, Brazil. 2 Graduate Program in Dentistry, Universidade
Federal do Rio Grande do Sul (UFRGS), Porto Alegre, RS, Brazil. Financial support: none.
Submitted Sep 05 2014, accepted for publication Nov 19 2014. No conlicts of interest declared concerning the publication of this article.
Introduction
Discrimination was conceived as a phenomenon of
scientiic interest only in the early twentieth century. Since then, its deinition and methods of investigation have changed signiicantly in close association with
strategies to eliminate or reduce discrimination against minority groups across distinct historic periods.1 Recently,
discrimination has been deined as a biased behavior
including actions that not only bring harm or disadvantage to another group, but also unfairly favor the perpetrator’s own group and produce relative disadvantages.2 In the
ield of public health, discrimination is deined as an
unacceptable event underlying many health inequities,
as well as a speciic form of stress that may affect the health of its victims signiicantly,3-5 particularly because it is unpredictable and uncontrollable.6 Accordingly, it has been linked to a variety of health outcomes, such as high blood pressure, breast cancer, obesity and drug use.5 Pascoe & Smart-Richman6 found that discrimination has potentially pathogenic effects, especially on mental health outcomes. Moreover, recent studies suggest the existence of a possible association between discrimination and alcohol use or abuse.4,6-10
Alcohol use or abuse is a considerable problem in contemporary societies, and it is closely associated with negative short- and long-term health outcomes. In particular, research suggests that victims of discrimination may use alcohol as a coping strategy.11,12 Terrell et al.,4 in a study conducted in the United States with black adolescents, found that the higher the racial discrimination-induced anger scores, the greater the alcohol consumption among adolescents. Another study13 found that discrimination was prospectively associated with use of substances, such as tobacco, alcohol and other drugs. Additionally, the association between experiences of discrimination and alcohol consumption may be
moderated by speciic factors,14-17 such as supportive parenting,15 ethnic identity,14,17 linguistic acculturation and time spent in the United States.16 Other studies suggest that the association between discrimination
and alcohol consumption may be mediated by speciic
phenomena, such as anger,15,16 delinquent behaviors,18 hostility,15 and anxiety or depression.13
Despite the growth of research aimed at investigating the associations between discriminatory experiences and alcohol use or abuse,19 some knowledge gaps remain. Most studies have been conducted in the United States.19,20 Few investigations have focused on youth populations,21 speciically university students, who are at a stage in life characterized by greater independence from parents,22 entry into the labor market and acquisition of health behaviors that may persist throughout life.
Studies examining the causal mechanisms through which discrimination affects health outcomes and health behaviors, including patterns of alcohol consumption, are also scarce.20 Furthermore, most studies are restricted to racial discrimination.19-21 Therefore, the hypothesis that multiple types of discrimination may combine and simultaneously produce substantially greater impacts on
health has been insuficiently explored in the literature.19 Our review of the literature revealed that only two studies8,21 have found associations between discriminatory experiences attributed to two or more reasons and worse physical and mental health outcomes. Additionally, few studies have assessed potential moderators of the association between discrimination and alcohol consumption among university students. This study examined patterns of alcohol consumption according to socioeconomic and demographic characteristics of undergraduate students of Universidade Federal de Santa Catarina, in southern Brazil. Moreover, it evaluated the association between discriminatory experiences attributed to a single reason or to multiple reasons and the pattern of alcohol consumption after adjusting for confounders, and examined whether this association
was modiied by year of study in university, common
mental disorders and age.
Methods
Study population
This cross-sectional, exploratory investigation was part of a larger study, Racial inequalities in health: measuring self-reported experiences of discrimination in Brazil, conducted at the Department of Public Health, Universidade Federal de Santa Catarina (UFSC), Florianópolis, Santa Catarina, Brazil. The reference population for this study was all 19,963 UFSC students
enrolled in undergraduate courses in the irst half of 2012.
Sample size and sampling strategy
individual lifetime experiences of explicit discrimination in different life domains in Brazil. This instrument contains 18 items that should be answered using a four-point Likert-like scale: 1) no, never; 2) yes, this happened to me once or a few times; 3) yes, it happened to me several times; and 4) yes, this always happens to me. For each item, the respondents were required to state the reason(s) for the differential treatment (social class, race, gender etc.), the level of discomfort associated with such experience(s), and whether they attributed the experience to discrimination (no/yes). The internal
consistency coeficient of this instrument, assessed
using Cronbach’s alpha, was 0.80. Participants were
classiied as being discriminated against whenever they
reported any instance of differential treatment attributed to discrimination. The complete set of discrimination items is shown in Table 1.
Covariates
Respondents’ sex (male/female), age (16-19, 20-22, 23-27 and 28-52 years) and socioeconomic status
were also reported. Socioeconomic status was classiied
according to the Brazilian National Wealth Score,25 and the resulting distribution was later divided into quintiles. Exploratory effect modifying variables were common mental disorders, year of study in university and age. Common mental disorders were assessed using a 12-item Brazilian version of the General Health Questionnaire.26 Cronbach’s alpha for the internal consistency of this instrument was 0.84. Students were divided, according
to year of study in university, into irst-year, second-year
and last-year groups. Information on whether admission to the university was through a quota system was also collected. At the time of data collection, access to university was through an entrance exam in which 20% of places were reserved for students that had attended public elementary and secondary schools, and 10% for students that had attended public secondary school and
self-identiied as black or brown.
Statistical analysis
The relative and absolute frequencies of alcohol consumption were estimated according to sociodemographic variables (socioeconomic status, age, sex), admission to university through quotas, discriminatory experiences and number of reasons for being discriminated against (not discriminated, discriminated against for one reason, discriminated
against for two or more reasons). Statistical signiicance
was calculated using the chi-square test, adjusted for the sampling weights and the complex sampling design. complex sampling design and adding 10% to compensate
for possible non-responses.
Participants were selected according to a two-stage
complex sampling procedure. In the irst stage, which
determined the primary sampling units, 12 of the 70 undergraduate courses offered by UFSC were selected with probability proportional to size: Accounting, Law, Electrical Engineering, Mechanical Engineering, Chemical Engineering, Sanitary and Environmental Engineering, History, Teaching, Psychology, Dentistry, Medicine and Information Technology. Next, all individuals were selected according to three
pre-deined classes: irst-year, second-year and last-year
students. Therefore, not all students of each of the selected undergraduate courses were invited to take
part in the study, as only those in their irst, second
or last year of study were eligible to take part in the study.
Data collection
The instrument for data collection was pretested in a group of 17 students whose socioeconomic and
demographic proile was similar to that of the target
population. After that, a pilot-study was carried out
with 43 dentistry students not included in the inal
sample. Data were collected between March and May 2012. Fieldworkers administered self-completed questionnaires to the selected students in their
classrooms, after authorization from university oficials
had been obtained. Mean questionnaire completion time was 20 minutes. Data were subjected to double-entry data checking using EpiData v.3.1 and automatic checks for consistency and range.
Outcome
The instrument used, the Alcohol Use Disorders
Identiication Test (AUDIT), comprises 10 items about
the frequency of alcohol consumption and alcohol-related problems.24 Cronbach’s alpha for the internal consistency of the instrument was 0.75. Two categories of the AUDIT
were deined; the irst, alcohol consumption, included
items 1-3 and a score ranging from 1 to 12; the second, alcohol-related problems, included items 4 to 10 and a score of 13 to 28. Participants who answered never
to the irst AUDIT question and, therefore, had a score equivalent to zero were classiied as alcohol abstainers.
Main exposure
Interaction terms between discrimination and age, year of study in university, and common mental disorders were also included in the regression models. Effect
modiication was conirmed according to consistency of results, magnitude of effect and statistical signiicance. The statistical signiicance of observed differences was
assessed using the Wald test, adjusted for sampling weights and the complex sampling design. Two-tailed p
values lower than 5% were statistically signiicant.
All procedures followed in this study were in accordance with the ethical standards of our International Review Board, the Ethics Committee on Human Research of Universidade Federal de Santa Catarina, and with the Helsinki Declaration of 1975, as revised in 2000. All participants signed an informed consent term before answering the questionnaire.
Associations between discrimination, number of reasons for being discriminated against and pattern of alcohol consumption were adjusted for confounding factors using ordinal logistic regression models; odds
ratios (OR) and 95% conidence intervals (95%CI) were
calculated. Brant’s test was used to test the model’s proportional odds assumption; only one variable (sex) violated this assumption in the unadjusted model. In the adjusted models, however, all variables had p values greater than 5% according to Brant’s test. Discrimination was included in the models as a dichotomous variable, because previous exploratory analyses revealed no dose-response associations between discrimination and patterns of alcohol consumption.
All covariates were sequentially included in the adjusted model, irrespective of their p values.
Item Speciic situation of differential treatment
1 Have you ever been mistaken for an employee of an establishment when you were actually a customer? For instance, mistaken for a salesperson, clerk or waiter?
2 When in stores, restaurants or cafes, have you ever been treated unfairly compared with other customers?
3 When in government agencies, such as registry ofices, transit departments and utility companies, have you ever been treated unfairly compared to other people?
4 Have you ever been watched, chased or arrested by policemen or security guards without apparent reasons for that? Consider places such as stores, banks, streets, parties and public places.
5 Have you ever been physically assaulted by policemen, security guards, unknown people or even acquaintances without apparent reasons for that?
6 Have you ever been treated as if you were unintelligent or unable to perform any activity in school or college? Consider current (college) and past (school) situations during which you were treated like that by teachers or friends although you
were capable and suficiently intelligent to do what was required.
7 Have you ever been treated as if you were unintelligent or unable to perform any duties in the workplace? Consider situations in which you were treated like that by colleagues, superiors and customers even though you were capable to perform those duties.
8 Have you ever been unfairly evaluated in exams or other academic activities in school or college compared to your classmates?
9 Have you ever been evaluated unfairly compared to your coworkers in the workplace?
10 While trying to date somebody, have you ever been treated with contempt although you gave no reason for that? Consider only situations in which you were treated worse than others that also tried to date the same person.
11 Has the family of someone with whom you had an intimate relationship rejected you or tried to force you to break up with him/her?
12 Have you ever been treated unfairly by your parents, uncles and aunts, cousins or grandparents compared to other relatives?
13 Have you ever been called names that you did not like or were pejorative? Consider situations in the streets, on buses, at shopping malls, banks, stores, parties, schools, workplaces or other public places.
14 Have you ever been excluded or left out by a group of school or college friends? Consider recent (college) or past (school) situations while engaging in sports, attending classes, doing group work, or when at parties, meetings or other encounters with friends.
15 Have you ever been excluded or left out by your coworkers? Consider situations while you were working in teams, or when you were at meetings, congresses, events, parties and informal gatherings.
16 Have you ever been excluded or left out by people in your neighborhood? Consider situations that happened while you were in neighborhood meetings or parties, or attending other social events.
17 Have you ever taken part in a selection process for a job in which you were rejected despite seemingly having the best
qualiications among all candidates?
the university through quotas, those in the poorest socioeconomic quintile and women reported higher rates of discrimination than their counterparts. Just over half of the students reported discrimination attributed to two
or more reasons (data not shown in tables or igures).
Male interviewees, respondents aged 23-27 years, participants in the wealthiest socioeconomic quintile, students not admitted to the university through quotas, those in the last year of study and those that reported discriminatory experiences had higher frequencies of alcohol-related problems (Table 2). Individuals who reported discrimination attributed to two or more reasons also had a higher frequency of alcohol-related problems. Only comparisons according to sex and admission to
university were statistically signiicant.
Results
Of 1,264 students eligible for the study (77 had their enrolment suspended at the time of data collection), 1,023 completed the questionnaire, which corresponds to a response rate of 81.0%. Over half of the participants were men, two thirds were younger than 22 years, and about 25.0% entered university through the quota system.
The overall frequency of self-reported discrimination was 65.8% (95%CI 57.4-73.4). History students reported the highest frequency of discriminatory experiences (80.3%), and only Mechanical Engineering students had a frequency of discrimination below 50.0%. Older students, those who were admitted to
Characteristics
Sample distribution*
n (%)
AUDIT†
p Alcohol
abstainer
Alcohol consumption
Alcohol-related problems
Sex‡ 0.001
Male 533 (55.7) 10.4 74.0 15.6
Female 455 (44.3) 15.0 79.8 5.3
Age (years)‡ 0.475
16-19 307 (29.6) 14.3 74.2 11.6
20-22 352 (36.0) 13.3 77.6 9.1
23-27 263 (26.4) 10.0 76.6 13.4
28-52 75 (8.0) 10.6 83.3 6.0
Socioeconomic status (quintiles)‡ 0.179
1 (poorest) 202 (21.9) 18.2 76.5 5.3
2 201 (21.1) 9.9 77.6 12.5
3 196 (20.4) 12.4 74.8 12.8
4 193 (18.5) 10.7 79.7 9.6
5 (wealthiest) 190 (18.1) 8.5 76.2 15.3
Admission to university through quotas‡ 0.003
Yes 214 (22.6) 19.3 74.9 5.8
No 793 (77.4) 10.5 77.2 12.3
Year of study in university‡ 0.231
First year 450 (40.3) 14.9 74.5 10.6
Second year 331 (32.8) 13.2 75.8 11.0
Last year 242 (26.9) 6.9 81.5 11.6
Discrimination (score)§ 0.277
Not discriminated against 369 (34.2) 10.4 79.2 10.4
Discriminated against 654 (65.8) 13.2 75.5 11.3
Reasons for being discriminated§ 0.228
Not discriminated against 388 (36.0) 10.3 79.6 10.1
Discriminated for one reason 129 (11.6) 13.6 78.6 7.7
Discriminated for two or more reasons 506 (52.4) 13.3 74.5 12.3
Total 1,023 (100.0) 12.2 76.8 11.0
Table 2 - Sociodemographic characteristics of the undergraduate students of Universidade Federal de Santa Catarina and association with patterns of alcohol consumption (Florianópolis, Southern Brazil, 2013)
* Relative frequencies are adjusted for sampling weights and complex sampling design.
† Alcohol Use Disorders Identiication Test.
‡ Sixteen to 44 values were missing for these variables.
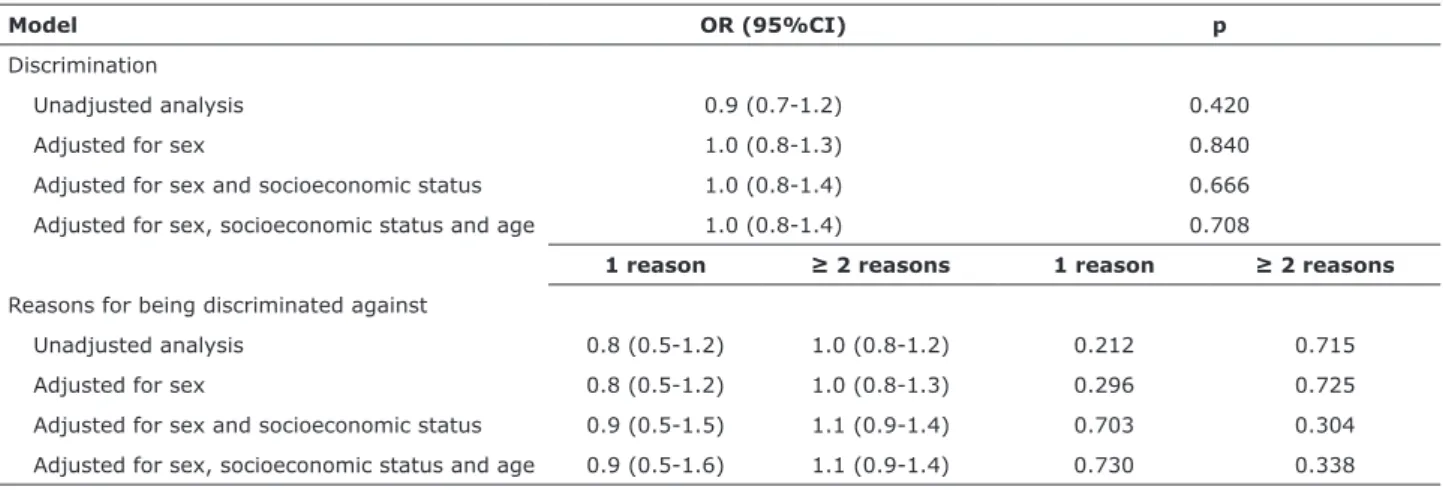
Reports of discrimination were not associated with the outcome in the whole sample; the measure of
effect was close to 1.0 and not statistically signiicant
in the multivariable models (Table 3). There was also no association between the number of reasons for being discriminated against and the patterns of alcohol consumption in the full sample, even after adjusting for confounding variables (Table 3).
However, Figures 1 and 2 show that year of study in university affected the association between discrimination and pattern of alcohol consumption, particularly The odds of consuming alcohol or having
alcohol-related problems were 50% lower for women than for
men, and this was a statistically signiicant result. For
those aged between 23-27 years, the odds of consuming alcohol or having alcohol-related problems were
statistically signiicant and 30% higher than the odds for
those aged 16-19 years. The odds of consuming alcohol or having alcohol-related problems among students in the wealthiest socioeconomic quintile were 200% higher than among students in the poorest quintile (data not
shown in tables or igures).
Model OR (95%CI) p
Discrimination
Unadjusted analysis 0.9 (0.7-1.2) 0.420
Adjusted for sex 1.0 (0.8-1.3) 0.840
Adjusted for sex and socioeconomic status 1.0 (0.8-1.4) 0.666
Adjusted for sex, socioeconomic status and age 1.0 (0.8-1.4) 0.708
1 reason ≥ 2 reasons 1 reason ≥ 2 reasons
Reasons for being discriminated against
Unadjusted analysis 0.8 (0.5-1.2) 1.0 (0.8-1.2) 0.212 0.715
Adjusted for sex 0.8 (0.5-1.2) 1.0 (0.8-1.3) 0.296 0.725
Adjusted for sex and socioeconomic status 0.9 (0.5-1.5) 1.1 (0.9-1.4) 0.703 0.304
Adjusted for sex, socioeconomic status and age 0.9 (0.5-1.6) 1.1 (0.9-1.4) 0.730 0.338 Table 3 - Overall associations between discrimination, number of reasons for being discriminated against, and pattern of alcohol
consumption among undergraduate students of Universidade Federal de Santa Catarina (Florianópolis, southern Brazil, 2013)
95%CI = 95% conidence interval; OR = odds ratio.
First-year students (n = 450)
Last-year students (n = 242) Mid-course students (n = 331) Discrimination
Yes No
25.0
20.0
15.0
10.0
5.0
F
re
qu
e
n
cy
o
f
a
lcoh
ol
-r
e
la
te
d
pr
obl
e
m
s
(%
)
Figure 1 - Association between discrimination and alcohol-related problems, according to year of study in university (Florianópolis, southern Brazil, 2013). * In ordinal logistic regression model, discrimination and alcohol-related problems were associated with an odds ratio of 1.0 (p = 0.985) among first-year students, 0.8 (p = 0.564) among mid-course students and 1.9 (p = 0.037) among
note, the measure of effect of discrimination attributed to multiple reasons was somewhat higher than that of the dichotomous discrimination variable, which suggests that the combination of multiple types of discrimination may produce an even higher impact on health behaviors.
The inal semesters of study in university seem to
represent a greater burden of stress, pressures and demands related to the completion of an important stage of life, which culminates with the entry into the labor market. Discrimination, in conjunction with these stressful factors,27 may lead students to the adoption of
speciic coping strategies, such as alcohol consumption
and problem drinking. A previous study28 on health behaviors among university students at the beginning and end of their undergraduate courses showed that the consumption of alcohol, tobacco, marijuana and
inhalants increased signiicantly along their time in
university. Another investigation29 found widespread use of potentially abused medications among last-year Biology students. Hatzenbuehler et al.27 suggest that discrimination may be an important risk factor during university life. They found a positive and prospective association between discrimination and alcohol-related problems among undergraduate students in the United States; they also reported that this association was mediated by different coping strategies.
related problems. Figure 1 shows that among last-year students who reported discrimination, the frequency of alcohol-related problems was 13.3%, whereas only 9.0% of those that did not report discrimination had similar problems. Last-year students that reported discrimination had 1.9 times higher odds (95%CI 1.0-3.4) of having
alcohol-related problems than irst-year students that
were not discriminated against. Figure 2 shows that the frequency of alcohol-related problems among students that reported discrimination attributed to two or more reasons was 15.1%, which is higher than the 7.0-10.0% found among individuals in the comparison groups. Among students that reported discrimination attributed to two or more reasons, the odds of having alcohol-related problems were 2.3 higher (95%CI 1.3-4.3) than the odds found among their counterparts. Common mental disorders and age did not moderate the association between discrimination and patterns of alcohol consumption.
Discussion
This study found that time spent in university
works as an effect modiier of the association
between discrimination, number of reasons for being discriminated against and alcohol-related problems. Of
Figure 2 - Association between number of reasons for being discriminated against and alcohol-related problems, according to year of study in university (Florianópolis, southern Brazil, 2013). * In ordinal logistic regression model, number of reasons for being discriminated against and alcohol-related problems were associated with an odds ratio of 1.0 (p = 0.999) among first-year students, 0.7 (p = 0.296) among mid-course students and 2.3 (p = 0.010) among last-year students; reference category was
first-year students that did not report discrimination.
30.0
20.0
10.0
0.0
Not discriminated against 1 reason 2+ reasons
Number of reasons for being discriminated against
F
re
qu
e
n
cy
of
a
lcoh
ol
-r
e
la
te
d
pr
obl
e
m
s
(%
)
First-year students (n = 450)
et al.31 may also explain the lower rate of reported discrimination – younger individuals may not have
accumulated a signiicant amount of discriminatory
experiences over their lives, or may not be equally aware of this phenomenon. Because studies used different methods, the comparison of their results is
dificult. Studies that used lengthy instruments tend
to be more sensitive. Moreover, there is no standard recall period for discriminatory experiences across
studies in the ield. However, among socially and
historically stigmatized groups, such as women, poor individuals, and older respondents, discrimination frequencies were higher than those found for their
peers, which corroborates previous indings31,32 and
conirms instrument validity.
Alcohol consumption is estimated to be high among undergraduate students, as reported by a nationwide Brazilian survey, which found a prevalence of 86%.35 The frequency of alcohol consumption (77%) among UFSC students was similar to that found for students in Universidade Federal de Pelotas, where the frequency of alcohol consumption was 75% among students.36 Consistent with results of previous nationwide Brazilian35,37 and international surveys,38,39 the frequency of alcohol consumption was higher among men and individuals in the highest socioeconomic groups.29,36 In our study, the highest frequency of alcohol-related problems was found for students not admitted to university through quotas. However, alcohol consumption frequencies in different studies should be compared cautiously, because studies use different scales to measure alcohol consumption. Furthermore, the concepts adopted to refer to patterns of alcohol consumption among undergraduate students vary substantially.
One of the limitations of this study was that the time between exposure and outcome could not be
deined, given that the instrument assesses lifetime
discriminatory experiences, whereas the pattern of alcohol consumption was determined for the previous year. Additionally, the decision to analyze multiple types of discrimination simultaneously may have
resulted in a loss of speciicity, because each type
of discrimination has its own set of features and particular consequences. However, the starting point of this study was that all forms of discrimination are unjust and undesirable, have health-damaging effects and may accumulate and be experienced at the same time. Another limitation was that coping strategies were not assessed in the study. Finally, due to the complex nature of discrimination and its variation according to sociocultural contexts under investigation, discrimination experiences reported in this study cannot be generalized.
In our study, results of full sample analysis suggest that there are no associations between discrimination and patterns of alcohol consumption, which contradicts
previously published indings.7,9,10,14,15,18,27 However, it should be noted that only one of these studies focused on university students.27 In addition, these studies were carried out with convenience samples19 and used a number of different scales to assess discriminatory experiences and patterns of alcohol consumption. The perception, interpretation and reporting of discrimination is complex and varies according to the sociocultural context in which it occurs; furthermore, reporting of discriminatory experiences is strongly affected by psychological and demographic characteristics.30 The number of reasons for being discriminated against was not associated with patterns of alcohol consumption in the whole UFSC sample, but over half of the students reported more than one reason for being discriminated against. In our review of the literature, the only two studies that examined the association between multiple reasons for being discriminated against and adverse health conditions found positive results,8,21 which support the hypothesis that discriminatory experiences attributed to multiple reasons may have worse health effects.
The frequency of self-reported discrimination in this study (65.8%) was relatively higher than in three other Brazilian studies, which estimated a prevalence of 16.4% among adolescents,31 9% among a general adult population32 and 34.7% among public civil servants.33 The prevalence of self-reported discrimination was also higher than that found in studies that enrolled immigrants9 and Latinos34 in the United States; in both, the prevalence of discrimination was about 30.0%.
13. Gibbons FX, Gerrard M, Cleveland MJ, Wills TA, Brody G. Perceived discrimination and substance use in African American parents and their children: a panel study. J Pers Soc Psychol. 2004;86:517-29. 14. Chae DH, Takeuchi DT, Barbeau EM, Bennett GG, Lindsey JC,
Stoddard AM, et al. Alcohol disorders among Asian Americans: associations with unfair treatment, racial/ethnic discrimination, and ethnic identiication (the national Latino and Asian Americans study, 2002-2003). J Epidemiol Community Health. 2008;62:973-9. 15. Gibbons FX, Etcheverry PE, Stock ML, Gerrard M, Weng CY,
Kiviniemi M, et al. Exploring the link between racial discrimination and substance use: what mediates? What buffers? J Pers Soc Psychol. 2010;99:785-801.
16. Kulis S, Marsiglia FF, Nieri T. Perceived ethnic discrimination versus acculturation stress: inluences on substance use among Latino youth in the Southwest. J Health Soc Behav. 2009;50:443-59. 17. Stock ML, Gibbons FX, Walsh LA, Gerrard M. Racial identiication,
racial discrimination, and substance use vulnerability among African American young adults. Pers Soc Psychol Bull. 2011;37:1349-61. Epub 2011 May 31.
18. Whitbeck LB, Hoyt DR, McMorris BJ, Chen X, Stubben JD. Perceived discrimination and early substance abuse among American Indian children. J Health Soc Behav. 2001;42:405-24. 19. Goto JB, Couto PF, Bastos JL. [Systematic review of epidemiological
studies on interpersonal discrimination and mental health]. Cad Saude Publica. 2013;29:445-59.
20. Priest N, Paradies Y, Trenerry B, Truong M, Karlsen S, Kelly Y. A systematic review of studies examining the relationship between reported racism and health and wellbeing for children and young people. Soc Sci Med. 2013;95:115-27. Epub 2012 Dec 19. 21. Grollman EA. Multiple forms of perceived discrimination and
health among adolescents and young adults. J Health Soc Behav. 2012;53:199-214. Epub 2012 May 15.
22. Silva DA, Petroski EL. The simultaneous presence of health risk behaviors in freshman college students in Brazil. J Community Health. 2012;37:591-8.
23. Bastos JL, Faerstein E, Celeste RK, Barros AJ. Explicit discrimination and health: development and psychometric properties of an assessment instrument. Rev Saude Publica. 2012;46:269-78.
24. Babor T, Higgins-Biddle J, Saunders J, Monteiro M. The alcohol use disorders identiication test: guidelines for use in primary care. Geneve: WHO; 2001.
25. Barros AJ, Victora CG. [A nationwide wealth score based on the 2000 Brazilian demographic census]. Rev Saude Publica. 2005;39:523-9. Epub 2005 Aug 16.
26. Mari JJ, Williams P. A comparison of the validity of two psychiatric screening questionnaires (GHQ-12 and SRQ-20) in Brazil, using Relative Operating Characteristic (ROC) analysis. Psychol Med. 1985;15:651-9.
27. Hatzenbuehler ML, Corbin WR, Fromme K. Discrimination and alcohol-related problems among college students: a prospective examination of mediating effects. Drug Alcohol Depend. 2011;115:213-20. Epub 2010 Dec 9.
28. Franca Cd, Colares V. [Comparative study of health behavior among college students at the start and end of their courses]. Rev Saude Publica. 2008;42:420-7.
29. Silva LV, Malbergier A, Stempliuk Vde A, de Andrade AG. [Factors associated with drug and alcohol use among university students]. Rev Saude Publica. 2006;40:280-8.
30. Bastos JL, Faerstein E. Discriminação e saúde: perspectivas e métodos. Rio de Janeiro: Fiocruz; 2012.
31. Gonçalves H, Dumith SC, González DA, Menezes AM, Araujo CL, Hallal PC, et al. [Self-reported discrimination by adolescents in a Brazilian birth cohort: prevalence and associations]. Rev Panam Salud Publica. 2012;31:204-10.
32. Macinko J, Mullachery P, Proietti FA, Lima-Costa MF. Who experiences discrimination in Brazil? Evidence from a large metropolitan region. Int J Equity Health. 2012;11:80.
33. Celeste RK, Goncalves LG, Faerstein E, Bastos JL. The role of potential mediators in racial inequalities in tooth loss: the Pro-Saude study. Community Dent Oral Epidemiol. 2013;41:509-16. Epub 2013 May 6.
34. Perez DJ, Fortuna L, Alegria M. Prevalence and correlates of everyday discrimination among U.S. latinos. J Community Psychol. 2008;36:421-33.
35. Andrade AG, Duarte PCAV, Oliveira LG. I levantamento nacional sobre o uso de álcool, tabaco e outras drogas entre universitários das 27 capitais brasileiras. Brasília: Secretaria Nacional de Políticas sobre Drogas; 2010.
36. Ramis TR, Mielke GI, Habeyche EC, Oliz MM, Azevedo MR,
Conclusion
The high frequency of discrimination and alcohol consumption among the undergraduate students included in this study should be the subject of discussion by the academic community when planning strategies
to address these problems. This is the irst study to
investigate the association between discrimination and patterns of alcohol consumption in Brazil. Therefore, further studies should enroll different Brazilian
populations to conirm or refute its preliminary results.
The results found for last-year students suggest that
the inal period in university may pose serious threats
to health behaviors, particularly when compounded by discriminatory experiences. Further studies should also assess the role of other levels of the phenomenon, such as institutional and internalized discrimination, when addressing health outcomes and behaviors. Finally, the mechanisms by which discrimination affects alcohol
consumption should also be explored, because speciic
coping strategies27 or particular participant worldviews40 may be mediating/moderating factors.
References
1. Duckit J. Historical overview. In: Dovidio JF, Hewstone M, Glick P, Esses VM, editors. The Sage handbook of pejudice, sereotyping and dscrimination. London: Sage; 2010. p. 29-44.
2. Dovidio JF. Prejudice, stereotyping and discrimination: theoretical and empirical overview. In: Dovidio JF, Hewstone M, Glick P, Esses VM, editors. The Sage handbook of prejudice, stereotyping and discrimination. London: Sage; 2010. p. 3-28.
3. Martin JK, Tuch SA, Roman PM. Problem drinking patterns among African Americans: the impacts of reports of discrimination, perceptions of prejudice, and “risky” coping strategies. J Health Soc Behav. 2003;44:408-25.
4. Terrell F, Miller AR, Foster K, Watkins CE Jr. Racial discrimination-induced anger and alcohol use among black adolescents. Adolescence. 2006;41:485-92.
5. Williams DR, Mohammed SA. Discrimination and racial disparities in health: evidence and needed research. J Behav Med. 2009;32:20-47. Epub 2008 Nov 22.
6. Pascoe EA, Smart Richman L. Perceived discrimination and health: a meta-analytic review. Psychol Bull. 2009;135:531-54. 7. Okamoto J, Ritt-Olson A, Soto D, Baezconde-Garbanati L, Unger
JB. Perceived discrimination and substance use among Latino adolescents. Am J Health Behav. 2009;33:718-27.
8. Bastos JL, Barros AJ, Celeste RK, Paradies Y, Faerstein E. Age, class and race discrimination: their interactions and associations with mental health among Brazilian university students. Cad Saude Publica. 2014;30:175-86.
9. Tran AG, Lee RM, Burgess DJ. Perceived discrimination and substance use in Hispanic/Latino, African-born Black, and Southeast Asian immigrants. Cultur Divers Ethnic Minor Psychol. 2010;16:226-36.
10. Yoo HC, Gee GC, Lowthrop CK, Robertson J. Self-reported racial discrimination and substance use among Asian Americans in Arizona. J Immigr Minor Health. 2009;12:683-90.
11. Bennett GG, Wolin KY, Robinson EL, Fowler S, Edwards CL. Perceived racial/ethnic harassment and tobacco use among African American young adults. Am J Public Health. 2005;95:238-40. 12. Borrell LN, Diez Roux AV, Jacobs DR Jr, Shea S, Jackson
40. Townsend SS, Major B, Sawyer PJ, Mendes WB. Can the absence of prejudice be more threatening than its presence? It depends on one’s worldview. J Pers Soc Psychol. 2010;99:933-47. Hallal PC. [Smoking and alcohol consumption among university
students: prevalence and associated factors]. Rev Bras Epidemiol. 2012;15:376-85.
37. Pedrosa AA, Camacho LA, Passos SR, Oliveira Rde V. [Alcohol consumption by university students]. Cad Saude Publica. 2011;27:1611-21.
38. Kracmarova L, Klusonova H, Petrelli F, Grappasonni I. Tobacco, alcohol and illegal substances: experiences and attitudes among Italian university students. Rev Assoc Med Bras. 2011;57:523-8. 39. Miskulin M, Petrovic G, Miskulin I, Puntaric D, Milas J, Dahl D, et
al. Prevalence and risk factors of alcohol abuse among university students from eastern Croatia: questionnaire study. Coll Antropol. 2010;34:1315-22.
Correspondence: João Luiz Bastos
Departamento de Saúde Pública, Centro de Ciências da Saúde Universidade Federal de Santa Catarina
Campus Universitário João David Ferreira Lima, Trindade 88040-970 - Florianópolis, SC - Brazil