1Universidade Federal de Viçosa, Departamento de Nutrição e Saúde, Programa de Pós-Graduação em Ciência da Nutrição. Av.
PH Rolfs, s/n., 36570-000, Viçosa, MG, Brasil. Correspondência para/Correspondence to: PVM RIBEIRO. E-mail: <priscilavazdemelo@yahoo.com.br>.
2Universidade Federal de Viçosa, Departamento de Nutrição e Saúde, Programa de Extensão Pró-Celíacos. Viçosa, MG, Brasil.
Nutritional status variation and intestinal
and extra intestinal symptomatology in
patients with celiac disease and non-celiac
gluten sensitivity given specialized
dietary advice
Evolução do estado nutricional e sintomatologia
intestinal e extra intestinal em pacientes
com doença celíaca e sensibilidade ao
glúten não celíaca submetidos à
orientação dietética especializada
Priscila Vaz de Melo RIBEIRO1 Andreza de Paula SANTOS1 Cristiana Santos ANDREOLI1 Sônia Machado Rocha RIBEIRO1 Mônica de Paula JORGE1 Ana Vládia Bandeira MOREIRA2
A B S T R A C T
Objective
To investigate the nutritional status variation and symptomatology of patients with celiac disease and non-celiac gluten sensitivity after specialized dietary advice.
Methods
Metabolic Screening Questionnaire. The variables were assessed on two occasions (T1 – before dietary advice and T2 – after dietary advice) with an interval of three months between T1 and T2.
Results
The median age was 42 years. The prevalences of celiac disease and non-celiac gluten sensitivity were 66.2% and 33.8%, respectively. Normal weight prevailed at T1 (58.8%) and T2 (56.3%), but 30.0% of the patients at T1 and 34.9% of the patients at T2 had excess weight. The two conditions had similar symptomatology. The most frequent signs and symptoms on both occasions involved the gastrointestinal tract, followed by energy/ activity and emotions. All symptoms decreased significantly after the introduction of a proper diet.
Conclusion
The patients were normal weight on both study occasions (T1 and T2), and the symptoms improved after dietary advice. Thus, we reinforce the importance of proper dietary management in both clinical conditions to make dietary adjustments that improve these individuals’ symptomatology.
Keywords: Celiac disease. Diet. Food and nutrition education. Non-celiac gluten sensitivity. Signals and symptoms.
R E S U M O
Objetivo
Investigar a evolução do estado nutricional e a sintomatologia de pacientes com doença celíaca e sensibilidade ao glúten não celíaca após orientação dietética especializada.
Métodos
O estudo prospectivo foi realizado com 80 pacientes portadores da doença celíaca e de sensibilidade ao glúten não celíaca. A coleta das variáveis clínicas, metabólicas e nutricionais foi feita por análise dos prontuários, enquanto a sintomatologia foi investigada por meio de Questionário de Rastreamento Metabólico. As variáveis foram avaliadas em dois momentos (T1 – antes da orientação dietética e T2 – após orientação dietética), com intervalo de 3 meses entre T1 e T2.
Resultados
A mediana de idade foi de 42 anos. A prevalência de doença celíaca e de sensibilidade ao glúten não celíaca foi de 66,2% e 33,8%, respectivamente. A eutrofia prevaleceu como estado nutricional de T1 (58,8%) e T2 (56,3%), porém 30,0% dos pacientes em T1 e 34,9% em T2 apresentaram excesso de peso. A sintomatologia foi similar entre as duas enfermidades. Os sinais e sintomas mais frequentes nos dois tempos foram os do trato digestório, seguido pelos relacionados à energia/atividade e às emoções. Todos os sintomas diminuíram significativamente após a introdução da dieta.
Conclusão
Os pacientes apresentaram estado nutricional de eutrofia nos dois momentos avaliados (T1 e T2) e houve redução dos sintomas após as orientações nutricionais. Dessa forma, reitera-se a importância do manejo dietético adequado para ambas as enfermidades clínicas a fim de adequar a dieta que favoreça a melhora da sintomatologia apresentada por esses indivíduos.
Palavras-chave: Doença celíaca. Dieta. Educação alimentar e nutricional. Sensibilidade não celíaca ao glúten. Sinais e sintomas.
I N T R O D U C T I O N
Celiac disease is a chronic inflammatory intestinal disease characterized by permanent intolerance to gluten, the main protein fraction of wheat, rye, barley, and oats1. This condition is mediated by T lymphocytes in genetically
From the 1980s onward, celiac disease was no longer considered a rare disease, and today, it affects 0.5 to 1.0% of the global population, with important regional variations5. In Western countries celiac disease affects approximately 1.00% of the general population6. In Brazil official statistics on celiac disease epidemiology are unknown, but new studies show that celiac disease is found in 0.15 to 1.75% of the general population7. Additionally, first-degree relatives of celiacs share genetic and environmental risk factors for celiac disease and consequently, are 10 to 20 times more likely to develop the disease than the general population7.
Non-Celiac Gluten Sensitivity (NCGS) was originally described in the 1980s and has been ‘rediscovered’ recently. It is characterized by intestinal and extra-intestinal symptoms related to the intake of gluten-containing foods by individuals who do not have celiac disease or wheat allergy8. NCGS epidemiology is still unknown and far from being established especially because many patients currently self-diagnose and begin a gluten-free diet without medical and nutritional advice, and disease-specific biomarkers are not available8,9.
In Non-celiac gluten sensitivity adverse reactions to gluten are not followed by the emergence of autoantibodies and do not change the intestinal barrier. Immune system involvement is more limited, and this explains how this condition is not accompanied by autoimmune phenomena during reaction to gluten. NCGS symptoms may be similar to the gastrointestinal symptoms associated with celiac disease. Thus, a diagnosis of NCGS is usually done by exclusion9.
Celiac disease has three types of clinical manifestations: classical or typical, non-classical or atypical, and asymptomatic or silent. The first type, classical, is characterized by the presence of intense gastrointestinal symptoms, such as diarrhea, vomiting, and abdominal distention, among others. The second type, atypical, presents a set of extra-intestinal symptoms in which digestive symptoms are absent or, when present,
are secondary. The silent form has no clinical manifestations1,3.
Globally, both celiac disease and NCGS are considered public health problems because of the global distribution, prevalence, and probability of the development of severe complications10,11. Hence, along with the clinical manifestations, it is important to consider the patients’ nutritional status as the proportion of celiacs with excess weight at diagnosis is increasing. Currently, the greatest concern regards patients that gain weight on a gluten-free diet secondary to better nutrient absorption12. Excess weight is associated with the risk of developing comorbidities, such as metabolic syndrome, diabetes Mellitus type 2, cardiovascular diseases, and some forms of cancer12.
Treatment is exclusively dietary and requires a gluten-free diet for patients with celiac disease and a low gluten diet for patients with NCGS13. The diet should be monitored by a dietitian and other health professionals as monitoring improves adherence and aims to reduce the risk of long-term complications2.
It is essential to assess the consequences of the dietary treatment on the nutritional status of patients with celiac disease and NCGS to reduce the negative impact of excess weight12,14,15. Therefore, this study aimed to investigate the intestinal and extra-intestinal signs and symptoms of celiac disease; to distinguish celiac disease and NCGS symptoms; and to verify whether dietary advice affects nutritional profile and symptomatology. The results provide additional information on individuals with celiac disease and NCGS, contributing to a better understanding of the changes in the symptomatology of both clinical conditions in response to dietary treatment.
M E T H O D S
from Minas Gerais, Brazil from January 2013 to July 2014 created specifically for individuals with intestinal disorders.
The study was approved by the Human Research Ethics Committee of the
Universida-de FeUniversida-deral Universida-de Viçosa (under Protocol nº
30424514.3.0000.5153). All participants were informed about the study objectives and signed an Informed Consent Form which guaranteed the study’s compliance with the norms of Resolution 466 of the National Health Council. Moreover, all participants received dietary advice and were followed in the long term by outpatient appointments and social events (cooking workshops provided by the program) during adaptation to the new eating habits.
The sample consisted of 80 adults and older adults with celiac disease or NCGS. The participants were selected randomly, but to be included in the study, individuals had to have medical tests and/or referrals that confirmed celiac disease or NCGS diagnosis and had to have participated in the care program for patients with intestinal disorders for at least six months. Individuals aged less than 18 years and those without a diagnosis of celiac disease or NCGS were not included.
Procedures
Anthropometric (body weight, height, and percentage of body fat determined by bioelectrical impedance analysis), social, clinical, and Metabolic Screening Questionnaire data were collected from the patients’ medical records.
Body Mass Index (BMI) was calculated by dividing the weight by the square of the height (kg/m2). Adults’ BMI were categorized as recommended by the World Health Organization16 as follows: BMI<18.5kg/m2 as underweight; 18.5≤BMI≤24.9kg/m2 as normal weight; 25≤BMI≤29.9kg/m2 as overweight, and BMI≥30kg/m2 as obese. Older adults’ BMI were categorized as recommended by Lipschitz17 as
follows: BMI<22kg/m² as underweight; 22≤BMI≤27kg/m² as normal weight, and BMI>27kg/m² as overweight.
Individuals diagnosed with celiac disease received advice on a gluten-free diet, and those with NCGS received advice on a low-gluten diet13. In addition to the dietary plans, the participants received individual nutritional support. The Metabolic Screening Questionnaire identified the manifested signs and symptoms18. This instrument consists of 14 blocks on the body’s functional aspects and behavioral activities. The interviewee answered the questions presented in the form of an interview. The answers were scored 0 to 4 based on the level of symptom intensity, where 0 indicated the absence of symptoms; 1, occasional non-severe symptom; 2, occasional severe symptom; 3, frequent non-severe symptom; and 4, frequent severe symptom. The metabolic, clinical, and anthropometric variables were assessed on two occasions (T1 – before dietary advice and T2 – after dietary advice) during the individual appointments, with an interval of three months between T1 and T2.
The sample was characterized by distribution of frequencies and estimates of measures of central tendency and dispersion. The Kolmogorov-Smirnov test investigated whether the data had normal distribution, the Wilcoxon’s
t-test verified the difference between nutritional status and symptoms at T1 and T2, the Student’s
t-test compared the mean percentages of body fat at T1 and T2, and the Mann-Whitney U-test verified the difference between celiac disease and NCGS symptoms. The study used a significance level of α<5%. The data were processed and analyzed by the software Statistical Package for the Social Sciences (SPSS Inc., Chicago, Illinois, United States of America) version 20.0.
R E S U L T S
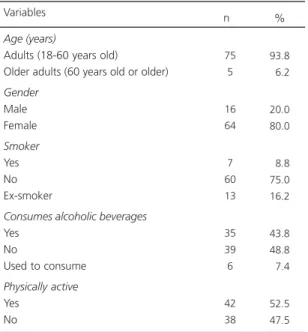
66.25% had celiac disease, and 33.75% had NCGS. The median age was 42 years, mean age, 41.24 years (Standard Deviation, SD=12.773), minimum age, 18 years, and maximum age, 65 years. Table 1 describes the patients’ social and health characteristics.
The most prevalent nutritional status at T1 and T2 was normal weight, but 30.0% of the
patients at T1 and 34.9% of the patients at T2 had excess weight (Figure 1). The BMI of patients with celiac disease or NCGS did not differ significantly between T1 and T2 according to the Wilcoxon’s t-test (Table 2). Likewise, the percentages of body fat determined by bioelectrical impedance analysis did not differ between T1 and T2 according to the Student’s
t-test (Table 2).
The means for the signs and symptoms presented by patients with the two conditions at T1 and T2 differed significantly for all organs, physical structures, and behavioral activities (Table 3). Table 1. Frequencies of the social and health characteristics of
patients with celiac disease and non-celiac gluten sensitivity. Viçosa (MG), Brazil, 2014.
Age (years)
Adults (18-60 years old)
Older adults (60 years old or older)
Gender Male Female Smoker Yes No Ex-smoker
Consumes alcoholic beverages
Yes No
Used to consume
Physically active Yes No 75 5 16 64 7 60 13 35 39 6 42 38 93.8 06.2 20.0 80.0 08.8 75.0 16.2 43.8 48.8 07.4 52.5 47.5
Variables n %
Figure 1. Nutritional status of patients at the first (T1) and last (T2) appointments according to body mass index. Vi-çosa (MG), Brazil, 2014.
Table 2. Anthropometric profile of patients with Celiac Disease (CD) and Non-Celiac Gluten Sensitivity (NCGS) at the first appointment (T1) and last appointment (T2). Viçosa (MG), Brazil, 2014.
Age (years) Weight (kg) T1 T2 BMI (kg/m²) T1 T2 %BF T1 T2
Note: *Wilcoxon’s t-test; βββββPaired Student’s t-test.; T1: First Appointment; T2: Last Appointment.
BMI: Body Mass Index; BF: Body Fat, M: Mean; SD: Standard Deviation. Variables 41.24 63.07 63.81 23.80 24.08 24.73 25.57 12.77 14.90 15.24 5.09 5.26 7.53 8.65 ± ± ± ± ± ± ± ± ± ± Total (n=80)
M ± SD
0.427*
0.451*
0.186βββββ
p 40.53 62.09 63.19 23.59 23.96 24.39 24.99 12.08 15.19 15.29 04.94 05.00 07.84 08.88 ± ± ± ± ± ± ± ± ± ± CD (n=53)
M ± SD
0.191*
0.214*
0.284βββββ
p 42.63 64.98 65.11 24.20 24.33 25.42 26.90 14.17 14.41 15.37 05.46 05.85 06.95 08.14 ± ± ± ± ± ± ± ± ± ± NCGS (n=27)
M ± SD
0.440*
0.530*
0.451βββββ
At T1, the most prevalent symptoms were intestinal (diarrhea, nausea, vomiting, constipation, distended/swollen abdomen, eructation, flatulence, heartburn, and stomach/intestinal cramping), followed by extra-intestinal symptoms related to energy/activity (fatigue, enervation, hyperactivity, and difficulty resting) and emotions
(mood changes, anxiety, fear, irritability, aggressiveness, and depression).
At T2, after the dietary intervention, the most prevalent symptoms again were intestinal, followed by emotions and mental activities (poor memory, confusion, poor concentration, poor motor coordination, learning difficulties, and
Table 4. Means of the signs and symptoms presented by patients with celiac disease and Non-Celiac Gluten Sensitivity (NCGS) at the first appointment (T1). Viçosa (MG), Brazil, 2014.
Head Eyes Ears Nose Mouth/throat Skin Gastrointestinal tract Joints/muscles Energy/activity Mind Emotions Heart Lungs Other
Variables Celiac disease
6.00 5.32 3.15 7.05 6.07 7.39 17.96 6.26 9.96 8.67 9.15 2.45 3.13 8.30 4.38 4.13 3.70 6.61 4.99 5.48 7.14 4.97 5.57 7.53 4.82 3.78 4.15 8.17 M SD ± ± ± ± ± ± ± ± ± ± ± ± ± ± ± NCGS 6.62 5.96 3.88 4.48 5.33 9.25 17.51 7.00 10.92 9.66 10.37 4.33 3.74 7.66 3.86 3.80 3.47 3.93 5.24 6.35 4.23 6.66 5.00 7.12 4.97 3.43 4.32 6.70 M SD ± ± ± ± ± ± ± ± ± ± ± ± ± ± ±
Note: *Statistically significant. Mann-Whitney U-test.
M: Mean; SD: Standard Deviation.
0.291* 0.429* 0.258* 0.189* 0.456* 0.230* 0.491* 0.967* 0.346* 0.441* 0.229* 0.007* 0.464* 0.838* p
Table 3. Means of the most prevalent signs and symptoms in patients with celiac disease and non-celiac gluten sensitivity before and after dietary advice. Viçosa (MG), Brazil, 2014.
Head Eyes Ears Nose Mouth/throat Skin Gastrointestinal tract Joints/muscles Energy/activity Mind Emotions Heart Lungs Other Variables T1 6.30 5.54 3.40 6.19 5.83 8.03 17.81 6.51 10.29 9.01 9.56 3.09 3.34 8.09 4.14 4.01 3.62 5.94 5.05 5.82 6.28 5.57 5.38 7.36 4.88 3.75 4.19 7.67 M SD ± ± ± ± ± ± ± ± ± ± ± ± ± ± ± T2 1.53 1.46 0.78 1.56 1.23 2.90 6.03 1.75 2.80 3.63 3.66 0.60 0.76 1.82 2.57 2.69 1.80 3.39 2.47 3.69 5.35 3.57 4.01 5.65 4.29 1.85 2.37 3.15 M SD ± ± ± ± ± ± ± ± ± ± ± ± ± ± ±
Note: *Statistically significant. Wilcoxon’s t-test.
T1: First Appointment; T2: Last Appointment; M: Mean; SD: Standard Deviation.
decision-making difficulties). However, all symptoms presented by patients with celiac disease and NCGS improved significantly after the introduction of gluten-free and low-gluten diets, respectively.
Comparison of the means of the signs and symptoms of patients with celiac disease and NCGS found no difference between the groups. The only variable that differed significantly regarded cardiac signs and symptoms (Table 4).
Comparison of the means of the variables of organs and physical structures (head, eyes, ears, skin, joints, heart, and lungs) and behavioral activities (energy, mental activities, emotions) showed that individuals with NCGS had higher means than celiacs, but the difference was not significant. On the other hand, the means of the other variables (nose, mouth, gastrointestinal tract, and others, such as genital itching or discharge, miscarriage, loss of appetite, and anemia) were higher in celiacs.
D I S C U S S I O N
The median age of the 80 adults and older adults who constituted the sample was 42 years, and 80% were women. Volta & De Giorgio9 corroborate the present findings; although NCGS occurs at any age, it seems to be more frequent in adults with a median age of 40 years (ranging from 17 to 63 years), and more prevalent in females than males9.
Other studies support the present study findings. Reilly & Green6 also affirmed that the highest prevalences of celiac disease have occurred in adult females, and that celiac disease has mostly been diagnosed in later life6.In addition Araújo19 and Polanco20 found that celiac disease is more common in women, and the latter reported that celiac disease affects women in a ratio of 2 to 119,20.
Most patients with celiac disease and NCGS had normal weight at T1 and T2.
Nevertheless, 30.0% of the patients at T1 and 34.9% of the patients at T2 had excess weight. These data are similar to those reported by Ukkola
et al.12, who found that 57.0% and 39.0% of
their 698 celiacs had normal weight and excess weight, respectively, at the beginning of their study. After being on a gluten-free diet for one year, 54.0% and 45.0% of the sample had normal weight and excess weight, respectively12.
Recent population-based studies have found an increasing mean BMI in Western countries, and today, about half the adult population is overweight or obese. This trend was similar to the trend observed in the present sample of patients with celiac disease and NCGS as 34.9% of the patients had excess weight in the last appointment12.
Araújo19 found that malnutrition and excess weight were the most common nutritional statuses in celiacs. Malnutrition stems from the difficulty of consuming food because of the problems and poor nutrient absorption caused by impaired intestinal mucosa permeability. On the other hand, excess weight stems from better nutrient absorption due to improvements in the absorptive structure of the intestinal membranes and symptoms, stimulating higher food intake. Moreover, foods for celiacs usually have higher lipid contents, increasing the weight of celiacs in treatment.
Individuals with celiac disease and NCGS complain that the availability of sensorially pleasant foods is small and that the products available in grocery stores are usually very expensive11,21. The lack of cooking skills and time to prepare gluten-free foods add to the difficulty of consuming unusual foods22.
An effective treatment for all clinical forms of celiac disease is essentially dietary, requiring the removal of gluten from the diet or its reduction in the case of NCGS13. Thus, it is important to reinforce the need of dietary monitoring by a dietitian19.
dietitians’ conduct, from assessment and control of nutritional status and during treatment, should aim to eliminate the signs and symptoms of patients with celiac disease and NCGS. Hence, to ensure proper nutritional status and good quality of life, said conduct should empower the patient to choose and prepare foods, to avoid cross-contamination during food preparation and distribution, and to be aware of metabolic conditions, such as impaired absorption.
The study results corroborate Casemiro22 as most of his patients were normal weight and a small percentage was underweight after the introduction of a gluten-free diet22. This finding may also stem from patient participation in the program developed for individuals with intestinal disorders. The program includes individual care and group advice during cooking workshops. In addition to receiving nutritional advice during treatment, the patients also receive recipes of healthy gluten-free preparations high in vitamins, minerals, and fibers. The patients are also invited to participate in social activities (cooking workshops), where they learn to make gluten-free preparations, interact with other patients, and share their anguishes, doubts, and achievements during treatment.
In the present study, 66.25% and 33.75% of the patients had celiac disease and NCGS, respectively, contrary to Volta & De Giorgio9, who believe that the presumed prevalence of NCGS is higher than that of celiac disease, even though NCGS epidemiology is far from being established. Nonetheless, one must consider the context of the study patients as they participate in a program designed for individuals with intestinal disorders.
The most evident symptoms in the Metabolic Screening Questionnaire were similar to those reported by Casemiro22 as both studies found a prevalence of high irritability, abdominal bloating, abdominal pain, flatulence, and joint pain.
Whitacker et al.23 investigated symptoms suggestive of celiac disease in diabetic children from Campinas (SP) and found that, of 195
children, 62 were asymptomatic, 91 had at least one gastrointestinal tract symptom, and 15 reported at least one unspecific symptom. In the present study, abdominal pain was the main complaint among classical symptoms, followed by abdominal distention, constipation, and epigastralgia. Frequent bouts of diarrhea, flatulence, and vomiting were also reported. In the same study, arthralgia was the most cited unspecific symptom, followed by fatigue23.
Ukkola et al.12 found the classical form of celiac disease in 70.0% of the patients, 9.0% presented extra-intestinal symptoms, and the remainder was asymptomatic12. Sdepanian et al.24 also found the classical form of celiac disease in 88.9% of the patients, and 11.1% had the classical form. Of the 32 patients with non-classical manifestations, three presented only one symptom, two were underweight, and one was anemic24.
The present study results differ from those reported by Reilly & Green6 and Ukkola et al.12, who found that the clinical picture of celiac disease has changed both in children and adults as diarrhea and malabsorption are increasingly uncommon (classical gastrointestinal symptoms). Currently, abdominal cramps and delayed growth are the main manifestations in children. The main manifestations in adults have been6 anemia, osteoporosis, dermatitis herpetiformis, chronic fatigue, and varied neurological manifestations (extra-intestinal symptoms)12.
Celiac disease is an autoimmune disease that may affect any organ and not only the gastrointestinal tract, as once believed. Its outbreak and first symptoms may appear at any age. Additionally, the range of possible symptoms varies considerably between individuals, and even in the same individual during different phases of the disease25.
gluten-free or low-gluten diet as nonadherence would lead to symptom recurrence and persistence of the histological and serological changes. This finding is corroborated by Pratesi & Gandolfi25, who found that many patients experienced an undefinable general malaise before diagnosis, which improved after adherence to a gluten-free diet25. Likewise, Czaja-Bulsa26 supports our data as they affirmed that a gluten-free diet leads to full symptom regression in patients with Non-celiac Gluten Sensitivity26.
According to Kotze27, adherence to a gluten-free diet makes symptoms, such as micro-and macronutrient malabsorption, diarrhea, micro-and edema, disappear, whetting the appetite and improving nutritional status in a few days or weeks. Still, total or partial recovery of the intestinal mucosa functionality and histology may take 6 to 19 months, or in some cases, 24 to 48 months22,27.
The means of celiac disease and NCGS symptoms did not differ significantly. In this sense, Sapone et al.28 affirmed that NCGS symptoms may resemble those of celiac disease, but NCGS has a higher prevalence of extra-intestinal symptoms, such as behavioral changes, bone or joint pain, cricks, weight loss, and chronic fatigue28.
Between 2004 and 2010, 5,896 patients were followed by the University of Maryland Center for Celiac Research28. The symptoms found in patients with NCGS include: abdominal pain (68%); eczema and/or itching (40%); headache (35%); brain fog (34%); fatigue (33%); diarrhea (33%); depression (22%); anemia (20%); numbness in the legs, arms, or fingers (20%); and joint pain (11%)28.
Individuals with NCGS do not tolerate gluten and may develop gastrointestinal symptoms similar to those of celiac disease, although the clinical picture usually is less severe. The present study and Sapone et al.29 found that the most reported symptoms by both groups involved the gastrointestinal tract, followed by symptomatology associated with energy/activity and emotions.
The typical NCGS presentation is a combination of systemic symptoms and manifestations, such as head ache, muscle pain, muscle contractions, arm numbness, chronic fatigue, brain fog, loss of body mass, and anemia, or they main include behavioral disorders, such as depression26.
The diagnosis of NCGS is established when gluten allergy and celiac disease (auto-immune) are discarded, that is, the condition is diagnosed by exclusion of other conditions28. NCGS condition has also been associated with unexplained psychiatric and neurological diseases, such as cerebellar ataxia, peripheral neuropathy, schizophrenia, or autism, as well as other autoimmune diseases (lupus, psoriasis, and fibromyalgia, among others). Since symptoms in these patients may improve with a gluten-free diet, this may suggest nutritional sensitivity to gluten30.
C O N C L U S I O N
Finally, celiac disease and NCGS cannot be distinguished clinically, since both conditions have similar symptoms. Therefore, given the aforementioned information, this study provided some pieces of evidence regarding changes in nutritional status, and in the intestinal and extra-intestinal symptomatology of patients with celiac disease and NCGS submitted to specialized dietary advice. However, this subject has been little explored, especially with regard to NCGS, and there is a long road ahead.
C O N T R I B U T O R S
R E F E R E N C E S
1. Baptista ML. Doença celíaca: uma visão contem-porânea. Pediatria. 2006 [acesso 2015 dez 2]; 28(4):262-71. Disponível em: http://bases. bireme.br/cgi-bin/wxislind.exe/iah/online/?Isis Script=iah/iah.xis&src=google&base=LILACS& lang=p&nextAction=lnk&exprSearch=450843& indexSearch=ID
2. Machado AS, Teixeira AV, Cardoso H, Cruz D, Paiva ME, Tavarela-Veloso F. Doença celíaca no adulto: a propósito de um caso clínico. J Port Gastrenterol. 2006 [acesso 2015 dez 18];13(3):139-43. Dispo-nível em: http://www.scielo.mec.pt/scielo.php? script=sci_arttext&pid=S0872-817820060003 00003&lng=pt
3. Brasil. Ministério da Saúde. Portaria nº 307, de 17 de setembro de 2009. Protocolo clínico e diretrizes terapêuticas da doença celíaca. Brasília: Ministério da Saúde; 2009.
4. Pelleboer RAA, Janssen RLH, Deckers-Kocken JM, Wouters E, Nissen AC, Bolz WEA, et al. Doença celíaca é super-representada em pacientes com constipação. J Pediatr. 2012;88(2):173-6. http://dx. doi.org/10.2223/JPED.2155
5. Fasano A, Berti I, Gerarduzzi T, Not T, Colleti RB, Drago S, et al. Prevalence of celiac disease in at-risk and notat-risk groups in the United States: A large multicenter study. Arch Intern Med. 2003; 163(3):286-92
6. Reilly NR, Green PH. Epidemiology and clinical presentations of celiac disease. Semin Immunopathol. 2012;34(4):473-8.
7. Castro-Antunes MM, Magalhães R, Nobre JMM, Duarte BP, Silva GAP. Doença celíaca em familiares de primeiro grau de portadores. J Pediatr. 2010;86(4):331-6. https://doi.org/10.1590/S0 021-75572010000400014
8. Catassi C, Bai JC, Bonaz B, Bouma G, Calabrò A, Carroccio A, et al. Non-Celiac Gluten Sensitivity: The new frontier of gluten related disorders. Nutrients. 2013;5(10):3839-53. https://doi.org/ 10.3390
9. Volta U, De Giorgio R. New understanding of gluten sensitivity. Nat Rev Gastroenterol Hepatol. 2012;9(5):295-9. https://doi.org/10.1038/nrgastro. 2012.15
10. Zandonadi RP. Psyllium como substituto de glúten [mestrado]. Brasília: Universidade de Brasília; 2006 [acesso 2015 dez 2]. Disponível em: http://www. revistanutrire.org.br/articles/view/id/4faa89be1ef 1faa012000000
11. Araújo HMC, Araújo WMC, Botelho RBA, Zandonadi RP. Doença celíaca, hábitos e práticas
alimentares e qualidade de vida. Rev Nutr. 2010;23(3):467-474. https://doi.org/10.1590/ S1415-52732010000300014
12. Ukkola A, Maki M, Kurppa K, Collin P, Huhtala H, Kekkonen L, et al. Changes in body mass index on a gluten-free diet in coeliac disease: A nationwide study. Eur J Intern Med. 2012;23(4):384-8. 13. BaiJC, Fried M, Corazza GR, Schuppan D, Farthing
M, Catassi C, et al. World Gastroenterology Organisation Global Guidelines on celiac disease. J Clin Gastroenterol. 2013;47(2):121-6.
14. Kabanni TA, Goldberg A, Kelly CP, Pallav K, Tariq S, Peer A, et al. Body mass index and the risk of obesity in coeliac disease treated with the gluten-free diet. Aliment Pharmacol Ther. 2012;35:723-9. 15. Tucker E, Rostamil K, Prabhakaran S, Dulaimi DA.
Patients with coeliac disease are increasingly overweight or obese on presentation. J Gastrointestin Liver Dis. 2012;21(1):11-5.
16. World Health Organization. Obesity: Preventing and managing the global epidemic. Geneva: WHO; 1997.
17. Lipschitz DA. Screening for nutritional status in the elderly. Primary Care. 1994;21(1):55-67.
18. Dixon NM. Common knowledge: How companies thrive by sharing what they knowledge. Boston: Harvard Business School Press; 2000.
19. Araújo HMC. Impacto da doença celíaca na saúde, nas práticas alimentares e na qualidade de vida de celíacos [mestrado]. Brasília: Universidade de Brasília; 2008 [acesso 2015 dez 2]. Disponível em: http://www.riosemgluten.com/Impacto_DC_ saude_UNB.pdf
20. Polanco I. Celiac disease. J Pediatr Gastr Nutr. 2008 [cited 2016 Jan 23];47(Suppl.1):3-6. Available from: https://pedclerk.bsd.uchicago.edu/sites/ pedclerk. uchicago.edu/files/uploads/Celiac_Disease.3.pdf 21. Rauen MS, Back JCV, Moreira EAM. Doença celíaca:
sua relação com a saúde bucal. Rev Nutr. 2005; 18(2):271-6. https://doi.org/10.1590/S14155273 2005000200011
22. Casemiro JM. Adesão à dieta sem glúten por pacientes celíacos em acompanhamento no hospital universitário de Brasília [mestrado]. Brasília: Universidade de Brasília; 2006 [acesso 2015 dez 2]. Disponível em: http://repositorio.unb.br/ bitstream/10482/7185/1/2007_JaciaraMachado Casemiro.pdf
24. Sdepanian VL, Morais MB, Fagundes-Neto U. Doen-ça celíaca: avaliação da obediência à dieta isenta de glúten e do conhecimento da doença pelos pacientes cadastrados na Associação dos Celíacos do Brasil (ACELBRA). Arq Gastroenterol. 2001;38(4):232-9. https://doi.org/10.1590/50004-28032001000400005
25. Pratesi R, Gandolfi L. Doença celíaca: a afecção com múltiplas faces. J Pediatr. 2005;81(5):357-8. https:// doi.org/10.1590/S0021-75572005000600002
26. Czaja-Bulsa G. Non coeliac gluten sensitivity e a new disease with gluten intolerance. Clin Nutr. 2015;34(2):189-94.
27. Kotze LMS. Celiac disease in Brazilian patients: Associations, complications and causes of death. Forty years of clinical experience. Arq Gastroenterol. 2009;46(4):261-9. https://doi.org/10.1590/S0004-2 8032009000400004
28. Sapone A, Bai JC, Ciacci C, Dolinsek J, Green PHR, Hadjivassiliou M, et al. Spectrum of gluten-related disorders: Consensus on new nomenclature and
classification. BMC Med. 2012 [cited 2015 Jun 25];10(13). Available from: http://www. biomedcentral.com/1741-7015/10/13
29. Sapone A, Lammers KM, Casolaro V, Cammarota M, Giuliano MT, Rosa M, et al. Divergence of gut permeability and mucosal immune gene expression in two glutenassociated conditions: Celiac disease and gluten sensitivity. BMC Med. 2011 [cited 2016 Jan 28];9(23). Available from: http://www. biomedcentral.com/1741-7015/9/23
30. Silva TSG. Prevalência de anormalidades relacionadas à tireóide em adultos com doença celíaca [mestrado]. Porto Alegre: Universidade Federal do Rio Grande do Sul; 2010 [acesso 2015 dez 2]. Disponível em: http://www.lume.ufrgs.br/ bitstream/handle/10183/27191/000762300. pdf?sequence=1