SUMMARY
Objective: he demonstration that cardiovascular mortality follows a circadian rhythm led us to verify whether patients dying at the intensive unit care (ICU) and at the non-intensive unit care (non-ICU) follow that rhythm. Methods: All hospital’s deaths occurring between January 1, 2006 and July 31, 2010 were analyzed. he cir-cadian pattern of the time of death was analyzed in twelve 2-hour intervals. he Chi-square test was used to compare proportions, and Student’s t test or ANOVA single factor to compare continuous variables. A p-value ≤ 0.05 was considered statistically signiicant. Results: During the study period 700 deaths occurred in the hospital, 211 (30.1%) at the ICU and 88 (12.6%) at the non-ICU. here were more deaths in the irst hours of the day, between 6 am and 12 am, at the non-ICU in comparison to the ICU (38% vs. 21%; p = 0.004). In the ICU, we observed that 21% of the deaths occurred between 6 am and 12 pm, 30% between 12 pm and 6 pm, 26% between 6 pm and 12 am and 24% between 12 am and 6 am (p = 0.13) , whereas, at the non-ICU, 38% of the deaths occurred between 6 am and 12 pm, 18% between 12 pm and 6 pm, 19% between 6 pm and 12 am and 25% between 12 am and 6 am (p = 0.005).
Conclusion: At the non-ICU, deaths occur more oten in the morning period and fol-low a circadian rhythm, which does not occur at the ICU.
Keywords: Hospital mortality; circadian rhythm; chronobiological disorders.
Study conducted at Núcleo Técnico de Qualidade Assistencial, Hospital Death Evaluation Committee of Hospital Pró-Cardíaco, Rio de Janeiro,
RJ, Brazil
Submitted on: 02/21/2011
Approved on: 07/11/2011
Correspondence to:
Antônio Sérgio Cordeiro da Rocha Rua General Polidoro, 192
2º andar Rio de Janeiro - RJ, Brazil CEP: 22280.000 [email protected]
Conlict of interest: None.
©2011 Elsevier Editora Ltda. All rights reserved.
Circadian rhythm of hospital deaths: comparison between intensive
care unit and non-intensive care unit
ANTÔNIO SÉRGIO CORDEIRODA ROCHA1, MÔNICA PERESDE ARAÚJO2, AUGUSTA CAMPOS3, RUBENS COSTA FILHO4, EVANDRO TINOCO MESQUITA5,
MARCUS VINICIUS SANTOS6
1PhD in Cardiology; Universidade de São Paulo (USP); Coordinator, Clinical Unit, Hospital Pró-Cardíaco, Rio de Janeiro, RJ, Brazil 2MSc in Cardiology, Universidade Federal Fluminense (UFF); Physician, Hospital Pró-Cardíaco, Rio de Janeiro, RJ, Brazil 3Board Certiied Cardiologist, Sociedade Brasileira de Cardiologia (SBC); Physician, Hospital Pró-Cardíaco, Rio de Janeiro, RJ, Brazil 4Coordinator, Intensive Care Unit, Hospital Pró-Cardíaco, Rio de Janeiro, RJ, Brazil
INTRODUCTION
Because of the Earth’s rotation, all living species on the planet’s surface are exposed to the standard of 24 hours of light and darkness. In response to this regular variation of the light/dark cycle, living beings have developed an endogenous circadian rhythm that repeats itself every 24 hours. With the knowledge obtained over time, we know that this rhythm is important in maintaining the life of living organisms in response to environmental changes. However, changes in human behavior over the centuries, promoted by the modernization of customs and habits, brought a threat of disruption to this rhythm1-5.
In fact, when observing that cardiovascular mortality follows a rhythm, which accompanies neuroendocrine and metabolic alterations, one understands the impor-tance of this biological process on human nature6,7. Within
this context, several authors have studied the diferences in outcomes of patients admitted during the day compared to those admitted during shits in intensive care units (ICU), but no studies have been dedicated to compare the time of occurrence of deaths in the ICU and the non-intensive care unit (non-ICU)8-12.
he objective of this study is to observe the diferences in time of deaths in an ICU compared with the non-ICU and whether there is a circadian pattern of these deaths occurring in these two hospital units.
METHODS
his is a retrospective case-series study, which included all deaths occurring in a private hospital, with open medical staf, between January 1, 2006 and July 31, 2010. Based on a protocol developed by the Committee for the Investiga-tion of Hospital Deaths, a database was created with the minimum necessary information to outline the clinical proile of patients who died, as well as the time of occur-rence of these deaths in the institution.
We collected the data on all deaths that occurred in the intensive care unit (ICU) and the non-intensive care unit (non-ICU). hus, this analysis excluded deaths that oc-curred in the coronary unit, post-operative adult and child units and the emergency department of the institution.
he following data were collected: demographic char-acteristics, diagnosis of underlying diseases, direct cause of death and time of occurrence of deaths.
We considered cardiovascular disease as the presence of any one of the following pathologies: coronary artery disease, cerebrovascular disease, peripheral vascular dis-ease or thoracic or abdominal aortic disdis-ease documented by clinical, laboratory or angiographic pictures compatible with the diagnosis. As infectious diseases, we considered the presence of clinical and laboratory pictures consistent with the presence of any infectious agent of any etiology and afecting any organ system. As cancer, we considered the presence of documented malignancy afecting any
organ or system. Neoplasias were considered as direct causes of deaths whenever there was cachexia or multiple organ metastases. As for pulmonary embolism (PE), an-giographic evidence of thrombus involving the pulmo-nary artery circulation was considered. As dementia, we considered the association of memory impairment and some type of cognitive impairment. As kidney failure, we considered the presence of serum creatinine > 2 mg/dL or need for dialysis. Acute myocardial infarction (AMI) was
considered when it met the ACC/ESC criteria13.
Cerebro-vascular accident (CVA) was considered in the presence of clinical evidence associated with imaging consistent with the diagnosis. We also evaluated the percentage of patients who were receiving comfort measures in the two units.
he circadian pattern of occurrence of deaths was obtained by dividing the 24 hours of the day in 2-hour periods.
he data are shown as absolute numbers or propor-tions. For comparison of continuous variables Student’s t
test or one-way analysis of variance (ANOVA) was used and the Chi-square test or Fisher’s exact test was used to compare categorical variables. he signiicance level was set at 5% and all calculations were two-tailed.
RESULTS
Between January 1, 2006 and July 31, 2010 there were 700 deaths in the entire institution, corresponding to a hospital mortality rate of 3.6%. Of the 700 deaths, 211 (30.1%) oc-curred in the ICU and 88 (12.6%) in non-ICU.
here was no diference in age between the patients who died in the ICU (80 ± 12 years) compared to non-ICU (78 ± 14 years) (p = 0.13), as there was no diference in the proportion of women between the ICU and non-ICU (44% vs. 49%, respectively, p = 0.56).
As a direct cause of death (Table 1) neoplasms were more prevalent in the non-ICU than in the ICU (45.5% vs. 7.0%, respectively, p = 0.0001), while sepsis was more prevalent in the ICU, although not statistically signiicant (65% vs. 23.7%, p = 0.07). All patients that died of
sep-Causes ICU
(n = 211)
Non-ICU
(n = 88) p
Sepsis (%) 64.9 23.1 0.0001 Neoplasias (%) 6.8 42.3 0.0001
CVA (%) 5.2 5.8 0.74
AMI (%) 2.8 0 0.61
PTE (%) 1.0 0 1.0
Others (%) 20.4 28.8 0.19
ICU, intensive care unit; non-ICU, non-intensive care unit; CVA, cerebrovascular accident; AMI, acute myocardial infarction; PTE, pulmonary thromboembolism.
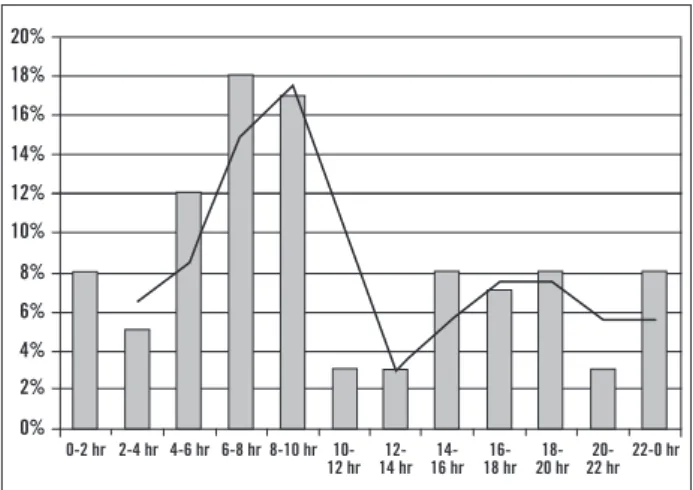
Figure 2 – Variation in time of the deaths throughout the 24 hours of the day, every two hours in the intensive care unit - ICU (p = 0.49).
Figure 1– Variation in time of the deaths throughout the 24 hours of the day, every two hours in the non-intensive care unit – non-ICU (p < 0.0001).
sis at the non-ICU were receiving comfort measures. he prevalence of AMI as the direct cause of death was similar between the ICU and the non-ICU (2.8% vs. 1%, p = 0.61); the same was observed regarding cerebrovascular accident (5.2% vs. 5.7%, p = 1.0) and thromboembolism (1.0% vs. 1.1%, p = 1.0).
As for the underlying disease (Table 2), cardiovascular diseases were more prevalent in patients who died in the ICU than in non-ICU (46.0% vs. 17.0%, p = 0.0001), while neoplasias were more prevalent in the non-ICU (65.9% vs. 17.0%, p = 0.0001).
Infectious disease as the underlying cause of death was more prevalent in the ICU than in the non-ICU (30.8% vs. 11.4%, p = 0.001). On the other hand, there was no signii-cant diference in the prevalence of dementia (2.4% and 4.5%, p = 0.45), kidney failure (10.4% vs. 4.5%, p = 0.11) and other diseases together (28% vs. 36.4%, p = 0.16) be-tween the ICU and non-ICU, respectively. More patients in the ICU had more than one underlying cause of death than those admitted at the non-ICU (62% vs. 44%, respec-tively, p = 0.02).
Of the patients who died at the non-ICU, 68 (77.3%) received comfort measures, compared with 30 (14.2%) at the ICU (p = 0.0001).
When comparing the time of occurrence of deaths in the ICU and the non-ICU, it was observed that signiicant-ly more deaths occurred in the earsigniicant-ly hours of the day, be-tween 6 am and 12 pm, in the irst compared to the second (38% vs. 21%, p = 0.004).
When analyzing the period of occurrence of deaths in the ICU, we observed that 21% of the deaths occurred be-tween 6 am and 12 pm, 30% bebe-tween 12 pm and 6 pm, 26% between 6 pm and 12 am and 24% between 12 am and 6 am (p = 0.13) , whereas, at the non-ICU, 38% of the deaths occurred between 6 am and 12 pm, 18% between 12 pm and 6 pm , 19% between 6 pm and 12 am and 25% between 12 am and 6 am (p = 0.005).
Analyzing the occurrence of deaths every two hours, it can be observed that in the non-ICU there is an increase in the number of deaths from 4 am, peaking at around 8 am
and with a small increase between 12 pm and 6 pm, i.e., those deaths follow a periodicity (Figure 1), whereas this pattern is not observed in the ICU (Figure 2).
DISCUSSION
Our study shows that, when analyzing the occurrence of deaths in relation to the circadian pattern, there was no time of day associated with increased mortality in the ICU, i.e., the circadian rhythm in this unit mortality was for some reason disrupted (Figure 2). Also, there was no diference in the occurrence of deaths between the routine hours (6 am to 6 pm) and the shits in the ICU (6 pm to 6 am), i.e., 51% versus 49% (p = 1.0). On the other hand, we observed a higher mortality rate in the non-ICU in the morning hours, when compared to other periods of the day, which conigures the maintenance of the circadian pattern of mortality in this unit (Figure 2). Considering
Underlying disease ICU
(n = 211)
Non-ICU
(n = 88) p
CVD (%) 46.0 15.4 0.0001
Neoplasias (%) 16.6 65.4 0.0001 Infectious D. (%) 30.8 11.5 0.004
Others (%) 28.0 40.4 0.09 > 1 underlying cause (%) 62 44 0.02
ICU, intensive care unit; non-ICU, non-intensive care unit; CVD, cardiovascular disease; Infectious D., infectious diseases.
Table 2 – Distribution of underlying diseases at the two treatment units
20%
18%
16%
14%
12%
10%
8%
6%
4%
2%
0%
0-2 hr 2-4 hr 4-6 hr 6-8 hr 8-10 hr 10- 22-0 hr
12 hr 12-14 hr
14-16 hr
16-18 hr
18-20 hr
20-22 hr
12.0%
10.0%
8.0%
6.0%
4.0%
2.0%
0.0%
0-2 hr 2-4 hr 4-6 hr 6-8 hr 8-10 hr 10- 22-0 hr
12 hr 12-14 hr
14-16 hr
16-18 hr
18-20 hr
these results, we speculate that patients admitted to the non-ICU preserve the circadian periodicity, regardless of the underlying disease that afects them.
In the ICU, on the other hand, the role of several fac-tors might change that frequency, either due to the con-inement, the uninterrupted use of light throughout the day, use of vasoactive drugs, sedation, intubation, etc. To the best of our knowledge, this observation of the circa-dian pattern maintenance in the deaths occurring in the non-ICU had not been previously published. However, it coincides with the description by other authors of the oc-currence of acute myocardial infarction and sudden death in the general population6,7.
Additionally, Meynaar et al.8, when analyzing the
inlu-ence of admission out of the routine schedule (shits) on mortality in the ICU showed that admission at these times was not associated with increased mortality. In our study, although we did not analyze the association of the time of admission with mortality, we observed that there was no diference in mortality between the four analyzed periods of the day in the ICU.
As expected, the number of deaths in the ICU was higher than in the non-ICU, which is consistent to what has been observed in other services14-16. Our study also
shows that 77.3% of patients who died at the non-ICU were receiving comfort measures compared to 14% in the ICU.
hese data are consistent with those reported in the literature15,17. Analyzing our data within the context of
terminal life, it is evident that neoplasias had a signiicant efect on the diference observed between the two units. Furthermore, all patients that died as a direct consequence of sepsis in the non-ICU were receiving comfort measures. It is important to report that the reason why the propor-tion of patients receiving comfort measures in the ICU was lower than that in the non-ICU, was that many of the deaths occurring in the ICU were due to multiple organ failure, therefore constituting an end-of-life process and the uselessness of maintaining therapeutic measures that would extend the vital status of patients.
Regarding sex, our study shows that there was preva-lence of males in both units, that is, 56% in the ICU and 51% in the non-ICU, although not statistically signiicant. hese data are diferent from those reported by Toscanini et al.18 in an analysis of deaths in various hospitals in Italy,
which showed a predominance of female deaths in those institution wards. Moritz et al.15, in a study conducted in
our country, observed the equivalence between the sexes in the deaths that occurred in a university hospital in the state of Santa Catarina, notwithstanding the predomi-nance of male deaths in the ICU of that institution.
An unusual aspect of the results of our study was the prevalence of more than one underlying disease and car-diovascular diseases in patients who died in the ICU, when compared with those who died at the non-ICU, especially
when there is no diference in age or sex between the pa-tients from the two analyzed units. Assuming that 77% of patients who died at the non-ICU were receiving comfort measures as a result of the terminal stages of their illnesses, we imply that the presence of more than one underlying disease in these patients was as prevalent as that in patients who died in the ICU.
his fact is even more relevant when one considers that cancer and cardiovascular diseases have common risk fac-tors, subjecting, at least theoretically, their carriers to the same possibilities of concomitant diseases19. Another
pos-sibility is the lack of information about concomitant dis-eases in the death certiicate iles that come from the non-ICU. According to Marins et al.20, in 52.8% of all deaths in
the city of Ribeirão Preto, there was no reference to sec-ondary diagnoses in the death investigations.
When analyzing the report by Toscanini et al.18
regard-ing deaths that occurred in the wards of several hospitals in Italy, we found that, similarly to our study, there was a prevalence of malignancy as the underlying disease in patients that died in those institutions.
LIMITATIONS
Our study has several limitations. As records were not ana-lyzed in their entirety, it is possible that other factors, which were not assessed, might have somehow modiied the results. Due to this limitation we were unable to assess the type of medication that patients were using in their respective units at the hour, on the days or in the weeks before the deaths. Additionally, we did not assess the im-pact of therapeutic measures used, especially in the ICU on the circadian variation of death occurrence. We empha-size that our analysis was restricted to deaths, and thus, the clinical proile does not accurately depict the patients admitted to the studied units.
CONCLUSION
At the non-ICU, deaths occur more oten in the morning period and follow a circadian rhythm, which does not oc-cur at the ICU.
REFERENCES
1. Panda S, Hogenesch JB, Kay SA. Circadian rhythms from lies to hu-man. Nature 2002;417:329-35.
2. Brandstätter R. Encoding time of day and time of year by the avian circadian system. J Neuroendocrinol 2003;15:398-404.
3. Markus RP, Afeche SC, Barbosa Jr EM, Lotufo CMC, Ferreira ZS, Cipola-Neto J. Glândula pineal e melatonina. In: Marques N, Men-na-Barreto L. Cronobiologia: princípios e aplicações. São Paulo: Edusp; 2003. pp.191-222.
4. Barreto L. O tempo na biologia. In: Marques N, Menna-Barreto L. Cronobiologia: princípios e aplicações. São Paulo: Edusp; 2003. pp.26-9.
5. Paranjpe DA, Sharma VK. Evolution of temporal order in living or-ganisms. JCircadian Rhythms 2005;3:7-19.
7. Cohen MC, Rohtla KM, Lavery CE, Muller JE, Mittleman MA. Me-ta-analysis of the morning excess of acute myocardial infarction and sudden cardiac death. Am J Cardiol1997;79:1512-6.
8. Meynaar IA, Spoel JI, Rommes JH, Spreuwel-Verheijen M, Bosman-RJ, Spronk PE. Of hour admission to an intensivist-led ICU is not associated with increased mortality. Critical Care 2009;13:1-7. 9. Arabi Y, Alshimemeri A, Taher S. Weekend and weeknight
ad-missions have the same outcome of weekday adad-missions to an in-tensive care unit with onsite intensivist coverage. Crit Care Med 2006;34:605-11.
10. Barnett MJ, Kaboli PJ, Sirio CA, Rosenthal GE. Day of the week of intensive care admission and patient outcomes: a multisite regional evaluation. Med Care2002;40:530-9.
11. Laupland KB, Shahpori R, Kirkpatrick AW, Stelfox HT. Hospital mortality among adults admitted to and discharged from intensive care on weekends and evenings. J Crit Care 2008;23:317-24. 12. Luyt CE, Combes A, Aegerter P, Guidet B, Trouillet JL, Gibert C et
al. Mortality among patients admitted to intensive care units dur-ing weekday day shits compared with “of ” hours. Crit Care Med 2007;35:3-11.
13. Antman E, Bassand JP, Klein W, Ohman M, Sendon JLL, Rydén L et al. Myocardial infarction redeined-a consensus document of he JointEuropean Society of Cardiology/American College of Cardi-ology committee for the redeinition of myocardial infarction: he Joint European Society of Cardiology/ American College of Cardiol-ogy Committee. J Am Coll Cardiol 2000;36:959-69.
14. Travassos C, Noronha JC, Martins M. Mortalidade hospitalar como indicador de qualidade. Ciênc Saúde Coletiva 1999;4:367-81. 15. Moritz RD, Beduschi G, Machado FO. Avaliação dos óbitos
ocor-ridos no Hospital Universitário da Universidade Federal de Santa Catarina (HU/UFSC). Rev Assoc Med Bras 2008; 54:390-5. 16. Ferrand E, Jabre P, Genod CV, Aubry R, Badet M, Badia P et al.
For the French Mort-a-l’Hôpital Group. Circumstances of Death in Hospitalized Patients and Nurses’ Perceptions. French Multicenter Mort-a-l’Hôpital Survey. Arch Intern Med 2008;168:867-75. 17. Goodlin SJ, Winzelberg GS, Teno JM, Whedon M, Lynn J. Death in
the hospital. Arch Intern Med 1998;158:1570-2.
18. Toscani F, Di Giulio P, Brunelli C, Miccinesi G, Laquintana D. How people die in hospital general wards: a descriptive study. J Pain Symptom Manage 2005; 30:33-40.
19. 2008-2013 - Action Plan for the Global Strategy for the Prevention and Control of Noncommunicable Diseases. [cited 2011 Feb 14]. Available from: http://www.who.int/cancer/prevention/en/. 20. Martins M, Blais R, Leite IC. Mortalidade hospitalar e tempo de