Photosynthesis in Leaves
Quang Tri Ho1, Pieter Verboven1, Xinyou Yin2, Paul C. Struik2, Bart M. Nicolaı¨1*
1Flanders Center of Postharvest Technology/BIOSYST-MeBioS, Katholieke Universiteit Leuven, Leuven, Belgium,2Centre for Crop Systems Analysis, Wageningen
University, Wageningen, The Netherlands
Abstract
Transport of CO2 in leaves was investigated by combining a 2-D, microscale CO2transport model with photosynthesis
kinetics in wheat (Triticum aestivumL.) leaves. The biophysical microscale model for gas exchange featured an accurate geometric representation of the actual 2-D leaf tissue microstructure and accounted for diffusive mass exchange of CO2.The
resulting gas transport equations were coupled to the biochemical Farquhar-von Caemmerer-Berry model for photosynthesis. The combined model was evaluated using gas exchange and chlorophyll fluorescence measurements on wheat leaves. In general a good agreement between model predictions and measurements was obtained, but a discrepancy was observed for the mesophyll conductance at high CO2levels and low irradiance levels. This may indicate that some
physiological processes related to photosynthesis are not incorporated in the model. The model provided detailed insight into the mechanisms of gas exchange and the effects of changes in ambient CO2concentration or photon flux density on
stomatal and mesophyll conductance. It represents an important step forward to study CO2 diffusion coupled to
photosynthesis at the leaf tissue level, taking into account the leaf’s actual microstructure.
Citation:Ho QT, Verboven P, Yin X, Struik PC, Nicolaı¨ BM (2012) A Microscale Model for Combined CO2Diffusion and Photosynthesis in Leaves. PLoS ONE 7(11): e48376. doi:10.1371/journal.pone.0048376
Editor:William Bauerle, Colorado State University, United States of America
ReceivedApril 6, 2012;AcceptedSeptember 24, 2012;PublishedNovember 7, 2012
Copyright:ß2012 Ho et al. This is an open-access article distributed under the terms of the Creative Commons Attribution License, which permits unrestricted use, distribution, and reproduction in any medium, provided the original author and source are credited.
Funding:The authors wish to thank the Research Council of the K.U. Leuven (OT 08/023), the Research Fund Flanders (project G.0603.08), and the Institute for the Promotion of Innovation by Science and Technology in Flanders (project IWT-050633) for financial support. Wageningen based authors have contributed to this work within the programme BioSolar Cells. Quang Tri Ho is a postdoctoral fellow of the Research Fund Flanders (FWO Vlaanderen). The funders had no role in study design, data collection and analysis, decision to publish, or preparation of the manuscript.
Competing Interests:Wageningen based authors have contributed to this work within the programme BioSolar Cells. Quang Tri Ho is a postdoctoral fellow of the Research Fund Flanders (FWO Vlaanderen). This does not alter the authors’ adherence to all the PLOS ONE policies on sharing data and materials.
* E-mail: [email protected]
Introduction
Photosynthesis is amongst the most important metabolic processes in plants. During photosynthesis, CO2 diffuses from the atmosphere into the leaf and finally to the site of carboxylation in the chloroplast stroma [1]. There is increasing evidence that diffusive resistances in the leaf are a limiting factor for photosynthesis [2,3].
Fick’s first law of diffusion has been used to describe the net CO2flux from the external environment through the intercellular space towards the cells [4,5]. It postulates that gas moves from places of high concentration to places of low concentration with a rate proportional to the gradient in concentration. The stomatal conductance (gs) determines the gas exchange from the
phyllo-sphere into the intercellular air space. The stomatal conductance for CO2has been estimated based on the water vapour release from the leaf given the fact that water and CO2 share the same gaseous diffusion pathway [6,7]. The mesophyll conductance (gm)
is defined as the conductance for the transfer of CO2 from the intercellular air space (Ci) to the site of carboxylation in the mesophyll cells (Cc). Both gs and gm are apparent parameters
rather than physical constants as they implicitly incorporate microstructural and biochemical features of the tissue, cells and organelles that are involved in the gas transport mechanism.
Several methods have been developed to estimategm. The most
common method is to use a combination of gas exchange and
chlorophyll fluorescence measurements [8,9,10,11,12]. It has been shown that gm is sufficiently small to significantly decrease Cc, relative to Ci, thereby limiting photosynthesis
[1,10,13,14,15,16,17]. Many physiological and leaf microstructur-al features have been found to correlate with gm, including
photosynthetic potential [13,17,18], stomatal conductance [13], and mesophyll surface area exposed to intercellular air spaces [18]. Tholen and Zhu [3] showed that the resistances of the cell wall and chloroplast envelope were the most important cellular limitations to photosynthesis. Further, in early reports (e.g., [13])
gmwas considered constant for a given leaf at a given temperature.
Recent evidence, however, suggests thatgmis variable [19], and a
response of gm to CO2 and irradiance has indeed been found, resembling the response ofgsto CO2and irradiance [1,17]. The kinetics of change of gm in response to CO2 have been demonstrated by observing the rate of change ofgm for different
Correlations ofgmwith leaf microstructural properties have not
always been clear [2]. One reason is probably that mostly single structural properties were considered in these studies described by simple parameters, such as leaf porosity or leaf mass per area. However, leaf microstructure is a complex assembly of cells of varying sizes and with tortuous connections, interlaced with distorted intercellular spaces that will affect the actual diffusion pathway in the leaf. Insight in the relation between these microstructural features and photosynthesis requires a detailed model that incorporates the microstructural geometry of the leaf. Microscale exchange of CO2in leaves has been investigated using theoretical models [23,24]. In these studies, tissue models were constructed by means of basic geometrical elements such as spheres and cylinders. However, these models were relatively crude compared to the actual irregular microstructure of the tissue. Also, they did not take into account the exchange barriers of biological membranes which recently were shown to be important [25]. Tholen and Zhu [3] very recently developed a 3-D model for gas transport in a single generic C3 mesophyll cell. The model incorporated reaction diffusion equations for CO2 and HCO
{
3 and included all cellular microstructural features of the CO2 transport pathway and associated reactions. However, being a model for CO2transport within a single cell, it does not consider potential resistances within the intercellular space and, more importantly, any additional resistances due to cells being attached to each other and possibly reducing the exchange surface for CO2 considerably.
Recently, a mathematical microscale gas exchange model was developed to describe gas movements in fruit tissue through the intercellular space and cells by the authors [26,27]. The gas exchange model was based on the actual microscale geometry of the fruit tissue and accounted for both gas diffusion as well as respiration kinetics. The model was used to evaluate the effect of ambient conditions, fruit size and maturity on the intracellular O2 and CO2concentrations in fruit in relation to the occurrence of anaerobis viain silicoanalysis [27,28]. In principle this model could also be used to describe microscale gas exchange in leaf tissue if the rate equations for leaf photosynthesis would be incorporated. The latter have been constructed by Farquhar, von Caemmerer and Berry [29] – the so-called FvCB model – which has been widely used for describing C3photosynthesis. This biochemical model has also been coupled to a simple (lumped) CO2 exchange model [30,31,32,33]. Yin et al. [17] have recently shown how to use combined measurements of gas exchange and chlorophyll fluorescence to estimate parameters of the FvCB model.
The objectives of this article were (i) to develop a microscale model for CO2exchange through the leaf by coupling a detailed biophysical model of gas diffusion that incorporates the actual microstructure of the leaf to the biochemical FvCB model of photosynthesis; (ii) to validate the model with independent data, (iii) to quantify the importance of the different pathways of gas exchange; and (iv) to analyze the response of gm and gs to
environmental factors such as CO2 and irradiance. Wheat (Triticum aestivumL.) leaf was chosen as a model system.
Results
Microscopic gas concentration distribution
Mesophyll tissue contains a loose arrangement of cells in a large intercellular space. However, cells inevitably touch each other, thereby reducing the gas exchange surface area and introducing an additional, local resistance to CO2 transport. This would translate into local CO2concentration gradients. We decided to carry out some simulations to test this hypothesis with a microscale
model that combines a diffusion model for CO2andHCO-3with the FvCB model for CO2 fixation in the chloroplasts and incorporates the actual 2-D leaf tissue microstructure.
The CO2distribution computed by the microscale model for the wheat leaf corresponding to ambient conditions of 350mmol
-mol21
CO2, 21% O2, 1000mmol m2 2
s21
Iincand 25uC is shown
in Figure 1. The meaning and units of all symbols are given in Table 1. As expected, the CO2 concentration in the pores is considerably higher than inside the mesophyll cells. However, the concentration in the intercellular space is definitely not uniform, probably due to the relatively compact mesophyll tissue micro-structure of wheat leaves compared to that of other species. Further, relatively large CO2gradients can be observed within cell clusters. For this particular mesophyll tissue, the resistance to CO2 transport is clearly not negligible.
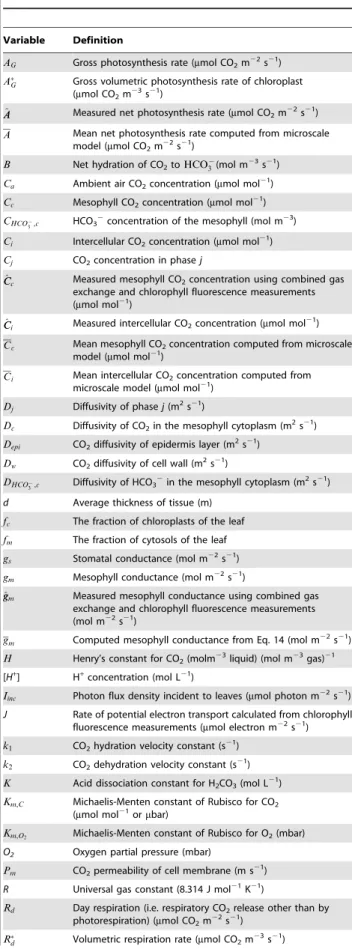
A detailed analysis of the calculated resistances of the different compartments of the leaf tissue is shown in Table 2. The resistance of the chloroplast envelope contributed up to 11.43% of the total resistance. This suggests that the chloroplast envelope effectively contributes significantly to the resistance to CO2transport in the mesophyll cells, confirming the simulation results of Tholen and Zhu [3] for single mesophyll cells. Microscale simulations with a lumped intracellular compartment (without distinguishing the individual chloroplasts or other organelles) have been additionally carried out (Text S1, Figure S1). These results showed that there was a good similarity in total gas flux between the lumped model and the one with the chloroplasts taken into account the resistance of the chloroplast envelope; the latter, however, predicted agmthat
was 12.7% higher than that obtained with the lumped intracellular model. Apparently, the reduced resistance to CO2transport due to the position of the chloroplasts near the plasma membrane outweighs the increased resistance due to the double membrane of the chloroplasts compared to the lumped model. The modelled distribution ofVc,maxalong the depth of a typical leaf is shown in
Figure 2. There is a decreasing trend at the abaxial side of the leaf. Also, there is a dip where there is a vascular bundle.
Photosynthesis in response to CO2concentration and
model validation
In a next step, we investigated whether the microscale model was able to predict the measured response of leaf photosynthesis to the ambient CO2 concentration in photorespiration conditions. The following convention for symbols is used further: macroscopic variables which were estimated from gas exchange and chlorophyll fluorescence experiments are denoted by a ‘‘’ symbol. Volume
averaged variables calculated from the microscale model are overlined (see more details in Materials and Method section).
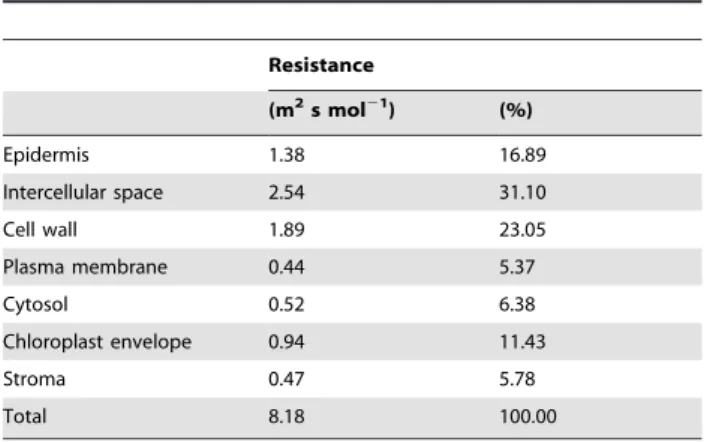
Plots of the measured and simulated net photosynthesis rate at
Civalues from 50 to 1500mmol mol21at 1000mmol m22s21Iinc
and 21% O2are shown in Figure 3. A good agreement was found between measured and simulated data.AA^rapidly increased at low
b Ci
Ci concentrations but saturated at high CO2 concentrations (Figures 3A&3B). The relationship betweenCC^candCcis shown in
Figures 3C&3D. They are approximately equal at low CO2 concentrations (,500mmol mol21), but at high CO2 concentra-tionsCC^clevels off. In Figures 3E & 3F,gmis plotted as a function
ofCi. Excluding the low-CO2region where any assessment ofgmis
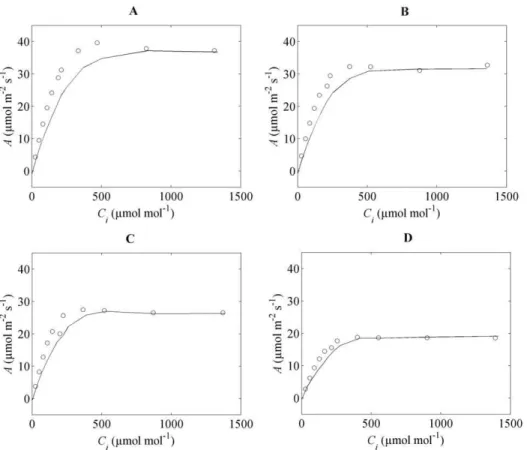
We then validated the microscale model using data obtained at 2% O2. The computed CO2 assimilation rate was slightly underestimated compared to the measurements (Figure 4), espe-cially for the condition of high and low N supply at flowering stage (Figures 4A&4B).
Photosynthesis in response to irradiance
Yin et al. [17] found thatgmandgsincrease with increasingIinc.
We wanted to evaluate whether the microscale model indeed predicts such behaviour. Microscale gas exchange simulations were carried out for different values ofIinc increasing from 0 to
2000mmol m22 s21
(350mmol mol21C
aand 21% O2). If using a constantDepi= 1.6761027
m2s21
(Table 3), the CO2 concentra-tion in the intercellular space was overestimated by the model for the conditions of low light intensity (results not shown). AsDepiwas
considered in the microscale model as a lumped parameter that included the gas diffusion through the stomata, its value was expected to vary with irradiance. The high N data at flowering stage were used for fitting gs to^ggs and to determine Depi. The
effects of light onDepi andgsare shown in Figure 5. The results
confirm thatDepiandgsincrease withIinc, due to the opening of
the stomata by light [34].
TheCCcvalues were larger than the measured ones at lowIinc
while at high values of Iinc both Ci and Cc in the model and
measurement levelled off (Figures 6A&6B).Aas a function ofIinc
agreed well with the measured values at low Iinc but was
underestimated at high Iinc (Figures 6C&6D). While gg^m seemed
to be very sensitive at lowIinc,ggmwas not (Figures 6E&6F). Similar
results were found for validation on wheat leaf at 2 weeks after flowering (Figure S3). Overestimations ofCCiandCCccompared to
the measurements were found. Note that the^ggsobtained for two
weeks after flowering was lower than the^ggsat the flowering stage,
while the values ofDepi at differentIinc applied in the simulation
resulted ingssimilar to^ggsfor the high N leaves at flowering stage.
Microstructure effect on mesophyll conductance The anatomy of the leaf may have an effect on microscale gas exchange and result in variation in mesophyll conductance. In order to test this hypothesis, the mesophyll conductance was computed for four different micro-structures of a wheat leaf based on light microscopic images at 15, 30, 60 and 90 mm above the leaf base taken from the literature [35]. Simulations were carried out at different values of Ca from 50 to 1500mmol -mol21,Iinc= 1000mmol m22s21 in photorespiration conditions (21% O2). In Figure 7 the computed values ofggmfor four different
microscale geometries are shown as a function of Ci. The ggm
values varied for the different microstructures, validating our hypothesis. A decreasing trend ofggmwith increasingCiwas found
consistently, irrespective of leaf microstructures. This is a simulation result that follows from the model and it is difficult to trace this to a particular submodel.
Discussion
CO2transport model
Fick’s diffusion equation is applicable to transport of a chemical species such as CO2in a continuum material such as water. It can be related to Brownian motion according to the Einstein– Smoluchowski equation that has its foundations in statistical mechanics. Several authors have used the diffusion equation to describe CO2uptake by leaves [36]. Such models were solved with geometrical simplifications such as a 1D model of CO2drawdown in the leaf [37], a restricted and simplified zone analysis of diffusion from a small sub-stomatal cavity into a hemispherical
Figure 1. Computed CO2distribution in wheat leaf.The ambient conditions were 350mmol mol21CO2, 21% O2,Iinc= 1000mmol m22s21and Tleaf= 25uC. Concentrations are expressed inmmol m23.
region surrounding it [38], and CO2 diffusion through a single stoma and the surrounding mesophyll using an axial symmetry model [23]. Aalto and Juurola [24] constructed a 3-D model for CO2 gas exchange through the leaf with basic geometrical elements such as spheres and cylinders representing mesophyll cells. While in their model the cells were separated by air gaps, in reality cells touch each other and this contact may reduce both the surface available for CO2exchange and the diffusion among the cells as we have clearly shown. The most realistic photosynthesis model to date was recently described by Tholen and Zhu [3]. Their model, while addressing 3-D CO2 transport in a single mesophyll cell and incorporating subcellular features such as chloroplasts and mitochondria, does not account for any resistances due to the leaf microstructure and in particular the mesophyll.
In our model we incorporated for the first time the actual microstructure as observed from microscopy images in the CO2 transport model. We considered six materials (epidermis, cell wall, cytoplasm, chloroplast, vacuole and air) and we assumed that these materials were proper continuum materials so that we could assume Fickean diffusion of CO2within each of them. Membranes were modelled as resistances. In contrast to the model of Aalto and Juurola [24], our model does account for the effect of mesophyll cells touching each other and thereby reducing the exchange surface between mesophyll and intercellular space. Further, our simulations show that wheat leaves with different microstructure have widely differentgmvalues (Figure 7), indicating a clear effect
of microstructure on gas transport (also see next section). This implies that our model is in principle not restricted to leaf types in which air space resistance is negligible as in the model of Tholen and Zhu [3].
Table 1.List of model variables, their symbols and
definitions.
Variable Definition
AG Gross photosynthesis rate (mmol CO2m22s21)
A
G Gross volumetric photosynthesis rate of chloroplast
(mmol CO2m23s21)
^
A
A Measured net photosynthesis rate (mmol CO2m22s21)
A Mean net photosynthesis rate computed from microscale
model (mmol CO2m22s21)
B Net hydration of CO2toHCO{3(mol m23s21)
Ca Ambient air CO2concentration (mmol mol21)
Cc Mesophyll CO2concentration (mmol mol21
)
CHCO{
3,c HCO3
2concentration of the mesophyll (mol m23)
Ci Intercellular CO2concentration (mmol mol21)
Cj CO2concentration in phasej
^
C
Cc Measured mesophyll CO2concentration using combined gas
exchange and chlorophyll fluorescence measurements
(mmol mol21)
^
C
Ci Measured intercellular CO2concentration (mmol mol21)
Cc Mean mesophyll CO2concentration computed from microscale
model (mmol mol21)
Ci Mean intercellular CO2concentration computed from
microscale model (mmol mol21)
Dj Diffusivity of phasej(m2s21)
Dc Diffusivity of CO2in the mesophyll cytoplasm (m2s21)
Depi CO2diffusivity of epidermis layer (m2s21)
Dw CO2diffusivity of cell wall (m2s21)
DHCO{
3,c Diffusivity of HCO3
2in the mesophyll cytoplasm (m2s21)
d Average thickness of tissue (m)
fc The fraction of chloroplasts of the leaf
fm The fraction of cytosols of the leaf
gs Stomatal conductance (mol m22s21)
gm Mesophyll conductance (mol m22s21)
^
g
gm Measured mesophyll conductance using combined gas
exchange and chlorophyll fluorescence measurements
(mol m22s21)
gm Computed mesophyll conductance from Eq. 14 (mol m22s21)
H Henry’s constant for CO2(molm23liquid) (mol m23gas)21
[H+] H+concentration (mol L21)
Iinc Photon flux density incident to leaves (mmol photon m22s21)
J Rate of potential electron transport calculated from chlorophyll
fluorescence measurements (mmol electron m22s21)
k1 CO2hydration velocity constant (s21)
k2 CO2dehydration velocity constant (s21)
K Acid dissociation constant for H2CO3(mol L21)
Km,C Michaelis-Menten constant of Rubisco for CO2
(mmol mol21ormbar)
Km,O2 Michaelis-Menten constant of Rubisco for O2(mbar)
O2 Oxygen partial pressure (mbar)
Pm CO2permeability of cell membrane (m s21)
R Universal gas constant (8.314 J mol21K21)
Rd Day respiration (i.e. respiratory CO2release other than by
photorespiration) (mmol CO2m22s21)
R
d Volumetric respiration rate (mmol CO2m23s21)
Table 1.Cont.
Variable Definition
s Slope factor for converting chlorophyll fluorescence-based PSII
electron efficiency intoJ(2)
Sc=o Relative CO2/O2specificity factor for Rubisco (mbarmbar21)
Tleaf Temperature of the leaf (K)
Tp Rate of triose phosphate export from the chloroplast
(mmol m22s21)
t Time (s)
Vm Total mesophyll cells volume (m3)
Vc,max Maximum rate of Rubisco activity-limited carboxylation
(mmol m22s21)
Vc,max(y) The relative photosynthetic capacity at a depthyinside the leaf
wc Rate of Rubisco activity-limited carboxylation (mmol m22s21)
wj Rate of electron transport-limited carboxylation (mmol m22s21)
wp Rate of TPU-limited carboxylation (mmol m22s21)
w(y) The width of the leaf at the depthy(m)
y The depth of the leaf from adaxial surface (m)
w CO2flux through the membrane (mmol m22s21)
C* Cc-based CO2compensation point in the absence ofRd
(mmol mol21ormbar)
The unitmmol mol21for CO
2concentration (often used in the FvCB model) was
converted tommol m23for use in the gas diffusion model by multiplying with a
factorP(R:T){1for CO
2concentration in the gas phase andP:H(R:T){1for
CO2concentration of the mesophyll, respectively.P(Pa) is the total pressure of
the ambient air,R(J mol21K21) is the universal gas constant and
T(K) is the
temperature.
We carried out a simulation in which we replaced air by helox in the model, corresponding to an increase of the diffusivity of CO2in the gas phase by 2.33 compared to that of the original model. At ambient conditions of 350mmol mol21CO2, 21% O2, Iinc= 1000mmol m22s21and 25uC,Awas 6.8% higher than in
the case of the air. This corresponds to the results of Parkhurst and Mott [38] who experimentally found thatAwas up to 7% higher in the amphistomatous leaves compared to air and up to 27% higher for the hypostomatous ones. While we did not do any measurements with helox, this result provides additional evidence that our model predicts realistic results. Additionally, it indicates that the intercellular space affects CO2 transport and thus photosynthesis. Note that a lumped model, in contrast, cannot explain the effect of helox on photosynthesis
The effect of nitrogen treatment on the photosynthetic parameters of wheat leaves at different development stages was investigated by Yin et al. [17]. A relatively small effect of nitrogen treatment could be observed in the flowering stage; two weeks after flowering the effect was somewhat larger (Figures 3, 6; Figure S2
and S3). The effect of development stage was, however, considerable (Figures 3, 6; Figure S2 and S3). The more significant difference in the later stage was probably due to the greater difference in the content of leaf nitrogen as large amount of leaf nitrogen was translocated into grains during grain filling.
We calibrated and validated the model at one temperature (25uC), as data were available for this temperature only [17]. However, temperature is known to have a large effect on photosynthesis [39,40,41,42]. The temperature dependence of physical constants such as the solubility and diffusivity of CO2and
HCO{
3 is known [44]. Also, mathematical expressions have been developed to describe the temperature dependence of the parameters of the FvCB model for different species [39,40,41], but not for wheat. In fact, the values of the activation energy of
Vc,max and Jmax used by De Pury and Farquhar [43] and
Archontoulis et al. [43] for wheat were actually obtained by Badger and Collatz [44] from experiments withAtriplex glabriuscular
leaf and by Farquhar et al. [29]. Preliminary simulations with temperature dependent Vc,max and Jmax values taken from these
references showed that the net photosynthesis of wheat leaves is highly dependent on temperature (Figure S4). Additional exper-iments are required to determine the temperature dependence of the parameters of the photosynthesis kinetics of wheat.
In our model it is assumed that CO2transport in the cell occurs mainly in the form of CO2and HCO32depending on the local pH. The dissociation of HCO32 to H+ and CO2
{
3 is not significant at pH values below 8. There is both theoretical and experimental evidence for significant carbonic anhydrase (CA) dependent facilitation of CO2transport in C3plants [20,22,45]. CA isozymes may be active in different cellular components [22,46] and may affect CO2transport. In fact, Tholen and Zhu [3] calculated that removing all CA from the stroma would reduce
gm by 44%. As little information is available about the rate
constants of the hydration and dehydration of CO2by CA, or its activity in the different organelles of the cell, we decided at this stage to not include CA activity in the microscale model until more information would become available; incorporation in the model would be straightforward and desirable, though.
The value ofPmwas taken from Evans et al. [20] and Tholen
and Zhu [3], who used the results of Gutknecht et al. [47] from experiments with equimolar mixtures of egg lecithin and cholesterol. The chemical composition of such a bilayer is, however, likely to be different from that of the cellular membranes of wheat leaf. The permeability of both the plasma and chloroplast membrane has also been shown to depend on the amount of embedded aquaporins (cooporins) [25]. In fact, Evans et al. [20] found values forPmranging from 1026to 1.661022m s21in the
literature. When we used the value reported by Uehlein et al. [25] (Pm= 0.861026m s21) we obtained a value of gm that was
considerably smaller than the measured one. More research on cell membrane permeability of plants and wheat in particular is thus required.
The microscale model described here does not consider the light profile inside the leaf yet. Coupling a full light penetration model to this model may be very helpful to estimate the distribution of quanta that are absorbed by the mesophyll cells within the leaf for photosynthesis. Future research thus should also address models for light propagation in leaf tissue.
Effect of leaf microstructure on CO2diffusion
During photosynthesis, CO2 moves from the atmosphere surrounding the leaf to the sub-stomatal internal cavities through stomata, and from there to the site of carboxylation inside the mesophyll cells. The simulation results indicated that gas exchange
Figure 2. Distribution of the relative photosynthetic capacity along the depth of the wheat leaf computed from the modelled microscale geometry.
doi:10.1371/journal.pone.0048376.g002
Table 2.Resistance analysis of different compartments of the
wheat leaf described in the model, for the CO2diffusion from
ambient air to chloroplast stroma.
Resistance
(m2s mol21
) (%)
Epidermis 1.38 16.89
Intercellular space 2.54 31.10
Cell wall 1.89 23.05
Plasma membrane 0.44 5.37
Cytosol 0.52 6.38
Chloroplast envelope 0.94 11.43
Stroma 0.47 5.78
Total 8.18 100.00
The resistances were calculated by dividing the average concentration difference across compartments by the average flux expressed per unit of exposed leaf surface.
through the microstructure is very heterogeneous. Large gradients and low CO2 concentrations were mainly found inside the mesophyll cells and cell clusters due to photosynthesis and limited diffusion of CO2in the mesophyll cells. The CO2concentration at the carboxylation site in the chloroplast stroma,Cc, in C3plants is lower than Ci [3,11,48,49]. The diffusion barriers such as the
water-filled pores of the cell wall, plasma membrane, cytosol, the envelope and stroma are responsible for the resistance of CO2 along the pathway from intercellular space to stroma [20]. Several authors (Evans and von Caemmerer [11], Evans et al. [14], Evans et al. [20], Terashima et al. [49]) reported that chloroplasts adhere exclusively to the plasmamembrane of mesophyll cells and, therefore, path length of CO2 transport over the cytoplasm is reduced. Tholen et al. [21] indicated the possibility of chloroplast movement that may have significant consequences for the diffusion of CO2 through the mesophyll. Simulations with a microscale model with chloroplasts lumped over the mesophyll cells showed that the predicted value ofgmwas lower than when
they incorporated chloroplasts near to the cell wall. This indicates that the position of the chloroplasts next to the plasma membrane does indeed reduce the resistance for CO2transport.
The distribution of Vc,max depends on the distribution of
chlorophyll through the leaf and the presence of the vascular
region. InEucalyptus paucifloraleaves, the photosynthesis capacity has been shown to be low in the vascular bundle region [50]. Evans and Vogelmann [51] showed that with increasing depth the photosynthetic capacity first increased followed by a strong decrease which finally levelled off in spinach leaves. This was not implemented in our model as there was no data available for wheat.
Early literature has assumed that simple diffusion through cellular membranes [52] and/or leaf structural features [14,53,54] are responsible for most of the variation ingm. Flexas et al. [2]
supposed thatgm can be correlated to some leaf microstructural
features. Our simulation results provided even more direct evidence of gas concentration gradients in relation to the microstructure topology of leaves and the effect of variation of the leaf microstructure ongm: depending on the value ofCCi, the
value of ggm that was computed for different microstructure
topologies was 30% different from the mean value (Figure 7). Biological variation thus considerably affects the mesophyll conductance. This may depend on the species, though: the microstructure of wheat leaf mesophyll is relatively tight compared to that of other species. Future photosynthesis models should thus not simply ignore the tissue microstructure.
Figure 3. Simulations and measurements at different conditions ofCi at 21% O2,Iinc= 1000mmol m22s21and 256C at flowering
stage.Figures (A) and (B) showAas function ofCifor the flag leaves at high and low N supply, respectively. The symbols represent measurements
(AA^versusCCbii) while the lines indicate model predictions (AversusCi). Figures (C) and (D) depictCC^cversusCcfor high and low N supply flag leaves,
respectively. The diagonal lines indicate perfect correspondence. Figures (E) and (F) showgmas function ofCifor high and low N supply flag leaves,
respectively. The solid (—) line representsgmversusCi. The symbols (o) represent the measured data (gg^mversusCCbii). Data are from Yin et al.[17].
The epidermis was implemented as a homogeneous layer without explicitly modelling the stomata, resulting in a high value ofDepi. The positive dependence ofDepi onIinc (Fig. 6) is most
probably due to the aperture of the stomata in response to the light. The cell walls were modelled as channels connecting the larger pores in the tissue, thereby creating a void network structure that facilitates gas exchange resulting in a high diffusivity of cell wall (Dw). When the cell wall structure was assumed to be
saturated with liquid in the 2D model, the net CO2assimilation flux decreased drastically compared to the measurement and resulted in a significant underestimation of mesophyll CO2 concentration. Evans et al. [20] showed that CO2 diffusivity of the cell wall (1.761029
m22 s21
) was much smaller than the value obtained here (see Table 3). Asin vivothe cell walls are expected to be fully hydrated, this may indicate that the interconnectivity of the microstructure is considerably larger than expected from the 2-D microscale geometry. Consequently, Dw is in our model an
apparent parameter that accounts for both CO2diffusion in the cell wall but also for the connectivity of the intercellular space in 3-D. Lateral gas diffusion within the intercellular air space has been studied by Pieruschka et al. [55] and Morison et al. [56]. Morison et al. [57] indicated that the supply of CO2from nearby stomata usually dominates assimilation, but that lateral supply over small distances can be important if stomata are blocked, particularly when the assimilation rate is low. The discrete positions of stomata may thus have an influence on the diffusion gradients in the leaf. As the 2-D model described here cannot fully capture gas transport through and from discrete stomata, a 3-D microscale gas transport simulation in a real leaf geometry is required to
Figure 4. CO2response of net CO2assimilation rates of the flag leaves under the conditions of 2% O2.(A) and (B) correspond to flag leaves at high N and low N supply at flowering while (C) and (D)correspond to flag leaves at high N and low N supply at two weeks after flowering. The symbols represent the measured values of versusCCbii[17]; the solid (—) represent the computedAversusCi.
doi:10.1371/journal.pone.0048376.g004
Table 3.Physical parameters of the microscale gas exchange
model.
Model parameters Symbol Values
Diffusivity
- Pore DCO2,g 1.6061025m2s21at 20uC(a)
- Cytosol and stroma DCO2,l 1.6761029m2s21at 20uC(a)
- Cell wall Dw 3.43761027m2s21
- Epidermis Depi 1.67261027m2s21
DHCO{
3,c 1.17610
29m2s21(b)
Cell wall thickness Lw 0.5mm
Membrane permeability Pm 3.561023m s21(c)
Henry’s constant H 0.83 (mol m23
liquid)
(mol m23gas)21at 25
uC(a)
CO2reaction rate constants k1 0.039 s21(d)
k2 23 s21(d)
K 2.561024mol L21(d)
(a)Lide [43],
(b)Geers and Gros [76],
(c)Gutknecht et al. [47],
(d) Jolly [77].
understand lateral gas diffusion in the leaves. A 3-D network structure with strong connectivity has indeed been observed in several plant tissues such as fruits [58,59,60]. The 3-D micro-structure of stomatal aperture and the corresponding microscale gas exchange through the stomata have recently been investigated using a diffusional resistance model [61]. Indeed, the 2-D gas exchange model described here is an important step toward a realistic full 3-D gas exchange model based on 3-D microstructure of leaf tissue which has not been achieved so far. The extension of our model to a 3-D model requires the geometrical model to be changed from 2-D to 3-D which is not trivial and requires advanced 3-D visualisation techniques such as synchrotron X-ray micro computed tomography [60]. The model equations, howev-er, do not need to be changed.
It is important to note that our microstructural model (and a possible 3-D extension) complements rather than replaces the lumped approach for photosynthesis modelling that has been used by many authors [1,5,10,11,12]. A lumped model, even when it fits GE/CF measurements very well, does not improve our understanding on the role of mesophyll porosity, cell size, presence of vascular bundle or any other microstructural features on photosynthesis. Our 2-D model (and a future 3-D even more) does provide such information.
Effect of CO2and irradiance on mesophyll conductance
We confronted our model extensively with measured gas exchange and chlorophyll fluorescence data and obtained in general a good agreement between simulated and measured values. However, the model failed to predict the decrease of^ggmat
high CO2values that was seen in the measurements and that is a topic of current debate [1,17].
One explanation for this mismatch could be the uncertainty on the estimation of ^ggm based on combined gas exchange and
chlorophyll fluorescence measurements, and the estimation of Harley et al. [10], Yin and Struik [12]. The latter authors found that the estimated mesophyll conductance becomes increasingly sensitive to variations of the measurements as the value of gm
increases, and can be affected by both statistical artifacts in curve fitting and biological uncertainties in thylakoid stoichiometry [12]. In addition, Evans [62] and Terashima et al. [63] indicated that electron transport rates calculated from chlorophyll fluorescence
may have potential errors, which the calibration procedure based on Equation (12) may not account for sufficiently. This would also explain the mismatch between CC^c and Cc as observed in
Figures 3C and 3D. However, the large discrepancy between^ggm
andgmappears already at intermediate levels ofCi, and is thus not
well explained by these considerations. Another, more plausible, explanation may be that there are effects that have not been incorporated in our model. For example, Tholen and Zhu [3] used a gas transport model for single mesophyll cells to show that increasing the permeability of the chloroplast membrane for
HCO{
3 would indeed explain decrease of^ggm as a function ofCi.
Also, transport through the chloroplast membrane may be regulated by CA: CO2 diffuses more easily through membranes than HCO32, so any regulatory mechanism that would affect the expression of CA and thus the equilibrium between CO2 and HCO32in different cellular compartments would also affect their transport through the relevant membranes. Finally, cooporins have been shown to be present in chloroplast membranes and may significantly affect membrane permeability [25]. These mecha-nisms may also explain the discrepancy betweenggmand^ggmat low Iinc.
Materials and Methods
Model assumptions
The following assumptions were made:
Model dimension. Gas transport is essentially 3-D. We have
shown previously [60,64] that in dense tissue such as in the cortex of fruit, pores that appear unconnected in 2-D may in fact be connected when visualised using 3-D techniques such as X-ray microfocus computed tomography (mCT). The reason that we have implemented a 2-D here instead of a 3-D model is the fact that mCT – the only feasible technique for 3-D visualisation of plant tissue at this resolution – provides insufficient contrast to discriminate organelles in a cell, and, for example, locate the position of the chloroplasts to include them in the geometrical model. Moreover, the best resolution that currently can be obtained withmCT (about 500 nm) is not enough to visualise the cell wall with sufficient contrast to allow segmentation of individual cells. This is a prerequisite for the method we used to artificially position the chloroplast layer inside the cell close to the
Figure 5. Epidermal diffusion and CO2stomatal conductance as function ofIinc.(A) Fitted epidermal diffusion (Depi) as function ofIinc. (B)
Measured CO2stomatal conductance (gs) as a function ofIinc. The symbols (o) and (6) represent high and low N supply flag leaves at flowering stage,
plasmalemma (see further). As mesophyll is much less dense we expect that the difference between 2-D and 3-D is not as large as in fruit cortex tissue, but this remains to be investigated in future research.
Intercellular space. In contrast to the model of Tholen and
Zhu [3], our model explicitly incorporated the actual microstruc-ture of the mesophyll tissue, including the intercellular space and cells touching each other. This allows investigating any resistances these features may cause in addition to those investigated by the latter authors.
Cell organelles. Chloroplasts and mitochondria were
mod-elled as different homogeneous layers in the cell rather than as individual organelles. This considerably reduced the complexity of the model and the required mesh density. This assumption was supported by the model of Tholen and Zhu [3] that displayed almost one dimensional gas exchange in a single isolated mesophyll cell one. It was further assumed that a mesophyll cell contained a single, large vacuole.
Stomata. In a 2-D model the real stomata distribution cannot
be implemented without considerably overestimating the overall stomatal gas exchange of the leaf; only a true 3-D model would allow incorporating the stomata as such. We therefore modelled the epidermis layer as a continuum material with an effective diffusivity Depi. This lumped parameter implicitly incorporates
stomatal gas exchange in such a way that the overall conductance of the epidermis in the model would be equal to the measured one.
Localisation of photosynthesis. We assumed that there was
no photosynthesis in the epidermis and vascular bundle. Respi-ration was assumed to take place in the epidermis, the cytoplasm of mesophyll cells and phloem; xylem cells were assumed not to respire. Xylem was identified as large cells in the vascular bundle facing the adaxial epidermis.
Spatial dependence of photosynthesis rate. Several
au-thors have found a spatial dependence of the photosynthesis rate [51,65,66]. The rate of photosynthesis across a leaf is determined by the light absorption profile and the profile of the photosynthetic capacity. With increasing depth the photosynthetic capacity first increases followed by a strong decrease and finally levels off. Although we realise that this would affect the modelling results, we did not find sufficient quantitative data on the spatial dependence of the photosynthesis rate in wheat.
Light transport. As light penetrates the leaf it is absorbed by
the photosynthetic pigments and scattered at air-water interfaces. Palisade cells facilitate the penetration of collimated light into the inner parts of the leaf, whereas the spongy mesophyll scatters the light thus increasing the probability of the light being absorbed. Because of the difficulty of modelling of this process (for example by means of Monte Carlo methods) we have assumed here that the photon flux density is uniform in the leaf.
Figure 6. Model predictions (lines) versus measurements (symbols) of photosynthesis variables for 350mmol mol21CO2, 21% O2,
Iincfrom 0 to 2000mmol m22s21and 256C at flowering stage.Left figures represent fitting results using data from high N supply flag leaves; right figures were simulations for low N supply flag leaves. Figure (A) and (B) showCiandCcas a function ofIinc; solid lines (—) and dashed lines (- -)
representCi andCc, symbols (6) and (o) representCCbiiandCCccc, respectively. Figure (C) and (D):Aas function ofIinc. Figure (E) and (F): mesophyll
conductancegm(—) or^ggm(o) as function ofIinc. Data from Yin et al. [17].
Model of photosynthesis kinetics
The FvCB model was used in this article to describe the gross CO2fixation rateAGin the chloroplasts of C3plants [16,29,67,68]. Briefly,
AG~ 1{C=Cc
minwc,wj,wp ð1Þ
with wc the Rubisco-limited carboxylation rate, wj the RuBP-regeneration or electron transport limited rate, andwpthe triose phosphate utilization (TPU) limited rate. They were calculated from
wc~
Cc:Vc,max CczKm,C(1zO2=Km,O2)
ð2Þ
wj~ Cc:J 4Ccz8C
ð3Þ
wp~ 3Tp
1{C=Cc
ð4Þ
withCcandO2the CO2and O2concentration in the chloroplast, respectively;Jthe rate of electron transport;Tpthe rate of triose
phosphate export from the chloroplast; and C~0:5O2=Sc=o [17]. Km,C, Km,O2 and Vc,max are constants. The meaning and
units of all symbols are given in Table 1. The net photosynthesis rate A was defined as A = AG-Rd, with Rd the respiratory CO2 release other than by photorespiration.
Microscale gas exchange model
The exchange of CO2in the tissue was described by means of a reaction diffusion equation:
LC
Lt ~+:D+C{A
GzRdzB ð5Þ
LCHCO{
3
Lt ~+
:D HCO{
3+CHCO
{
3 {B ð6Þ
withCand CHCO{
3 the local CO2and HCO
-3concentration;D andDHCO{
3 the corresponding local diffusivity coefficients; andt time. The volumetric photosynthesis rateA
G was assumed to be
equal to zero everywhere except in the chloroplasts.AG and Rd
were calculated fromAGandRdusing
AG~AG=ðd:fcÞ ð7Þ
Rd~Rd=ðd:fmÞ ð8Þ
withd(184mm) the average thickness of the leaf, andfc(0.104) and
fm (0.169) the fraction of chloroplasts and cytosol in a 2-D cross
section of the leaf, respectively.Brepresents the net hydration rate of CO2to HCO32:
B~k2
H
½ z
CHCO{
3,c
K {k1Cc ð9Þ
The CO2flux wthrough the membranes of the cell, chloroplast and vacuole membranes was described by a flux boundary condition:
w~{PmDC ð10Þ
withPmthe membrane permeability that is equal to the reciprocal
of resistance. It was assumed that the local CO2concentration in the gas and liquid phase was always in equilibrium and described by Henry’s law.
Geometrical model
The 2-D geometry of wheat leaf was constructed from light microscopic images of wheat leaf available from the literature [35], as the experimental dataset of Yin et al. [17] did not contain microscopic images. As the leaf cross section consists of several similar parallel vein segments, only one segment was modelled and impermeable boundary conditions were applied at the left and right hand side of the geometrical model. The images were digitized in the Matlab programming environment version 7.0 (The Mathworks, Natick, MA) by in-house developed software (Figure 8). The cells were represented by polygons. The bottom and top cell layers constituted the epidermis. The thickness of plant cell walls generally lies in the range of 0.1 to 0.3mm, but can
exceed 1mm [69,70]. As it was not possible to determine the cell
wall thickness accurately from the light microscopic images, we constructed the cell wall by shrinking the original polygon representing a cell by 0.5mm normal to every edge; the volume between the original and shrunk polygon was defined as the cell wall. Since the model was solved using the finite element method, reducing the cell wall thickness would decrease the mesh size in the
Figure 7. Model predictions ofggmas a function ofCiin high N supply flag leaves at flowering stage using four different microstructure topologies of wheat leaves.The simulations were done for different external CO2concentrations from 50 to 1500mmol -mol21, I
inc= 1000mmol m22s21in photorespiration conditions (21%
O2). Different symbols correspond to different microstructure topolo-gies.
cell wall material and, hence, increase the required computational resources and time. This would not affect the model predictions appreciably as the cell wall thickness is interchangeable withDw: if
we would have implemented a smaller cell wall thickness the parameter estimation procedure would have resulted in a larger value ofDw, but the simulation results would be virtually identical.
Chloroplasts appear as flat discs usually 2 to 10mm in diameter
and 1mm thick. A mesophyll cell can contain 10 to 100
chloroplasts [71]. James et al. [72] found that the volume fraction of chloroplasts in the mesophyll cells was about 24%. For simplicity, chloroplasts were modeled as a layer located at a distance of 0.5mm from the cell wall and occupying 20% of the
modelled mesophyll cell volume. The relative photosynthetic capacityVc,max(y) at a well defined depth yinside the leaf was
calculated as
Vc,max(y)~ ð
w(y),x[chloroplast dx=(fc:
ð
w(y)
dx) ð11Þ
where the integration is over the widthw(y) of the leaf at the depth
y. The distribution of photosynthesis capacityVc,max(y)along the
depth of the leaf depends on distribution of chlorophyll through the leaf, the presence of vascular region (Figure 2). The vacuolar volume fraction is variable and can be larger than 30% of the cell volume and up to 90% of the cell volume in a mature cell [71]. The vacuoles were modelled explicitly in the mesophyll cells by shrinking the cell area of 2D geometry by 60% and considering the shrunk area to be vacuole. For a spherical cell, for example, this corresponds to a vacuolar volume fraction of 46%. The layer between the cell membrane and the chlorophyll layer and that between the tonoplast and the chlorophyll layer was considered to be cytoplasm. This implies that CO2to reach the vacuole has to pass the cell wall, the plasmalemma, twice the chloroplast membrane, and finally the tonoplast. In reality CO2 can diffuse directly from the plasmalemma to the tonoplast, but we believe that ignoring this only marginally affects intercellular CO2 transport while it simplifies the geometrical model considerably.
The resulting geometry of the tissue was then exported into a finite element simulation code (Comsol 3.5, Comsol AB,
Stock-Figure 8. Reconstructed microscale geometry based on microscopic images of wheat leaf tissue and scheme of fluxes of CO2
species through different compartments of the mesophyll cell.(A) Reconstructed microscale geometry based on microscopic images of wheat leaf tissue [35]. The adaxial surface is at the bottom. E, epidermis; I, intercellular space; M, mesophyll cell; P, phloem; and X, xylem. (B) Detail of reconstructed mesophyll cells in computer model. Chl, chloroplast layer; Cyto, cytoplasm; Cw, cell wall; Vac, vacuole.(C) Scheme of fluxes of CO2 species through different compartments of the mesophyll cell and corresponding resistances. The resistances due to the epidermis, stomata and intercellular space are not included in this scheme. The symbolsCandrindicate CO2concentration and resistance, respectively. The subscriptsi,w,
cyto,c,vacandmemindicate intercellular space, cell wall, cytoplasm, chloroplast, vacuole and membrane, respectively. The resistance of double membrane- chloroplast envelope was modeled as twice the resistance of the phospholipid membrane.AGis the gross photosynthesis rate;Rdis
respiration.
holm, Sweden) via a Matlab interface. The leaf geometry and the corresponding finite element mesh that was used for the simulations are shown in Figure 8.
Gas exchange and chlorophyll fluorescence measurements
Data used for our analysis came from measurements reported by Yin et al. [17] for photosynthesis of wheat plants grown under two contrasting levels of nitrogen supply. Nutrient supply is known to enhance photosynthesis, whereas it has a rather small and inconsistent effect on gm [73]. Simultaneous gas exchange and
chlorophyll fluorescence measurements at both 21% and 2% O2 were performed on main-stem flag leaves at the flowering stage and two weeks after flowering, with four replications at each stage, using an open gas exchange system (Li-Cor 6400; Li-Cor Inc, Lincoln, NE, USA) and an integrated fluorescence chamber head (LI-6400-40; Li-Cor Inc, Lincoln, NE, USA). All measurements were made at a leaf temperature (Tleaf) of 25uC and a leaf-to-air
vapour pressure difference of 1.0–1.6 kPa. For the Ci response
curves, the ambient air CO2 concentration (Ca) was increased
step-wise: 50, 100, 150, 200, 250, 350, 500, 650, 1000, and 1500mmol mol21, while keeping incident irradiance Iinc at
1000mmol m22s21. For theIincresponse curves, the photon flux
densities were in a series: 0, 20, 50, 100, 150, 200, 500, 1000, 1500, 2000mmol m22s21, while keepingCaat 350mmol mol21 for measurements at 21% O2, and keeping Ca at 1000mmol -mol21 for measurements at 2% O2to ensure a non-photorespi-ration condition. The photosynthetic parameters of the FvCB model were estimated from these measurements [17] and are given in Table 4.
Definition of macroscale variables
The microscale model predicts local variables which may depend on the position inside the leaf, whereas the gas exchange and chlorophyll fluorescence experiments measure lumped, macroscale variables of the whole leaf. In order to compare both measurements and simulations, equivalent macroscale variables need to be calculated from the microscale simulation results. We will use the following convention for symbols: macroscopic variables which were estimated from gas exchange and chlorophyll fluorescence experiments are denoted by a ‘‘’ symbol. Volume
averaged variables (area averaged variables in the 2-D model) calculated from the microscale model are overlined.
Chlorophyll fluorescence measurements can assess the photo-system II (PSII) electron transport efficiency as
DF=Fm0~(F
0
m{Fs)=F
0
m, whereFsis the steady-state fluorescence, Fm0 is the maximum fluorescence during a saturating light pulse [74]. Data forDF=Fm0 can be converted into the flux of potential electron transport (J) according to
J~sIincDF=F
0
m ð12Þ
wheresis a calibration factor that can be estimated as the slope of the empirical linear relation betweenAandIinc(DF=F
0
m)=4using data of non-photorespiratory measurements at 2% O2combined with high CO2levels (see Yin et al. [17], for more details). UsingJ estimated from the chlorophyll fluorescence measurements under photorespiration conditions, the mean mesophyll CO2 concentra-tionCC^c was estimated as [10]:
^
C Cc~
C ½J=4z2(AA^zRd)
J=4{(AA^zRd)
ð13Þ
where AA^ is the net CO2 assimilation rate based on the gas exchange measurements.
The volume averaged CO2concentration of the mesophyll cell (Cc) predicted by the microscale model was computed as
Cc~ Ð
Vm CcdV Ð
Vm dV
~ Ð
Vm CcdV
Vm
ð14Þ
The integration domainVmin Equation (14) is the volume (area in
2-D) of all mesophyll cells in the 2-D microstructural image of the leaf tissue.
On the basis of the assumption thatCccan be reliably estimated
by Equation (13) from combined gas exchange and chlorophyll fluorescence data, the mesophyll conductance^ggm was calculated
from [10]:
^
g gm~
^
A A
^
C Ci{CC^c
~
^
A A
^
C Ci{
C ½J=4z2(AA^zRd)
J=4{(AA^zRd)
ð15Þ
whereCCbiiis the intercellular CO2concentration from gas exchange measurements [7] andAA^ the measured photosynthesis rate. The equivalent whole-leafgmpredicted by the microscale model is
gm~ A Ci{Cc
ð16Þ
whereCiis the volume averaged intercellular CO2concentration and computed from the microscale model according to a similar expression as in Equation (14). The whole leaf photosynthesis rate
Ais calculated by integrating the CO2flux from the epidermis to the ambient over the entire exchange surface.
Table 4.Values (6standard error of estimate if applicable) of
photosynthetic parameters estimated for flag leaves of wheat plants at flowering grown at low nitrogen (N) and high N levels at flowering stage. Estimates were made separately for photorespiratory (PR) and non-photorespiratory (NPR) conditions when necessary [17].
Parameters High N Low N
Vc,max(mmolm22s21) 65.860.8 58.560.8
Km,C(mbar) 168617 168617
Km,O2(mbar) 473 473
Sc=o(mbarmbar21) 3.13 3.13
s 0.380 0.403
C*(mbar) 34 34
Rd(mmol m22
s21
) PR 1.317 0.939
Rd(mmol m22s21) NPR 1.573 1.375
Tp(mmol m22s21) 12.960.13 11.160.19
Model calibration and validation
The model equations were solved using the finite element environment Comsol Multiphysics vs. 3.5 (Comsol AB, Stock-holm). The non-linear coupled model equations from (1) to (10) were discretized over the finite element mesh using the weak formulation [75]. The model equations were solved for steady-state conditions. Between the organelles, permeation through the membranes was taken into account. A direct solver was used for solving the resulting set of ordinary differential equations with relative tolerance less than 1026
.
Gas transport properties were obtained from the literature (Table 3). The photosynthetic parameters of the FvCB model for different N treatments and life stages were obtained from Yin et al.[17]. Vc,max was estimated based on the chloroplastic CO2 concentration. The potential electron transport rate J was calculated from the chlorophyll fluorescence measurements (Equation 12). We assumed that all membranes had the same permeability (value indicated in Table 3), but because the chloroplast envelope is a double membrane we assigned half the permeability of the other (single) membranes to it.
For model calibration, data from experiments A1 and A2 of Table 5 were used. Using the photosynthesis response to ambient CO2 concentration (Yin et al. [17], the diffusivity values of the epidermis (Depi) and of the cell wall (Dw) were estimated
simultaneously by fitting the calculated CO2 concentration of the intercellular space and the mesophyll CO2 concentration determined from microscale model to the experimental data using a nonlinear least square estimation procedure in Matlab (The Mathworks, Inc., Natick, USA). The boundary condition used in the parameter estimation was 350mmol mol21CO2at 21% O2 while keepingIinc at 1000mmol m22s21andTleaf at 25uC. The
resulting values were equal to 1.6761027m2s21 and 3.43761027m2s21forDepi andDw, respectively (Table 3). Note
that for reasons outlined before the stomata were not modelled explicitly but their conductance was implicitly included inDepi.
Irradiation affects stomatal aperture [34] and a significant effect on the measured stomatal conductance has been observed. Thus, for modelling of photosynthesis in response to irradiation,Depican
be expected to vary with irradiance. For each measured light intensity, the corresponding Depi was therefore determined by
fitting gs to ^ggs while keeping Dw at the value determined
previously.
For validation, the model predictions were compared to experimental data that were not used for the parameter estimation, i.e. dataset B1, C1, D1, B2, C2 and D2 of Table 5. The same values ofDepiandDwas in the calibration experiments
were assumed.
Supporting Information
Text S1 Lumped microscale modeling.
(DOC)
Figure S1 Computed CO2 distribution in wheat leaf
according to the model with and without chloroplasts.
The ambient conditions were 350mmol mol21
CO2, 21% O2, Iinc= 1000mmol m22s21 and Tleaf= 25uC. Concentrations are
expressed inmmol m23
. (A) and (B) are simulation results with and without chloroplasts.
(TIF)
Figure S2 Simulations and measurements at different
conditions ofCiat 21% O2,Iinc= 1000mmol m22
s21 and 256C. The left and right figures represent simulations at two weeks after flowering for high and low N supply flag leaves,
respectively. Figures (A) and (B) show the net CO2 assimilation rate (A) as function of intercellular CO2 concentration Ci. The
symbols represent measurements (AA^ versus CCbii) while the lines
indicate model predictions (AversusCi). Figures (C) and (D) depict
^
C
CcversusCc. The diagonal lines indicate perfect correspondence.
Figures (E) and (F) showgm as function ofCi. The solid (—) line
representsgm versusCi. The symbols (o) represent the measured
data (^ggm versusCCbii). Data are from Yin et al. [17].
(TIF)
Figure S3 Model predictions (lines) versus
measure-ments (symbols) of photosynthesis variables for
350mmol mol21 CO2, 21% O2, Iinc from 0 to
2000mmol m22
s21
and 256C.Left figures and right figures
represent simulations for high N and low N supply flag leaves at two weeks after flowering. Figure (A) and (B) showCi andCc as
function ofIinc; the solid lines (—) and dashed lines (- -) represent CiandCc, symbols (6) and (o) representCCbiiandCCccc, respectively.
Figure (C) and (D) showAas function ofIinc, while figure (E) and
(F) indicate the mesophyll conductance gm (—) or ^ggm (o) as
function ofIinc. Data from Yin et al. [17].
(TIF)
Figure S4 Simulated net photosynthesis of wheat leaf as
function of temperature. (A) Temperature dependence of
Vc,maxandJmax. Values are normalized to 1 at 25uC. Arrhenius-like
expressions forVc,max and Jmaxas a function of temperature are
described by [44] and [29], respectively. (B) Simulated net photosynthesis of wheat leaf as function of temperature. A, Ac
and Aj are the mean net photosynthesis rate, rubisco activity
limited net photosynthesis rate and electron transport limited net photosynthesis rate computed from the microscale model.Vc,max
andJmaxas function of temperature are taken from [44] and [29],
respectively while the temperature dependence of other FvCB parameters (Rd, C*, Km,C, Km,O2) were was from [39] and [40].
Model predictions of photosynthesis were for high N wheat leaf at the flowering stage, 350mmol mol21 CO2, 21% O2, Iinc of
1000mmol m22s21. (TIF)
Acknowledgments
The authors would like to acknowledge two anonymous reviewers for their valuable suggestions during the revision process. Wageningen based authors thank Pascual Romero for his contribution to the data collection.
Author Contributions
Conceived and designed the experiments: BMN QTH PV XY PCS. Performed the experiments: XY PCS. Analyzed the data: QTH PV BMN. Contributed reagents/materials/analysis tools: BMN QTH PV XY PCS. Wrote the paper: BMN QTH PV XY PCS.
References
1. Flexas J, Diaz-Espejo A, Galmes J, Kaldenhoff R, Medrano H, et al. (2007) Rapid variation of mesophyll conductance in response to changes in CO2
concentration around leaves. Plant Cell Environ 30: 1284–1298.
2. Flexas J, Ribas-Carbo´ M, Diaz-Espejo A, Galmes J, Medrano H (2008) Mesophyll conductance to CO2: current knowledge and future prospects. Plant
Cell Environ 31:602–621.
3. Tholen D, Zhu X-G (2011) The mechanistic basis of internal conductance: a theoretical analysis of mesophyll cell photosynthesis and CO2diffusion. Plant
Physiol 156:90–105.
4. Farquhar GD, Sharkey TD (1982) Stomatal conductance and photosynthesis. Ann Rev Plant Physiol 33:317–345.
5. Bernacchi CJ, Portis AR, Nakano H, von Caemmerer S, Long SP (2002) Temperature response of mesophyll conductance. Implication for the determi-nation of Rubisco enzyme kinetics and for limitations to photosynthesis in vivo. Plant Physiol 130: 1992–1998.
6. Goudriaan J, van Laar HH (1978) Relations between resistance, CO2
concentration and CO2assimilation in maize, beans, lalang grass and sunflower.
Photosynthetica 12: 241–249.
7. von Caemmerer S, Farquhar GD (1981) Some relationships between the biochemistry of photosynthesis and the gas-exchange of leaves. Planta 153: 376– 387.
8. Bongi G, Loreto F (1989) Gas-exchange properties of salted-stressed olive (Olea europeaL.) leaves. Plant Physiol 90: 1408–1416.
9. Di Marco G, Manes F, Tricoli D, Vitale E (1990) Fluorescence parameters measured concurrently with net photosynthesis to investigate chloroplastic CO2
concentration in leaves of Quercus ilex L. J Plant Physiol 136: 538–543. 10. Harley PC, Loreto F, Di Marco G, Sharkey TD (1992) Theoretical
considerations when estimating the mesophyll conductance to CO2flux by
analysis of the response of photosynthesis to CO2. Plant Physiol 98: 1429–1436.
11. Evans JR, von Caemmerer S (1996) Carbon dioxide diffusion inside leaves. Plant Physiol 110: 339–346.
12. Yin X, Struik PC (2009) Theoretical reconsiderations when estimating the mesophyll conductance to CO2diffusion in leaves of C3plants by analysis of
combined gas exchange and chlorophyll fluorescence measurements. Plant Cell Environ 32: 1513–1524 (corrigendum in Plant Cell Environ 33: 1595). 13. Loreto F, Harley PC, Di Marco G, Sharkey TD (1992) Estimation of mesophyll
conductance to CO2flux by three different methods. Plant Physiol 98: 1437–
1443.
14. Evans JR, von Caemmerer S, Setchell BA, Hudson GS (1994) The relationship between CO2transfer conductance and leaf anatomy in transgenic tobacco with
a reduced content of Rubisco. Aust J Plant Physiol 21: 475–495.
15. von Caemmerer S, Evans JR, Hudson GS, Andrews TJ (1994) The kinetics of ribulose-1,5-bisphosphate carboxylase/oxygenase in vivo inferred from mea-surements of photosynthesis in leaves of transgenic tobacco. Planta 195: 88–97.
16. von Caemmerer S (2000) Biochemical models of leaf photosynthesis. In: Techniques in Plant Sciences No. 2. Collingwood, Victoria, Australia: CSIRO Publishing. p.196.
17. Yin X, Struik PC, Romero P, Harbinson J, Evers JB, et al. (2009) Using combined measurements of gas exchange and chlorophyll fluorescence to estimate parameters of a biochemical C-3 photosynthesis model: a critical appraisal and a new integrated approach applied to leaves in a wheat (Triticum aestivum) canopy. Plant Cell Environ 32: 448–464.
18. von Caemmerer S, Evans JR (1991) Determination of the average partial pressure of CO2in chloroplasts from leaves of several C3plants. Aust J Plant
Physiol 18: 287–305.
19. Centritto M, Loreto F, Chartzoulakis K (2003) The use of low [CO2] to estimate diffusional and non-diffusional limitations of photosynthetic capacity of salted-stressed olive saplings. Plant Cell Environ 26: 585–594.
20. Evans JR, Kaldenhoff R, Genty B, Terashima I (2009) Resistances along the CO2diffusion pathway inside leaves. J Exp Bot 60: 2235–2248.
21. Tholen D, Boom C, Noguchi K, Ueda S, Katase T, et al. (2008) The chloroplast avoidance response decreases internal conductance to CO2 diffusion in
Arabidopsis thalianaleaves. Plant Cell Environ 31: 1688–1700.
22. Terashima I, Hanba YT, Tholen D, Niinemets U (2011) Leaf functional anatomy in relation to photosynthesis. Plant Physiol 155: 108–116.
23. Vesala T, Ahonen T, Hari P, Krissinel E, Shokhirev N (1996) Analysis of stomatal CO2uptake by a three-dimensional cylindrically symmetric model.
New Phytol 132: 235–245.
24. Aalto T, Juurola E (2002) A three-dimensional model of CO2transport in
airspaces and mesophyll cells of a silver birch leaf. Plant Cell Environ 25:1399– 1409.
25. Uehlein N, Otto B, Hanson DT, Fischer M, McDowell N, et al. (2008) Function ofNicotiana tabacumaquaporins as chloroplast gas pores challenges the concept of membrane CO2 permeability. Plant Cell 20: 648–657.
26. Ho QT, Verboven P, Mebatsion HK, Verlinden BE, Vandewalle S, et al. (2009) Microscale mechanisms of gas exchange in fruit tissue. New Phytol 182: 163– 174.
27. Ho QT, Verboven P, Verlinden BE, Herremans E, Wevers M, et al. (2011) A 3-D multiscale model for gas exchange in fruit. Plant Physiol 155: 1158–1168. 28. Ho QT, Verboven P, Verlinden BE, Nicolaı¨ BM (2010) A model for gas
transport in pear fruit at multiple scales. J Exp Bot 61: 2071–2081.
29. Farquhar GD, von Caemmerer S, Berry JA (1980) A biochemical model of photosynthetic CO2assimilation in leaves of C3species. Planta 149: 78–90.
30. Leuning R (1995) A critical appraisal of a combined stomatal-photosynthesis model for C3plant. Plant Cell Environ 18: 339–355.