STATISTICAL ANALYSIS ON THE IMPACT
OF RELIGION OVER POPULATION’S LIFE
SATISFACTION
PhD Professor Tudorel ANDREI
PhD Univ. Lecturer Claudiu HERTELIU PhD Candidate Bogdan Vasile ILEANU Academy of Economic Studies, Bucharest
Abstract
The article intends to test (using quantitative techniques) a few elements of religious behavior incurred on the occasion of the main religious holidays. The statistic information available is based on a statistic survey representative for the level of the non-institutionalized adult population in Romania. The fi eld research took place in November 2010 and was based on face-to-face interviews in the homes of the respondents.
Key words: religion, quantitative methods, main religious holidays
***
Structure and methodology
The results obtained are based on processing a data base constructed after a survey applied on a sample representative for the national level. The sample is formed of 1003 persons. The implementation of the survey was realized by the National Institute of Statistics (through the National Centre of Preparation in Statistics). We present the distribution of the sample as well as of the Romanian population by urban and rural environments.
Comparisons between the structure of the sample used in our research and elements published in offi cial statistics
Table 1
Residence environment Percentage (%)
Sample Annual Statistic Report for Romania - 2009
Urban 59.8 55.0
Rural 40.2 45.0
The sample was placed in 142 settlements out of 41 counties and the 6 districts of Bucharest. It was thus ensured – through EMZOT – a balanced distribution at national level and consequently a good representativeness. It is thus assessed to what degree there are differences between the various categories of people as against to the signifi cance of the main religious holidays. In the questionnaire we introduced a question in order to assess the signifi cance of the main religious holidays. The assessment of the opinions regarding this subject is made on a measurement scale of six values defi ned as follows: 1 – never, 2 – rarely, 3 – sometimes, 4 – often, 5 – always and 0 – not applicable. Within the study we considered ten important meanings of the main religious holidays. They are grouped in the following categories:
1) Religious activities (religious and spiritual mediation, confession, attending religious services, charity and other good deeds);
2) Social activities (festive meals, parties with close people, extended family reunions);
3) Commercial and relaxation activities (renewing wardrobe, additional expenses, excellent periods for rest and relaxation). Processing each of the ten data series is accomplished in the following situations:
- At the level of the entire population;
- At the level of the people who declare they practice religion and of the ones who don’t;
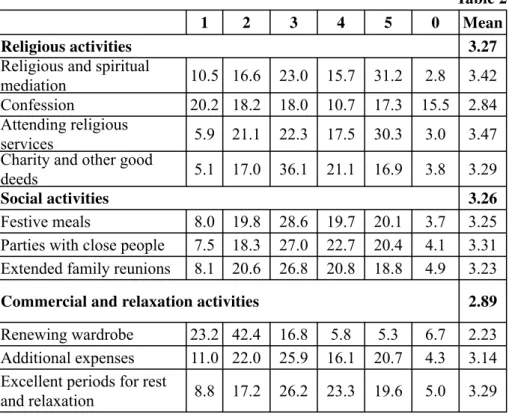
Table 2 presents the distribution of the responses for the ten variables at the level of the sample population.
The distribution of the responses regarding the signifi cance of the main religious holidays
Table 2
1 2 3 4 5 0 Mean
Religious activities 3.27
Religious and spiritual
mediation 10.5 16.6 23.0 15.7 31.2 2.8 3.42
Confession 20.2 18.2 18.0 10.7 17.3 15.5 2.84
Attending religious
services 5.9 21.1 22.3 17.5 30.3 3.0 3.47
Charity and other good
deeds 5.1 17.0 36.1 21.1 16.9 3.8 3.29
Social activities 3.26
Festive meals 8.0 19.8 28.6 19.7 20.1 3.7 3.25
Parties with close people 7.5 18.3 27.0 22.7 20.4 4.1 3.31 Extended family reunions 8.1 20.6 26.8 20.8 18.8 4.9 3.23
Commercial and relaxation activities 2.89
Renewing wardrobe 23.2 42.4 16.8 5.8 5.3 6.7 2.23
Additional expenses 11.0 22.0 25.9 16.1 20.7 4.3 3.14
Excellent periods for rest
and relaxation 8.8 17.2 26.2 23.3 19.6 5.0 3.29
The results above highlight the special meaning of religious holidays for social activities as well as religious activities. Within religious activities, attending religious services and religious and spiritual meditation stand out for the period of the holidays. We must point out that around the time of the main holidays only a small part of the population renews their wardrobe. On the other hand, this period is a great opportunity for rest and relaxation.
Assessing the types of fast for the fasting category of respondents Table 3 Never Rarely Occasionally Often Always Not
applicable
Classic fasting (not black. Without meat/ alcohol/milk, etc)
10.7 14.7 22.0 23.2 19.2 10.3
Black fasting (non-alcoholic beverages)
55.1 17.8 8.6 8.4 10.0
On Wednesdays
and Fridays 4.9 12.1 21.1 29.8 21.7 10.3
Easter fasting 0.4 76.4 23.2
Christmas
fasting 0.4 76.1 23.5
Other fasts 15.7 14.7 22.3 7.8 19.1 20.3
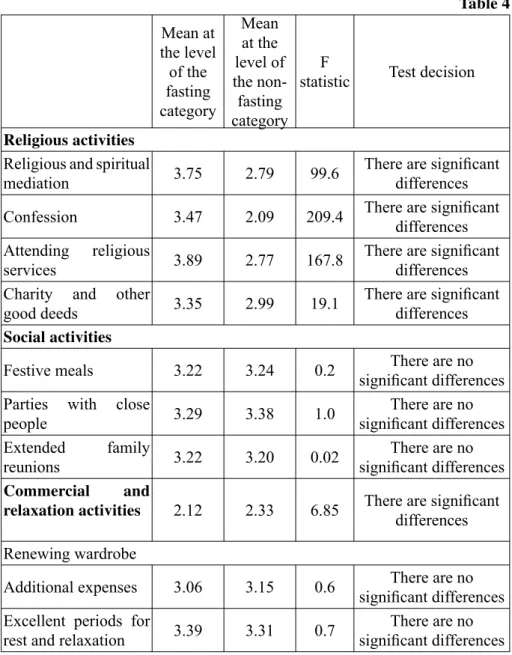
ANOVA in order to establish whether there are differences between the people who fast and those who don’t
Table 4
Mean at the level of the fasting category
Mean at the level of the non-fasting category
F
statistic Test decision
Religious activities
Religious and spiritual
mediation 3.75 2.79 99.6
There are signifi cant differences
Confession 3.47 2.09 209.4 There are signifi cant
differences Attending religious
services 3.89 2.77 167.8
There are signifi cant differences Charity and other
good deeds 3.35 2.99 19.1
There are signifi cant differences
Social activities
Festive meals 3.22 3.24 0.2 There are no
signifi cant differences Parties with close
people 3.29 3.38 1.0
There are no signifi cant differences Extended family
reunions 3.22 3.20 0.02
There are no signifi cant differences
Commercial and
relaxation activities 2.12 2.33 6.85 There are signifi cant differences
Renewing wardrobe
Additional expenses 3.06 3.15 0.6 There are no
signifi cant differences Excellent periods for
rest and relaxation 3.39 3.31 0.7
There are no signifi cant differences The results show the following:
- The differences between the two groups of people are signifi cant only if we consider three out of the four variables included in the “social activities” section defi ned for understanding the signifi cance of the religious holidays.
- Relative to the two variables included in the section of “commercial and relaxing activities” there are no signifi cant differences between the two groups of respondents.
Within the study, we inserted a question intended to evaluate in what measure the interviewed persons are religiously active or not (religious practice consists of attending church services, living according to the principles of the church, fi nancial donations, etc). The distribution of the answers to this question is presented in the table below. The results show an important weight of the people who live by their religion.
The distribution of respondents based on their practicing religion
Table 5
Answer Yes No
Weight (%) 55.1 44.9
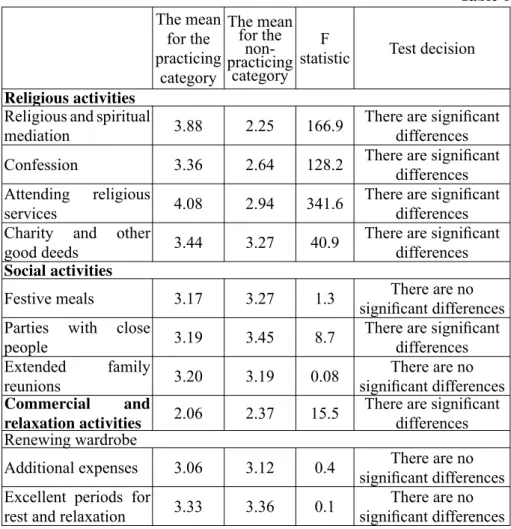
ANOVA in order to establish whether there are signifi cant differences between the people who practice religion and those who don’t in
understanding the main religious holidays
Table 6 The mean for the practicing category The mean for the non-practicing category F
statistic Test decision
Religious activities
Religious and spiritual
mediation 3.88 2.25 166.9
There are signifi cant differences
Confession 3.36 2.64 128.2 There are signifi cant
differences Attending religious
services 4.08 2.94 341.6
There are signifi cant differences Charity and other
good deeds 3.44 3.27 40.9
There are signifi cant differences
Social activities
Festive meals 3.17 3.27 1.3 There are no
signifi cant differences Parties with close
people 3.19 3.45 8.7
There are signifi cant differences Extended family
reunions 3.20 3.19 0.08
There are no signifi cant differences
Commercial and
relaxation activities 2.06 2.37 15.5
There are signifi cant differences Renewing wardrobe
Additional expenses 3.06 3.12 0.4 There are no
signifi cant differences Excellent periods for
rest and relaxation 3.33 3.36 0.1
There are no signifi cant differences The results allow us to make some comments:
1. For the variables in the “religious activities” section we notice signifi cant
difference between and practicing and non-practicing categories in the sense of the defi nition given in the questionnaire
2. For two of the four variables in the “social activities” section there are
3. Relative to the two variables included in the “commercial and relaxation”
section, there are no signifi cant differences between the two groups of respondents.
Acknowledgements
This paper was designed with support from the following research project: „The Infl uence of Religion on the Social Processes from Romania– A Quantitative New-Weberian Approach Using Statistical Samples Techniques”, code 1809, Project Manager Claudiu Herţeliu. Grant won in 2008 “Ideas” Competition from PNCD II and fi nancial supported by UEFISCSU.
Conclusions
The results show signifi cant differences between the persons who fast and who don’t relative to characteristics regarding religious activities in understanding the main religious holidays. Signifi cant differences between the two groups of persons are not shown when taking into consideration social, commercial and relaxing activities.
Signifi cant differences are also noticed between the people who practice religion and those who don’t relative to certain variables used in order to assess the signifi cance of the main religious holidays. Between the two categories there are signifi cant differences relative to: religious and spiritual meditation, confession, attending religious services, charity and other good deeds, spending time with close friends and renewing wardrobe.
Bibliografi e
- Alesina, Alberto, Arnaud Devleeschauwer, William Easterly, Sergio Kurlat, and Romain Wacziarg. “Fractionalization.” Journal of Economic Growth. 8 (2003):155–194.
- Berman, Eli, 2000. Sect, subsidy, and sacrifi ce: an economist’s view of ultra-orthodox Jews. Quarterly Journal of Economics 115 (3), 905–953
- Birnir, Jóhanna Kristín. (2004-a). “Stabilizing party systems and excluding segments of Society? The effects of formation costs on new parties în Latin America.” Studies în Comparative International Development. 39(3): 3–28.
- Birnir, Jóhanna Kristín. (2004-b) “Institutionalizing the party system.” în Henry Carey, eds., Romania since 1989; Politics, Economics and Society. . Lexington, MA: Lexington Books. pp 105-22.
- Birnir, Jóhanna Kristín. (2005). “Public venture capital and party institutionalization.” Comparative Political Studies. 38(8): 915–38.
- Birnir, Jóhanna Kristín, and Donna Lee Van Cott. (2007). “Disunity în diversity: Party system fragmentation and the dynamic effect of ethnic heterogeneity on Latin American legislatures.” Latin American Research Review. Vol. 42(1).
- Birnir, Jóhanna Kristín. (2007). Ethnicity and Electoral Politics. Cambridge and New York: Cambridge University Press.
- Bisin, Alberto and Thierry Verdier (2000), “Beyond the Melting Pot: Cultural Transmission, Marriage, and the Evolution of Ethnic and Religious Traits”, Quarterly Journal of Economics, 115(3), 955—988.