Marília Ramos
Programa de Mestrado e Doutorado em Desenvolvimento Regional. Universidade de Santa Cruz do Sul. Santa Cruz do Sul, RS, Brasil
Correspondência | Correspondence:
Marília Ramos
Programa de Mestrado e Doutorado em Desenvolvimento Regional
Universidade de Santa Cruz do Sul Av. Independência 2293, sala 505 96815-900 Santa Cruz do Sul, RS, Brasil E-mail: [email protected]
Received: 8/4/2006 Reviewed: 3/1/2007 Approved: 3/14/2007
Impact of socioeconomic status
on Brazilian elderly health
Impacto do status socioeconômico
na saúde de idosos brasileiros
ABSTRACT
OBJECTIVE: To investigate the impact of socioeconomic status on elderly health.
METHODS: The study was based on cross-sectional data from Survey on Health, Well-Being, and Aging in Latin America and the Caribbean. The sample comprised 2,143 non-institutionalized elderly aged 60 years and older living in the urban area of São Paulo, southeastern Brazil. Linear regression models estimated the effect of socioeconomic status indicators (years of schooling completed, occupation and purchasing power) on each one of the following health indicators: depression, self-rated health, morbidity and memory capacity. A 5% signifi cance level was set.
RESULTS: There was a signifi cant effect of years of education and purchasing power on self-rated health and memory capacity when controlled for the variables number of diseases during childhood, bed rest for at least a month due to health problems during childhood, self-rated health during childhood, living arrangements, sex, age, marital status, category of health insurance, intake of medicines. Only purchasing power had an effect on depression. Despite the bivariate association between socioeconomic status indicators and number of diseases (morbidity), this effect was no longer seen after including the controls in the model.
CONCLUSIONS: The study results confirm the association between socioeconomic status indicators and health among Brazilian elderly, but only for some dimensions of socioeconomic status and certain health outcomes.
RESUMO
OBJETIVO: Investigar o impacto do status socioeconômico na saúde de idosos.
MÉTODOS: Utilizou-se a base de dados transversal Inquérito sobre a Saúde, o Bem estar o Envelhecimento na América Latina e Caribe. Analisaram-se 2.143 idosos (60 anos ou mais) residentes em domicílios, na área urbana de São Paulo, no ano de 2000. Modelos de regressões lineares estimaram o efeito dos indicadores de status socioeconômico (anos de estudo completos, ocupação e poder de compra) nos indicadores de saúde: depressão, auto-avaliação da saúde, morbidade e capacidade de memória. O nível de signifi cância adotado foi de 5%.
RESULTADOS: Observou-se efeito signifi cativo dos anos de estudo e do poder de compra na auto-avaliação da saúde e na capacidade da memória, quando controlado pelas variáveis: número de doenças antes dos 15 anos de idade, ter fi cado na cama ao menos por um mês por problema de saúde antes dos 15 anos, auto-avaliação da saúde na infância, arranjos de vida, sexo, idade, estado civil, tipo de seguro de saúde, ingestão de remédios. Somente a capacidade de compra apresentou efeito na depressão. Apesar das análises bivariadas indicarem uma associação entre status socioeconômico e o número de doenças (morbidade), este efeito desapareceu quando os controles entraram no modelo.
CONCLUSÕES: Os resultados confi rmam a associação entre indicadores socioeconômicos e a saúde dos idosos brasileiros, mas somente entre alguns indicadores e certos aspectos da saúde.
DESCRITORES: Saúde do idoso. Condições sociais. Fatores socioeconômicos. Estudos transversais. SABE. Brasil.
The impact of socioeconomic status (SES) on elderly health is controversial. Some studies show that older adults with high SES have better health than those with low SES,2,15,18 but other studies show that the strength of
this association decreases, or even disappears, among older ages.1,5,10 However, there are very few studies
about this relationship in developing countries.13,21
Most experts hold that SES differences in health are produced as a result of various health-related fac-tors such as living and working conditions, access to health care services, social relationships, and
diversi-fi ed lifestyles.6,14 SES differentials in health may also
result from health selection. People with preexisting illness drift down the social scale: those with poor health are selected into lower SES through decreased labor force participation or through withdrawal from paid work.24
Some studies have shown that health variations in adults are attributed to both early and later life circumstances,7
suggesting that childhood SES has lasting effects on health beyond its impact on later status attainment. Other studies did not fi nd a signifi cant association
be-tween childhood SES and later health once adult SES is taken into account.16
The relationship between SES and health is shown to be strong, regardless of how SES is measured, whether via income,11 occupation8 or education.1,17 However, there
is no consensus about the idea that in old ages there is no difference in health among different SES.
According to House et al9 social stratifi cation of aging
and health is produced by social and biological mecha-nisms which determine both exposure to and the impact of a set of psychological variables. House et al9,10 argued
that socioeconomic differences in health (morbidity) increase through early old age and do not converge until later old age (i.e., age 75 and older).
Despite the numerous studies about this subject, the majority of them were carried out in developed coun-tries and little attention has been given to developing countries.13,21
The objective of the present study was to investigate the impact of SES on health in older ages and how this relation changes when controlled for confounding
variables in a developing country. The hypothesis is that due to the great distance between social strata and unequal access to adequate health care in Brazil, SES has a signifi cant impact on elderly health. The knowl-edge about the impact of SES in the elderly health is crucial for developing policies and because older adults, particularly those at more advanced ages, are a fast growing population segment.
METHODS
The study was based on cross-sectional data from the Survey on Health, Well-Being, and Aging in Latin America and the Caribbean (SABE),* which was funded by the Pan American Health Organization and coordinated by the Center for Demography and Ecology on the University of Wisconsin – Madison. In Brazil, it was coordinated by Faculdade de Saúde Pública, Universidade de São Paulo.
The sample comprised 2,143 individuals aged 60 years and older living in private households in urban areas in the city of São Paulo, during the year 2000. It was generated through a multistage process by conglomer-ates with stratifi cation of the units at the highest levels of aggregation.
Most interviews were carried out directly with the aged and only 12.9% of them were carried out with a substitute or proxy. However, the main variables were not obtained from questions answered by proxies. Missing cases were less than 5%. There were 12% of missing cases for depression symptoms and 16% for number of diseases under the age of 15. There were no signifi cant differences between respondents and non-respondents, tested by logistic regressions on the independent variables.
Individual analysis for different age groups were not performed as recommended in the literature (Elder4
1999) as there were not enough cases for that. Four measures of health in adulthood were examined: memory capacity, depression, self-rated health and morbidity.
Memory capacity was assessed using Folstein8
Mini-Mental State Examination (MMSE), a recall test, which included words and numbers showed to subjects in a certain order, in different moments during the interview process.
For studying depression,the Yesavage Geriatric De-pression Scale24 was used with 15 dummy variables.
The number of depressive symptoms was a count of the
affi rmative responses, with three items tapping positive affect reverse coded.
Self-rated health was based on a 5-point scale ranging from poor to excellent. This measure captures respon-dents’ overall assessment of their own medical and functional status.
In regard to morbidity,respondents indicated whether they have ever been told by a doctor that they have/ had cancer, diabetes, heart disease, cerebrovascular disease, chronic lung illnesses, high blood pressure or arthritis/rheumatism. Seven dummy variables indicated the presence of each disease. Prior research7 has shown
substantial agreement between surveys self-reports of medical conditions and medical record reports of major medical conditions in representative samples in the United States. The number of chronic conditions was the total number reported, ranging from zero to seven.
The independent variable was the adult’s SES, corre-sponding to respondent’s own education, purchasing power and main occupation in life. Education was measured in complete years of schooling.
Purchasing power was assessed by the ownership of goods, which in Brazil refl ect social class position (Associação Brasileira de Empresas de Pesquisas** – Brazilian Association of Marketing Research). Those items are: automobile, refrigerator, washing machine, water boiler, microwave oven, telephone, VCR/DVD player, stereo system, fan, air conditioner and heater. Main occupation was based on the International Stan-dard Classifi cation of Occupations (ISCO) of the Inter-national Labor Organization (ILO). Based on Waitzman & Smith,23 occupations were added into three categories
and converted into three dummy variables. The fi rst category was high status occupation (jobs requiring high education, offering opportunities, well-paid, and involving technical work and independent decision making); the second category was medium status oc-cupation (craft jobs requiring some years of education and affording latitude in decision making); the third was low status occupation (often machine-paced and subject to strict timetables, rules and supervision and with little security and opportunity). High status occupation was the reference category in the multivariate models. The variable “income” was not used due to the exces-sive number of missing cases (86.4%).
Although the literature emphasizes people’s childhood SES should be known in order to understand adult’s
The average age was 73.28 years (SD=8.46) and 59% were female, 35.1% had private health insurance and 64.8% said they did not have it.
As for dimensions of SSE, mean score for education was 3.01, SD=1.24). This variable had 1.1% of miss-ing cases. In terms of occupation, subjects tended to have low occupational status (71.3% of the sample), which was associated with poor self-evaluation of their SES during childhood (p≤0.05). Interviewees with low occupational status evaluated their SES dur-ing childhood as poor as those with high occupational status, thus showing the predominance of low social mobility in Brazil.
Those who positively rated their health during child-hood not always rated their current health in a positive way. Specifi cally, among those who rated their health during childhood as good, 12.1% of them rated their current health as bad; 44.4% as regular; 33.9% as good; 2.4% as very good and 7.3% as excellent. The ANOVA test for self-rating of health between past and current number of diseases was statistically signifi -cant: the highest number of diseases is related to the lowest health rating categories. The Tukey Post hoc test identifi ed signifi cant differences in terms of the average number of diseases between good and excel-lent categories.
An ANOVA test showed a signifi cant association be-tween self-rating of health and the number of depressive symptoms, where the highest means were seen in the lowest health rating categories. There was no signifi cant difference among positive categories.
Another ANOVA showed signifi cant association be-tween memory capacity and self-rated health, the high-est means were in the positive health rating categories but without signifi cant difference between good, very good and excellent categories.
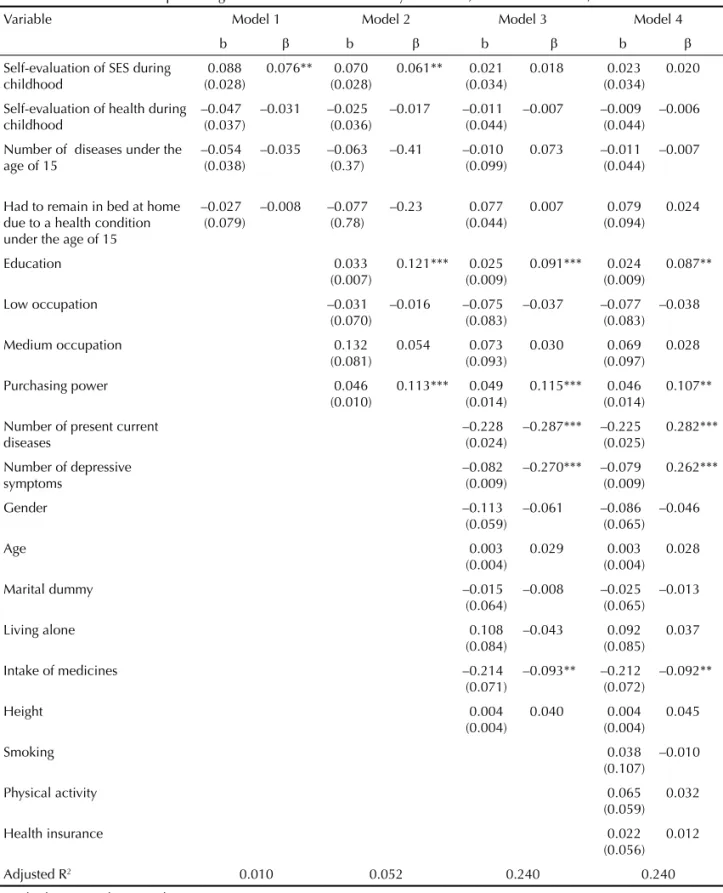
Self-rating of health was not affected by childhood characteristics, differently than that expected (Model 1; Table 1). Education had a positive effect on the subjective rating of health (Model 2). Even after con-trolling this effect was reduced but still statistically signifi cant. The purchasing power followed the same pattern, i.e., after controlling for confounders, it had a greater effect on self-rated health compared to the education effect. Therefore, only some dimensions of SES have an impact on the way Brazilian older adults rate their health.
The controlling variables that had a negative effect on this indicator of health were: morbidity (number of diseases), depression (number of depressive symptoms) and intake of medicines. As expected, self-rating of health was affected by physical and mental health. health, this is not problematic in Brazil because social
and intra-generational mobility is not so frequent.19
Thus self-rated childhood SES was included in the models as a control.
Controlling variables were the following:
Childhood SES – Respondent’s rating of SES as a child was coded on a 3-point scale ranging from poor to very good.
Childhood health –Respondent’s rating of health as a child was coded on a 5-point scale ranging from poor to excellent. Although retrospective reports of childhood health are subject to recall bias and measurement error, previous studies5 found a high level of internal
consis-tency between reports of general health and specifi c long-term health limitations in childhood. Other measure of childhood health was obtained as a dummy variable from the question if the subjects had to remain in bed at home for one month or more due to a health condi-tion under the age of 15. The last measure of childhood health was the total number of diseases under the age of 15, which ranged from zero to seven and involved the same set of diseases used to measure adult number of present chronic conditions. Height was also included as a control, indicating health problems during childhood. Other controlling variables were sex and age, mari-tal status, living arrangements, intake of medicines, smoking, category of health insurance, and physical exercise, defi ned as regular physical exercise in the last six months.
After the descriptive analysis, four regression models were constructed for each adult health outcome. Model 1 included childhood SES and health only. Model 2 added SES indicators. Model 3 added other health indi-cators in adult life, indiindi-cators of comorbidity for each of the dependent variables were included along with age, gender and living arrangements. Model 4 added risk behaviors and category of health insurance. Statistical analyses were performed using the SPSS version 14.0. Multicolinearity was not a problem.
RESULTS
The scores for memory capacity were summed and total score ranged from zero to 19, (mean=16.11, SD=3.05), with an alpha coeffi cient of 0.77. The depression scale ranged from zero to 15 (mean=2.99, SD=1.05) with an alpha coeffi cient of 0.80. The mean of self-rated health was 2.5 (SD=0.90). The alpha coeffi cient for morbidity scale was 0.72 (mean=1.52, SD=0.18). The respondents generally reported few health problems during child-hood (mean=0.97, SD=0.37).
Table 2 shows the results of a multivariate analysis of SES on morbidity of the elderly. SES childhood evalu-ation had a signifi cant negative effect on morbidity, even after controlling for other confounders. Another childhood-related variable that had positive effect on
current number of diseases was the number of diseases under the age of 15, but this effect was no longer seen with current health characteristics. SES did not have a statistically signifi cant effect on morbidity. The number of depressive symptoms and intake of medicines have
Table 1. Multivariate models predicting self–rated health of the elderly. São Paulo, southeastern Brazil, 2000.
Variable Model 1 Model 2 Model 3 Model 4
b β b β b β b β
Self-evaluation of SES during childhood
0.088 (0.028)
0.076** 0.070
(0.028)
0.061** 0.021
(0.034)
0.018 0.023
(0.034) 0.020
Self-evaluation of health during childhood
–0.047 (0.037)
–0.031 –0.025
(0.036)
–0.017 –0.011
(0.044)
–0.007 –0.009
(0.044) –0.006
Number of diseases under the age of 15
–0.054 (0.038)
–0.035 –0.063
(0.37)
–0.41 –0.010
(0.099)
0.073 –0.011
(0.044) –0.007
Had to remain in bed at home due to a health condition under the age of 15
–0.027 (0.079)
–0.008 –0.077
(0.78)
–0.23 0.077
(0.044)
0.007 0.079
(0.094) 0.024
Education 0.033
(0.007)
0.121*** 0.025
(0.009)
0.091*** 0.024
(0.009)
0.087**
Low occupation –0.031
(0.070)
–0.016 –0.075
(0.083)
–0.037 –0.077
(0.083) –0.038
Medium occupation 0.132
(0.081)
0.054 0.073
(0.093)
0.030 0.069
(0.097) 0.028
Purchasing power 0.046
(0.010)
0.113*** 0.049
(0.014)
0.115*** 0.046
(0.014)
0.107**
Number of present current diseases
–0.228 (0.024)
–0.287*** –0.225
(0.025)
0.282***
Number of depressive symptoms
–0.082 (0.009)
–0.270*** –0.079
(0.009)
0.262***
Gender –0.113
(0.059)
–0.061 –0.086
(0.065) –0.046
Age 0.003
(0.004)
0.029 0.003
(0.004) 0.028
Marital dummy –0.015
(0.064)
–0.008 –0.025
(0.065) –0.013
Living alone 0.108
(0.084)
–0.043 0.092
(0.085) 0.037
Intake of medicines –0.214
(0.071)
–0.093** –0.212
(0.072)
–0.092**
Height 0.004
(0.004)
0.040 0.004
(0.004) 0.045
Smoking 0.038
(0.107) –0.010
Physical activity 0.065
(0.059) 0.032
Health insurance 0.022
(0.056) 0.012
Adjusted R2 0.010 0.052 0.240 0.240
Standard errors in the parentheses. * p<0.05
** p<0.01 *** p<0.001
a signifi cant positive effect on morbidity. Maybe the latter is a reciprocal effect but this was not possible to be tested. Physical activities appeared to contribute for reducing the current number of diseases.
The multivariate analysis showed that education had a signifi cant positive impact on memory capacity even after controlling for confounders (Table 3). Occupa-tion had positive impact on memory capacity: those in high status occupation had high scores in terms of memory resources than those in lower status
occupa-tion. However, the effect of occupation disappeared in the presence of controls related to current health status. Age had an important impact on memory capacity, as memory capacity decreases with aging. Depression also had negative impact on memory capacity and height had a positive effect.
Multivariate models for depression and SES are pre-sented in Table 4. Health during childhood had a posi-tive and signifi cant impact on the current number of depressive symptoms. The number of diseases during
Table 2. Multivariate models predicting morbidity of the elderly. São Paulo, southeastern Brazil, 2000.
Variable Model 1 Model 2 Model 3 Model 4
b β b β b β b β
Self-evaluation of SES during childhood –0.060 (0.027)
–0.089* –0.061 (0.028)
–0.081* –0.110
(0.044)
–0.074* –0.117
(0.044) –0.080*
Self-evaluation of health during childhood
–0.007 (0.049)
–0.003 –0.007
(0.049)
–0.004 0.011
(0.057)
0.005 0.014
(0.057) 0.007
Number of diseases under the age of 15 0.117 (0.050)
0.058** 0.118 (0.050)
0.058** 0.050
(0.058)
0.025 0.047
(0.058) 0.024
Had to remain in bed at home due to a health condition under the age of 15
0.184 (0.104)
0.104 0.177
(0.106)
0.041 0.095
(0.122)
0.023 0.113
(0.122) 0.057
Education –0.012
(0.010)
–0.035 0.007
(0.012)
0.019 0.010
(0.012) 0.029
Low occupation –0.091
(0.094)
–0.035 –0.078
(0.108)
–0.031 –0.067
(0.128) –0.027
Medium occupation –0.129
(0.110)
–0.041 –0.022
(0.126)
–0.007 –0.020
(0.126) –0.007
Purchasing power 0.006
(0.014)
0.011 0.017
(0.018)
0.032 0.022
(0.019) 0.041
Number of depressive symptoms 0.042
(0.011)
0.109*** 0.035
(0.011)
0.091**
Gender –0.148
(0.077)
–0.063 –0.154
(0.084) –0.066
Age 0.002
(0.005)
0.012 0.000
(0.005) 0.002
Marital dummy –0.065
(0.084)
–0.028 –0.057
(0.085) –0.024
Living alone –0.237
(0.011)
–0.075 –0.208
(0.110) –0.066
Intake of medicines 1.062
(0.087)
0.365*** 1.029
(0.087)
0.353***
Height 0.003
(0.005)
0.028 0.003
(0.005) 0.026
Smoking –0.021
(0.052) –0.013
Physical activity –0.274
(0.076)
–0.108***
Health insurance 0.012
(0.068) 0.005
Adjusted R2 0.005 0.019 0.173 0.181
Standard errors in the parentheses *p<0.05
adulthood had a signifi cant positive impact on depres-sion. Education had a weak effect on depression, which was no longer seen after controlling. The only SES in-dicator that had a signifi cant negative effect on depres-sion was purchasing power. Age, physical activity and smoking had a negative impact on depression. Women reported fewer depressive symptoms than men.
DISCUSSION
Except for morbidity, at least one indicator of SES had a signifi cant effect on other three health indicators (self-rated health, memory capacity and depression). The lack of SES effect on morbidity can be explained by the study sample, which comprised elderly people in
Table 3. Multivariate models predicting memory capacity of the elderly. São Paulo, southeastern Brazil, 2000.
Variable Model 1 Model 2 Model 3 Model 4
b β b β b β b β
Self-evaluation of SES during childhood
0.042 (0.094)
0.011 –0.088
(0.089)
–0.023 –0.037
(0.098)
–0.011 –0.026
(0.098)
–0.008
Self-evaluation of health during childhood
–0.217 (0.122)
–0.045 –0.093
(0.115)
–0.019 –0.111
(0.127)
–0.027 –0.101
(0.127)
–0.024
Number of diseases under the age of 15
0.184 (0.125)
0.037 0.093
(0.117)
0.018 0.140
(0.129)
0.032 0.133
(0.129)
0.031
Had to remain in bed at home due to a health condition under the age of 15
0.129 (0.258)
0.012 0.065
(0.244)
0.006 –0.237
(0.272)
–0.026 –0.233
(0.273)
–0.025
Education 0.244
(0.023)
0.276*** 0.173
(0.026)
0.229** 0.167
(0.026)
0.221**
Low occupation –0.439
(0.221)
–0.068** 0.015
(0.242)
0.003 0.006
(0.242)
–0.001
Medium occupation –0.581
(0.255)
–0.075** 0.090
(0.282)
0.013 0.068
(0.281)
0.010
Purchasing power 0.247
(0.033)
0.187*** 0.145
(0.040)
0.124*** 0.127
(0.042)
0.109**
Number of present diseases –0.038
(0.071)
0.017 –0.023
(0.071)
–0.011
Number of depressive symptoms –0.067
(0.025)
–0.080** –0.056
(0.026)
–0.068**
Gender –0.140
(0.171)
–0.027 –0.037
(0.128)
–0.007
Age –0.047
(0.010)
–0.144** –0.047
(0.011)
–0.144**
Marital dummy 0.355
(0.188)
0.070 0.314
(0.189)
0.062
Living alone 0.368
(0.245)
0.053 0.294
(0.247)
0.043
Intake of medicines 0.004
(0.208)
0.001 0.002
(0.208)
0.000
Height 0.037
(0.012)
0.139** 0.038
(0.012)
0.143**
Smoking 0.140
(0.116)
0.040
Physical activity 0.307
(0.171)
0.056
Health insurance 0.133
(0.152)
0.028
Adjusted R2 0.001 0.140 0.142 0.144
Standard errors in the parentheses * p<0.05
whom the majority of diseases are related to the aging process. Thus, these diseases could not be prevented or postponed even if these people would have knowledge gained through education.
Those subjects who rated their health during their childhood as poor now rate it positively. This may be due to the many health problems suffered in the past, that nowadays, with the new generation of medicines and vaccination available, they can better manage their health. Thus, they tend to positively rate their current health. To verify this assumption, an ANOVA was performed to test these differences, but it was not statistically signifi cant. With regard to other health measures, there were no variables available to verify this association.
The association between education and memory ca-pacity is possible to be explained in the sense that it is expected that those older adults with more educational resources (formal knowledge) should be those who exercise more their memory functions.
The impact of purchasing power on memory capacity can be understood in the extent to which those older adults who have more access to certain types of goods, like those related to communication and media resourc-es, can have more chance to exercise their memory. The effect of high status occupation on memory capac-ity is explained by the fact that high status occupations are those that involve more intellectual challenges than the low status occupations, these last involve more manual activities.
One explanation to the positive and signifi cant impact of childhood health on adult depression could be that the severity of childhood health problems are more important than the absolute number of conditions on mental health status later in life. The negative impact of smoking on depression can be related to the fact that nicotine has a stimulating effect on mood.
The impact of number of diseases during childhood on adult depression happens because many diseases can cause limitations and dependency. Unfortunately the information about disability could not be used in this study due to excessive number of missing cases. The fact that only purchasing power has an impact on depression can be explained by the huge inequality of Brazilian society and, as mentioned before, low social mobility. Thus, Brazilians tend to value the ownership of certain goods, not only as a way to have access to a variety of resources and social position but also to be socially recognized and accepted.3
The present study has potentially important implications as it shows health cannot be approached as a unique homogeneous concept and can provide information for developing social policies. Also, it confi rms that SES and childhood events are important to explain elderly
health problems. This emphasizes the importance of preventive policies not only for older adults but also for early ages.
Other strength of the study is the use of a life course per-spective in a developing country context, even though there was no longitudinal data available. It is possible to argue that taking childhood characteristics into account provided information about subject’s life course. Some health indicators in adult later life may be the outcome of a variety of childhood conditions and experiences.12
By using those retrospective questions was possible, at some extent, to compensate for the fact there was no longitudinal data to use a life course perspective. However, the present study has some limitations. First, it was not possible to check whether the impact of SES on health varies by age group as there were not enough cases in each group to perform individual analysis. Sec-ond, income was not used in the study due to the exces-sive number of missing cases. Third, as aforementioned, data were gathered at one point in time and therefore it was not possible to conclude that SES causes health problems in late life. However, other studies10,15 have
not shown evidence of reverse causality, that is, that poor health conditions lead to low SES. Another inter-pretation problem of cross-sectional studies is survival bias. It is expected that subjects with poor childhood SES have lower survival rates. However, it is possible that low social mobility in Brazil tends to attenuate the differences between those who survived.
A fourth limitation arises from the fact that data were based solely from self-reports and childhood events using retrospective questions. However, it is believed that whenever people are informed by their doctor they have a health problem it means a real and serious health problem. There is controversy in the literature over the reliability and validity of retrospective reports of health events. There is clearly no way to deal with this issue given the data available in the present study.
Another limitation is the external validity. This sample is representative of a major Brazilian city and a destina-tion of migrants from other parts of the country but it cannot be assured these results can be generalized to the whole country.
1. Beckett M. Converging health inequalities in later-life: An artifact of mortality selection. J Health Soc Behav. 2000;41(1):106-19.
2. Berkman CS, Gurland BJ. The relationship among income, other socioeconomic indicators, and functional level in older persons. J Aging Health. 1998;10(1):81-98.
3. Bourdieu P. O Poder Simbólico. Rio de Janeiro: Bertrand Brasil; 1989.
4. Elder Jr GH. Children of the Great Depression: Social change in life experience. Boulder: Westview Press; 1999.
5. Elo IT, Preston SH. Educational differentials in mortality: United States, 1979-85. Soc Sci Med. 1996;42(1):47-57.
6. Feinstein JS. The relationship between socioeconomic status and health: a review of the literature. Milbank Q. 1993;71(2):279-322.
7. Ferraro KF, Farmer MM, Wybraniec JA. Health trajectories: long-term dynamics among black and white adults. J Health Soc Behav. 1997;38(1):38-54.
8. Folstein MF, Folstein S, McHugh PR. “Mini-Mental State.” A practical method for grading the cognitive state of patients for the clinician. J Psychiatr Res. 1975;12(3):189-98.
9. Gilman SE, Kawachi I, Fitzmaurice GM, Buka SL. Socioeconomic status in childhood and the lifetime risk of major depression. Int J Epidemiol. 2002;31(2):359-67.
10. Hemingway H, Nicholson A, Marmot M. The Impact of socioeconomic status on health functioning as assessed by the SF-36 questionnaire: the Whitehall II study. Am J Public Health. 1997;87(9):1484-90.
11. House JS, Kessler RC, Herzog A, Mero RP, Kinney AM, Breslow MJ. Age, socioeconomic status and health. Milbank Q. 1990;68(3):383-411.
12. House JS, Lepkowski JM, Kinney AM, Mero RP, Kessler RC, Herzog AR. The social stratifi cation of aging and health. J Health Soc Behav. 1994;35(3):213-34.
13. Kawachi I, Kennedy BP, Lochner K, Prothrow-Stith D. Social capital, income inequality, and mortality. Am J Public Health. 1997;87(9):1491-8.
14. Kuh D, Ben-Shlomo Y, editores. A lifecourse course approach to chronic disease epidemiology. 2.ed.
Oxford: Oxford University Press; 2003.
15. Lima-Costa MF, Barreto SM, Firmo JO, Uchoa E. Socioeconomic position and health in a population of Brazilian elderly: The Bambuí Health And Ageing Study (BHAS). Rev Panam Salud Publica. 2003;13(6):387-94.
16. Luo Y, Wen M. Can we afford better health? A study of the health differentials in China. Health (London). 2002;6(4):471-500.
17. Lynch JW, Kaplan GA, Shema SJ. Cumulative impact of sustained economic hardship on physical, cognitive, psychological, and social functioning. N Engl J Med. 1997;337(26):1889-95.
18. Marmot M, Shipley M, Brunner E, Hemingway H. Relative contribution of early life and adult socioeconomic factors to adult morbidity in the Whitehall II Study. J Epidemiol Community Health. 2001;55(5):301-7.
19. Preston SH, Elo IT. Are educational differentials in adult mortality increasing in the United States? J Aging Health.1995;7(4):476-96.
20. Ross CE, Wu CL. Education, age, and the
cumulative advantage in health. J Health Soc Behav. 1996;37(1):104-20.
21. Scalon MC. Mobilidade social no Brasil: padrões e tendências. Rio de Janeiro: Revan; 1999.
22. Smith GD. Egger M. Commentary: Understanding it all – Health, meta-theories, and mortality trends. BMJ. 1996; 313(7072):1584-5.
23. Veras RP. País jovem com cabelos brancos: a saúde do idoso no Brasil. Rio de Janeiro: Relume Dumará; 1994.
24. Yesavage JA, Brink TL, Rose TL, Lum O, Huang V, Adey M, et al. Development and validation of a geriatric depression screening scale: a preliminary report. J Psychiatr Res. 1983;17(1):37-49.
25. Waitzman NJ, Smith KR. The effects of occupational class transitions on hypertension: racial disparities among working-age men. Am J Public Health. 1994;84(6):945-54.
26. Williams DR. Socioeconomic differentials in health: a review and redirection. Soc Psychol Q. 1990;53(2):81-99.
27. Wilmoth J. Living arrangements among older immigrants in the United States. Gerontologist. 2000;41(2):228-38.
REFERENCES
MP Ramos received a post-doctoral scholarship in the Vilmar Faria Program in Public Policies Analysis and Quantitative Methods, which was sponsored by Coordenação de Aperfeiçoamento de Pessoal de Nível Superior (Capes), Ford Foundation and University of Texas at Austin (Proc. n.º BEX 4360/05-2).