Measuring Quality of Maternal and Newborn
Care in Developing Countries Using
Demographic and Health Surveys
Zoe Dettrick, Hebe N. Gouda*, Andrew Hodge, Eliana Jimenez-Soto
The University of Queensland, School of Public Health, Public Health Building, Herston Road, Herston, Brisbane, Queensland, 4006, Australia
Abstract
Background
One of the greatest obstacles facing efforts to address quality of care in low and middle income countries is the absence of relevant and reliable data. This article proposes a meth-odology for creating a single“Quality Index”(QI) representing quality of maternal and neo-natal health care based upon data collected as part of the Demographic and Health Survey (DHS) program.
Methods
Using the 2012 Indonesian Demographic and Health Survey dataset, indicators of quality of care were identified based on the recommended guidelines outlined in the WHO Integrated Management of Pregnancy and Childbirth. Two sets of indicators were created; one set only including indicators available in the standard DHS questionnaire and the other includ-ing all indicators identified in the Indonesian dataset. For each indicator set composite indi-ces were created using Principal Components Analysis and a modified form of Equal Weighting. These indices were tested for internal coherence and robustness, as well as their comparability with each other. Finally a single QI was chosen to explore the variation in index scores across a number of known equity markers in Indonesia including wealth, urban rural status and geographical region.
Results
The process of creating quality indexes from standard DHS data was proven to be feasible, and initial results from Indonesia indicate particular disparities in the quality of care received by the poor as well as those living in outlying regions.
Conclusions
The QI represents an important step forward in efforts to understand, measure and improve quality of MNCH care in developing countries.
a11111
OPEN ACCESS
Citation:Dettrick Z, Gouda HN, Hodge A, Jimenez-Soto E (2016) Measuring Quality of Maternal and Newborn Care in Developing Countries Using Demographic and Health Surveys. PLoS ONE 11(6): e0157110. doi:10.1371/journal.pone.0157110
Editor:Marly Augusto Cardoso, University of São Paulo, BRAZIL
Received:March 7, 2016
Accepted:May 24, 2016
Published:June 30, 2016
Copyright:© 2016 Dettrick et al. This is an open access article distributed under the terms of the
Creative Commons Attribution License, which permits
unrestricted use, distribution, and reproduction in any medium, provided the original author and source are credited.
Data Availability Statement:All datasets used were obtained though the DHS program (http://www.
dhsprogram.com/) and are available free of cost for
research purposes. This study uses Indonesia: Standard DHS, 2012 individual recode file IDIR63DT. dta for the analysis.
Funding:This work was funded by an Australian Postgraduate Award scholarship administered through the University of Queensland, Australia.
Background
Poor quality of care is a major impediment to efforts aimed at improving the health of popu-lations in developing countries, particularly with respect to Maternal, Neonatal and Child
Health (MNCH) [1,2]. Most recently, poor quality of care has been implicated in the
disap-pointing outcomes of large scale programs aimed at increasing the coverage of maternal health services in developing countries including, the Janani Suraksha Yojana (JSY) condi-tional cash transfer program in India [3] and the Jamkesmas social insurance program in Indonesia [4]. It is suspected that while coverage of health services for these populations has increased, the quality of care provided is substandard[5]. Development of suitable measure-ment tools is necessary to support the improvemeasure-ments in quality of care and improve popula-tion health outcomes.
One of the greatest obstacles facing such efforts however is the current lack of data relating to quality, especially in low and middle income countries (LMICs) [6]. In the absence of fully functional health information systems, evidence on quality of care is scarce, and is often only available when specialised studies are conducted [7]. Additionally, there are multiple defini-tions of health care quality encompassing a multitude of dimensions ranging from efficacy and patient safety through to system efficiency and cultural appropriateness of care [8].There is as yet no international standard in how to measure quality of care, and as a result, differing defini-tions and choice in indicators limit comparability between studies [7].
The existing measures of quality of maternal care are typically focused on high level facility based care with caesarean and episiotomy rates [9], maternal near miss events [10], and mater-nal mortality commonly reported. Even fewer measures of quality of care exist for neonates, and the few that are commonly reported also emphasise tertiary level care. Consequently, exist-ing measures tend to exclude women who deliver at home or in smaller clinics; in many devel-oping contexts this can represent the majority of the population. The availability of data may also be hindered by the existence of largely unregulated private sectors that provide a high
pro-portion of maternal and neonatal health services [11–14].
Given this situation, there has been interest in the use of surveys to collect information on
people’s experiences of MNCH services. The collection of detailed population level data
relat-ing to multiple dimension of quality of care, such as provider actions and patient satisfaction,
has been conducted using specially constructed surveys over small populations [15–18], but at
the same time the availability of quality related measures in large scale population surveys has been limited. Attempts to use such surveys to report population level indicators of quality have been almost solely based on the basic coverage of antenatal care as reported by country level
Demographic and Health Surveys (DHS) [19–21]. There is potential to increase the number of
quality related indicators included in such surveys [22,23], and more recent surveys do collect
additional data related to care during and after delivery, but as of yet few studies have utilised these indicators within the context of examining quality of care.
This article proposes a methodology for creating a single“Quality Index”(QI) representing
Methods
Ethics approval and consent to participate
This research used pre-anonymized quantitative datasets, for which ethical approval was given at the time of data collection. The data was collected with the intention of being used for future research, and only quantitative responses to pre-approved questions are recorded in the dataset.
Data sources
With the introduction of the Phase 6 DHS questionnaire in 2008, several additional variables related to the timing and content of particular actions during pregnancy and in the immediate postnatal period were included in the survey design. These questions were asked with regards to the last pregnancy experienced by all women with a live birth in the past five years, providing an opportunity to measure indicators associated with the quality of routine pregnancy and delivery care. The Indonesia 2012 dataset was chosen as it represents a large Phase 6 survey that included a number of questions relating to the content and timing pregnancy and delivery care. Comparison of measures derived from the standard DHS questions and those derived from all available questions would thus provide a test of the adequacy of the existing DHS ques-tions in creating indicators of quality care.
Selection of indicators
The Donabedian conceptual framework considers“quality”as the combination of structural
elements (affecting the context in which care is delivered), process elements (all the actions that make up health care) and outcome elements (the effects of healthcare on the population) [25]. However, as standard DHS do not contain questions related to patient satisfaction, or to health inputs or outcomes, the definition of quality to be used for this analysis by necessity must be based on process indicators representing actions taken during contact with the health services in question. As a result, indicators were identified based on the recommended actions
outlined in the WHO’s Integrated Management of Pregnancy and Childbirth (IMPAC)
guide-lines [26]. These guideguide-lines are designed to outline essential practices by front line workers that address key areas of maternal and perinatal health programs. As such, they provide an objec-tive, albeit heavily service oriented, framework on which to base indicator selection.
Based on these guidelines both the standard DHS questionnaire and the Indonesia 2012 questionnaire were examined for the presence of questions that could be used to construct
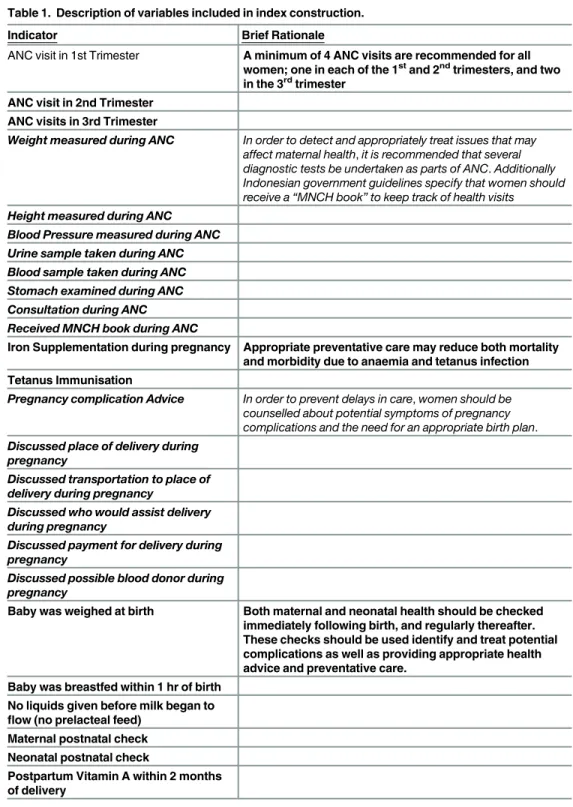
rele-vant indicators of quality care.Table 1shows the final set of indicators chosen for this analysis:
a full list of all the potential indicators identified, including those not available in the Indonesia
2012 dataset are provided inS1 Filewith a rationale for each indicator’s use.
Data preparation
The sample was first limited to women of reproductive age with at least one live birth in the past five years. Due to difficulties in reconciling different populations at risk, childhood health-care was omitted from the analysis, and the unit of observation was the mother and her last-born child (the postnatal experience of the child was considered as a continuation of the
mother’s experience during pregnancy and birth). Where possible, indicators were transformed
into binary variables taking a value of either 0 (not present) or 1 (present). Observations with missing data for any of the indicators were excluded from the analysis, however in order to minimise the impact of missing observations, particularly from under-sampled areas, the fol-lowing assumptions were made prior to data being dropped: Firstly, for variables related to yes/
assumption does potentially increase the risk of recall bias affecting the sample, and creates a more conservative estimate, however unless there is a large proportion of cases where this response is prevalent it is unlikely to have a major effect on the overall validity of the sample. Secondly, for indicators where a quantitative value such as timing or quantity of service
pro-vided is missing or coded as“don’t know”, but other variables indicate that the service did
occur, the observation was given the sample mean value of the quantitative variable. This approach Table 1. Description of variables included in index construction.
Indicator Brief Rationale
ANC visit in 1st Trimester A minimum of 4 ANC visits are recommended for all women; one in each of the 1stand 2ndtrimesters, and two in the 3rdtrimester
ANC visit in 2nd Trimester
ANC visits in 3rd Trimester
Weight measured during ANC In order to detect and appropriately treat issues that may affect maternal health,it is recommended that several diagnostic tests be undertaken as parts of ANC.Additionally Indonesian government guidelines specify that women should receive a“MNCH book”to keep track of health visits
Height measured during ANC
Blood Pressure measured during ANC
Urine sample taken during ANC Blood sample taken during ANC
Stomach examined during ANC
Consultation during ANC
Received MNCH book during ANC
Iron Supplementation during pregnancy Appropriate preventative care may reduce both mortality and morbidity due to anaemia and tetanus infection Tetanus Immunisation
Pregnancy complication Advice In order to prevent delays in care,women should be counselled about potential symptoms of pregnancy complications and the need for an appropriate birth plan.
Discussed place of delivery during pregnancy
Discussed transportation to place of delivery during pregnancy
Discussed who would assist delivery during pregnancy
Discussed payment for delivery during pregnancy
Discussed possible blood donor during pregnancy
Baby was weighed at birth Both maternal and neonatal health should be checked immediately following birth, and regularly thereafter. These checks should be used identify and treat potential complications as well as providing appropriate health advice and preventative care.
Baby was breastfed within 1 hr of birth
No liquids given before milk began to flow (no prelacteal feed)
Maternal postnatal check
Neonatal postnatal check
Postpartum Vitamin A within 2 months of delivery
is less likely to exclude observations for which recall bias hinders accurate quantification and is unlikely to be problematic unless a large proportion of observations are missing in this data.
Index construction
One of the most important considerations in the construction of any composite index is the use of indicator weights to determine the final score.
The simplest option is to apply equal weighting, where all indicators contribute equally to
the index and the final score is a simple average of all indicators. For example, the“Skilled
Attendance Index”proposed by Hussein and colleagues [27] consisted of a score representing
the simple percentage of 43 predetermined criteria met by that delivery (based on facility rec-ords). However this example also demonstrates one of the major limitations of equal weighting, as using equal weighting the provision of routine oxytocics contributed the same amount to the index as recording whether or not the patient started labour.
Another method of deriving weights is through the use of a statistical analysis of the dataset
itself. The most commonly used technique is Principal Components Analysis (PCA)—a
multi-variate statistical technique that uses the correlation between multiple variables to determine the presence of coherent subsets of variables that may collectively represent an underlying fac-tor (such as household wealth or social development) that cannot be directly measured [28].
These underlying factors, or“components”, are ordered such that the first component explains
the largest possible amount of variation in the sample, the second (uncorrelated) components explaining additional variation, and with further components explaining progressively less and less variation. Examples of indexes using PCA derived weights include the Wealth Index [29] and the Indices of Social Development [30].
The most direct method of creating weights from the results of PCA is to assume that the first component corresponds to the underlying process that the index is attempting to measure
[31,32].
An index is then created by calculating a score for each observation consisting of the sum of the variable values multiplied by the calculated weight. The index produced by this method will
be a relative one–as the index is based on the unique properties of the dataset itself, the
result-ing scores are not comparable between datasets. Likewise, it is possible that the principal
com-ponents may vary between subgroups within the dataset–rural populations may have a
different asset profile to those in urban areas. PCA derived indexes may therefore be of limited use in producing cross country comparisons, but are well suited for examining within country differences. In contrast the use of equal or theoretically derived weights provides a clearly understood measure that can be compared over different datasets; however the index will not be sensitive to changes in the relative importance of different variables in different contexts.
For this reason two methods of indicator weighting were chosen for use in this analysis–one
based on PCA derived weights, and a second based on a modified version of equal weighting. The Equal Weight (EW) indices use a slight modification to equal weighting, similar to the theoretical component method used by the Human Development Index [30]. All original indi-cators carried equal weight in the final index; however indiindi-cators that did not take a binary form (that is, indicators where multiple levels of quality may exist) were treated as if made up of equally weighted subcomponents. This allowed for some level of discrimination between dif-ferent levels of coverage for given indicators, while keeping to the equal weighting principle.
Testing of indices
methodologies. Additional indices were then created to determine if the number of categories for non-binary indicators, or the presence of absence of particular indicators, affected the robustness of the results. The indices were tested for internal coherence and robustness, as well as their comparability with each other, using the example set by Pritcher and Filmer [31]with
regards to the development of the wealth index. In addition, Cronbach’s alpha was calculated
as a measure of internal consistency for each set of indicators, with a coefficient of 0.7 or above considered to be acceptable[33]. Finally, a single QI was chosen to explore the variation in index scores across a number of known equity markers in Indonesia, including wealth, urban rural status and geographical region.
Results
The 2012 Indonesia DHS originally provided a sample size of 15,262 women who had had at least one live birth in the five years prior to the survey. Following the initial construction of the indicator variables and the application of the stated imputation processes to deal with missing
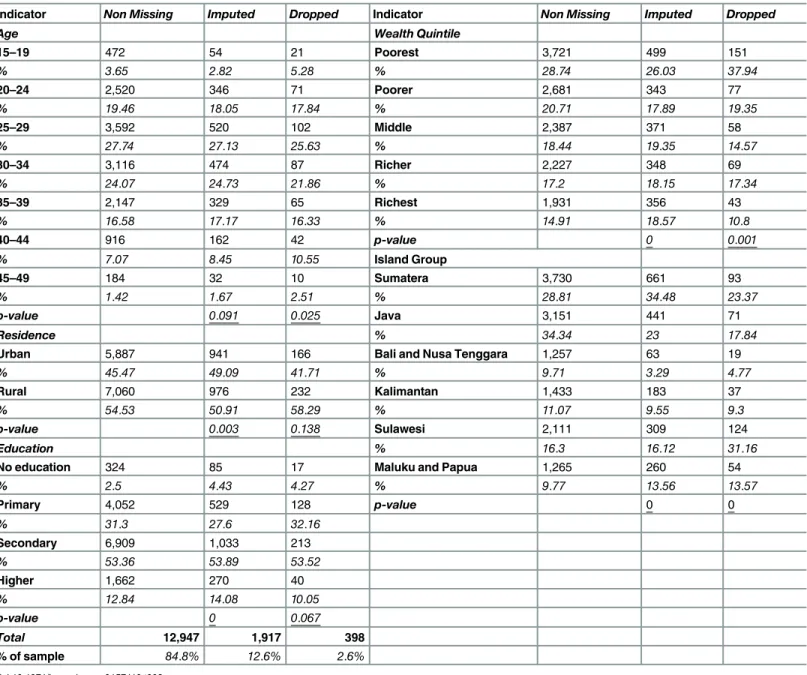
values, a total of 14,864 observations were included in the final analysis.Table 2provides a
breakdown of observations with no missing data, observations with at least one imputed vari-able and observations that were dropped due to missing data, by selected demographic factors. Two proportion z-tests were used to compare the imputed and missing observations to those with no missing data; there are no significant differences between the non-missing and dropped observations with the exception of wealth, with the dropped observations containing a higher proportion of observations from the poorest wealth quintile. In contrast, the imputed observations do appear to vary substantially from the non-missing observations with regards to urban rural residence, education and wealth. As these observations account for nearly 13% of the total sample, their omission from the remainder of the analysis might affect the represen-tative ability of the dataset as a whole. Following a sensitivity analysis (S2 File) a decision was made to include these observations in the remainder of the analysis.
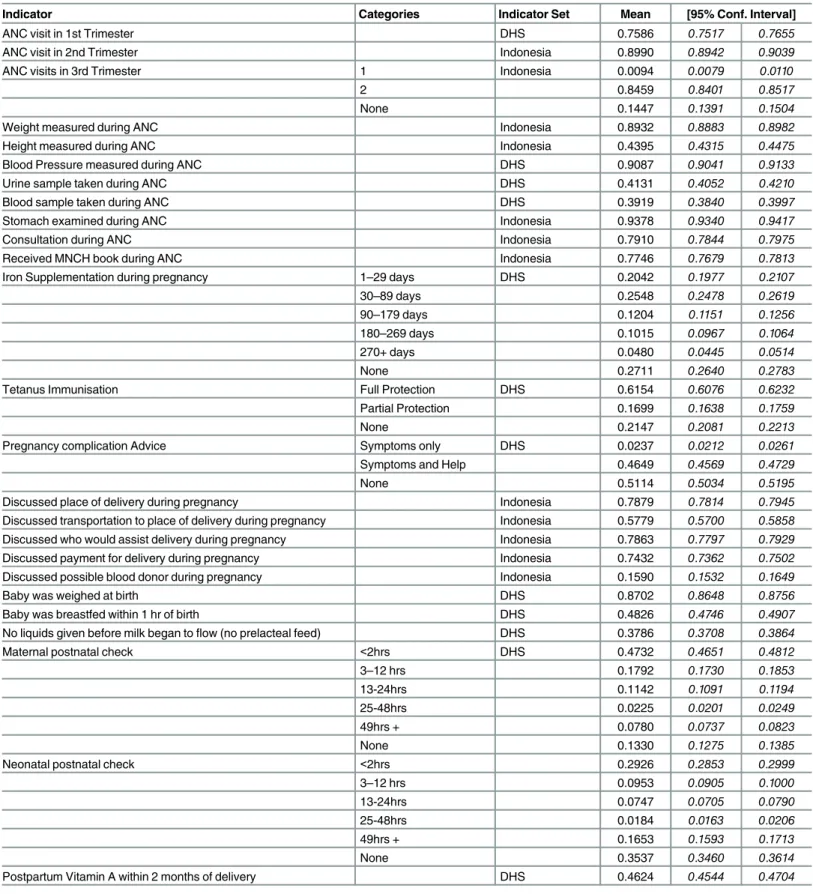
Table 3provides a full list of the initial categorisation used to create variables for index con-struction. The table also reports the mean and standard deviation of each variable. Coverage of different indicators varied substantially; some, such as stomach examination and blood pres-sure meapres-surement, were over 90%, while other such as discussion about blood donors were quite low. In general however coverage of the indicators was high enough to allow for meaning-ful differentiation between high and low levels of quality.
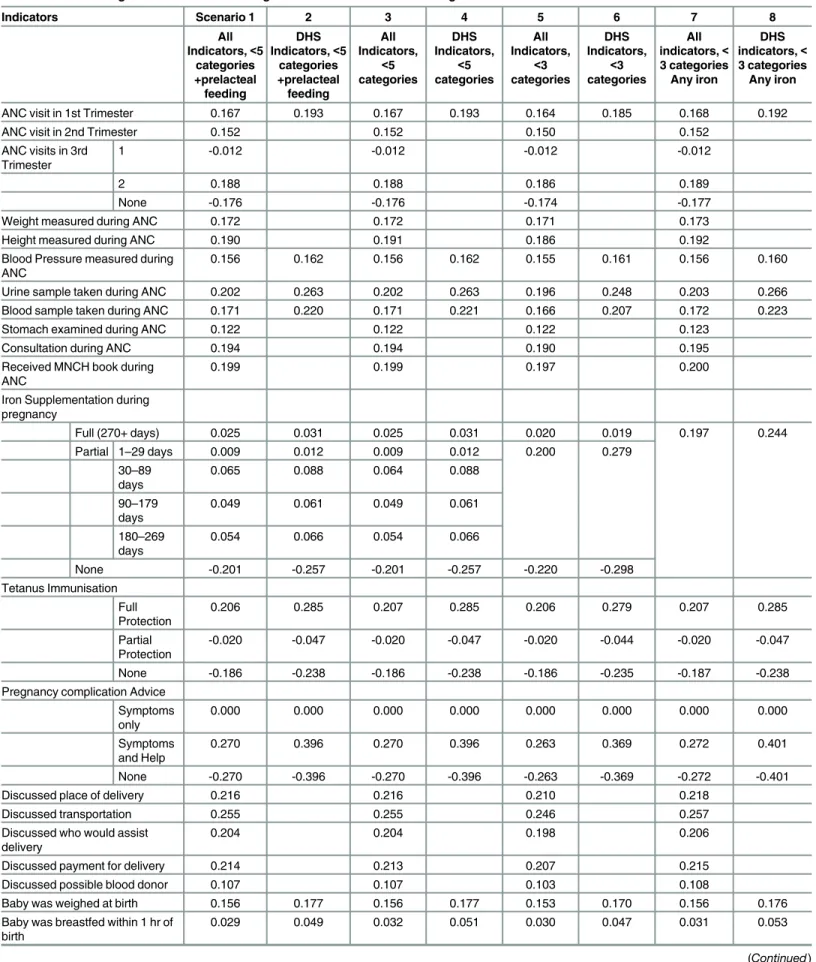
Table 4reports the PCA derived variable weights for a number of scenarios in which the included indicators, and the number of quality levels for each indicator, differ. In the initial scenario (column 1), all potential indicators were included and up to five categories of quality were available
for each indicator. The results are as expected–variables such as“No ANC visits in third trimester”
and“No Tetanus Protection”are strongly negative while their counterparts thought to represent a
high level of quality (“2+ ANC visits in third trimester”and“Full Tetanus Protection”) score quite
positively. Interestingly, the variables with the strongest effect on the final quality score are those related to interpersonal communication during pregnancy; advice on pregnancy complications scored particularly highly, as did discussion of transportation, place and payment for delivery. The results of the same PCA process carried out only on core DHS indicators is shown in column 2. The driving variables remain roughly the same, however the reduction in the number of variables has increased the magnitude of the weights assigned to the remaining indicators. Pregnancy com-plication advice remains the highest scored variable, but the influence of urine and blood tests dur-ing ANC and provision of timely postnatal care becomes more apparent.
and more urbanised populations [34].Columns 3 and 4 report the results of the previous sce-narios with the removal of prelacteal feeding as an indicator. There are no major changes in the weights assigned to other variables, and the overall proportion of variance explained by the first component increased only slightly, suggesting that the omission of this indicator did not overly affect the index.
Because it is possible that the number of categories used to define quality within a given indicator may affect overall representation of the indicator within the dataset, two additional scenarios were included, in which the levels of quality allowed for each indicator were limited
to“Full”,“Partial”and“None”(columns 5 and 6). The change in classification only affected
three indicators; iron supplementation during pregnancy, maternal PNC and neonatal PNC. For both PNC indicators the consolidation of the partial quality variables resulted in relatively
little effect–however while having no iron supplementation carries a strongly negative weight
Table 2. Distribution of observations with imputed or missing data.
Indicator Non Missing Imputed Dropped Indicator Non Missing Imputed Dropped
Age Wealth Quintile
15–19 472 54 21 Poorest 3,721 499 151
% 3.65 2.82 5.28 % 28.74 26.03 37.94
20–24 2,520 346 71 Poorer 2,681 343 77
% 19.46 18.05 17.84 % 20.71 17.89 19.35
25–29 3,592 520 102 Middle 2,387 371 58
% 27.74 27.13 25.63 % 18.44 19.35 14.57
30–34 3,116 474 87 Richer 2,227 348 69
% 24.07 24.73 21.86 % 17.2 18.15 17.34
35–39 2,147 329 65 Richest 1,931 356 43
% 16.58 17.17 16.33 % 14.91 18.57 10.8
40–44 916 162 42 p-value 0 0.001
% 7.07 8.45 10.55 Island Group
45–49 184 32 10 Sumatera 3,730 661 93
% 1.42 1.67 2.51 % 28.81 34.48 23.37
p-value 0.091 0.025 Java 3,151 441 71
Residence % 34.34 23 17.84
Urban 5,887 941 166 Bali and Nusa Tenggara 1,257 63 19
% 45.47 49.09 41.71 % 9.71 3.29 4.77
Rural 7,060 976 232 Kalimantan 1,433 183 37
% 54.53 50.91 58.29 % 11.07 9.55 9.3
p-value 0.003 0.138 Sulawesi 2,111 309 124
Education % 16.3 16.12 31.16
No education 324 85 17 Maluku and Papua 1,265 260 54
% 2.5 4.43 4.27 % 9.77 13.56 13.57
Primary 4,052 529 128 p-value 0 0
% 31.3 27.6 32.16
Secondary 6,909 1,033 213
% 53.36 53.89 53.52
Higher 1,662 270 40
% 12.84 14.08 10.05
p-value 0 0.067
Total 12,947 1,917 398
% of sample 84.8% 12.6% 2.6%
Table 3. Summary of Initial Indicator Categorisation and Means.
Indicator Categories Indicator Set Mean [95% Conf. Interval]
ANC visit in 1st Trimester DHS 0.7586 0.7517 0.7655
ANC visit in 2nd Trimester Indonesia 0.8990 0.8942 0.9039
ANC visits in 3rd Trimester 1 Indonesia 0.0094 0.0079 0.0110
2 0.8459 0.8401 0.8517
None 0.1447 0.1391 0.1504
Weight measured during ANC Indonesia 0.8932 0.8883 0.8982
Height measured during ANC Indonesia 0.4395 0.4315 0.4475
Blood Pressure measured during ANC DHS 0.9087 0.9041 0.9133
Urine sample taken during ANC DHS 0.4131 0.4052 0.4210
Blood sample taken during ANC DHS 0.3919 0.3840 0.3997
Stomach examined during ANC Indonesia 0.9378 0.9340 0.9417
Consultation during ANC Indonesia 0.7910 0.7844 0.7975
Received MNCH book during ANC Indonesia 0.7746 0.7679 0.7813
Iron Supplementation during pregnancy 1–29 days DHS 0.2042 0.1977 0.2107
30–89 days 0.2548 0.2478 0.2619
90–179 days 0.1204 0.1151 0.1256
180–269 days 0.1015 0.0967 0.1064
270+ days 0.0480 0.0445 0.0514
None 0.2711 0.2640 0.2783
Tetanus Immunisation Full Protection DHS 0.6154 0.6076 0.6232
Partial Protection 0.1699 0.1638 0.1759
None 0.2147 0.2081 0.2213
Pregnancy complication Advice Symptoms only DHS 0.0237 0.0212 0.0261
Symptoms and Help 0.4649 0.4569 0.4729
None 0.5114 0.5034 0.5195
Discussed place of delivery during pregnancy Indonesia 0.7879 0.7814 0.7945
Discussed transportation to place of delivery during pregnancy Indonesia 0.5779 0.5700 0.5858
Discussed who would assist delivery during pregnancy Indonesia 0.7863 0.7797 0.7929
Discussed payment for delivery during pregnancy Indonesia 0.7432 0.7362 0.7502
Discussed possible blood donor during pregnancy Indonesia 0.1590 0.1532 0.1649
Baby was weighed at birth DHS 0.8702 0.8648 0.8756
Baby was breastfed within 1 hr of birth DHS 0.4826 0.4746 0.4907
No liquids given before milk began toflow (no prelacteal feed) DHS 0.3786 0.3708 0.3864
Maternal postnatal check <2hrs DHS 0.4732 0.4651 0.4812
3–12 hrs 0.1792 0.1730 0.1853
13-24hrs 0.1142 0.1091 0.1194
25-48hrs 0.0225 0.0201 0.0249
49hrs + 0.0780 0.0737 0.0823
None 0.1330 0.1275 0.1385
Neonatal postnatal check <2hrs 0.2926 0.2853 0.2999
3–12 hrs 0.0953 0.0905 0.1000
13-24hrs 0.0747 0.0705 0.0790
25-48hrs 0.0184 0.0163 0.0206
49hrs + 0.1653 0.1593 0.1713
None 0.3537 0.3460 0.3614
Postpartum Vitamin A within 2 months of delivery DHS 0.4624 0.4544 0.4704
Table 4. Variable weights for PCA indexes using different indicator sets and categorisation.
Indicators Scenario 1 2 3 4 5 6 7 8
All Indicators,<5
categories +prelacteal feeding
DHS Indicators,<5
categories +prelacteal feeding All Indicators, <5 categories DHS Indicators, <5 categories All Indicators, <3 categories DHS Indicators, <3 categories All indicators,< 3 categories Any iron DHS indicators,< 3 categories Any iron
ANC visit in 1st Trimester 0.167 0.193 0.167 0.193 0.164 0.185 0.168 0.192
ANC visit in 2nd Trimester 0.152 0.152 0.150 0.152
ANC visits in 3rd Trimester
1 -0.012 -0.012 -0.012 -0.012
2 0.188 0.188 0.186 0.189
None -0.176 -0.176 -0.174 -0.177
Weight measured during ANC 0.172 0.172 0.171 0.173
Height measured during ANC 0.190 0.191 0.186 0.192
Blood Pressure measured during ANC
0.156 0.162 0.156 0.162 0.155 0.161 0.156 0.160
Urine sample taken during ANC 0.202 0.263 0.202 0.263 0.196 0.248 0.203 0.266
Blood sample taken during ANC 0.171 0.220 0.171 0.221 0.166 0.207 0.172 0.223
Stomach examined during ANC 0.122 0.122 0.122 0.123
Consultation during ANC 0.194 0.194 0.190 0.195
Received MNCH book during ANC
0.199 0.199 0.197 0.200
Iron Supplementation during pregnancy
Full (270+ days) 0.025 0.031 0.025 0.031 0.020 0.019 0.197 0.244
Partial 1–29 days 0.009 0.012 0.009 0.012 0.200 0.279
30–89 days
0.065 0.088 0.064 0.088
90–179 days
0.049 0.061 0.049 0.061
180–269 days
0.054 0.066 0.054 0.066
None -0.201 -0.257 -0.201 -0.257 -0.220 -0.298
Tetanus Immunisation Full Protection
0.206 0.285 0.207 0.285 0.206 0.279 0.207 0.285
Partial Protection
-0.020 -0.047 -0.020 -0.047 -0.020 -0.044 -0.020 -0.047
None -0.186 -0.238 -0.186 -0.238 -0.186 -0.235 -0.187 -0.238
Pregnancy complication Advice Symptoms only
0.000 0.000 0.000 0.000 0.000 0.000 0.000 0.000
Symptoms and Help
0.270 0.396 0.270 0.396 0.263 0.369 0.272 0.401
None -0.270 -0.396 -0.270 -0.396 -0.263 -0.369 -0.272 -0.401
Discussed place of delivery 0.216 0.216 0.210 0.218
Discussed transportation 0.255 0.255 0.246 0.257
Discussed who would assist delivery
0.204 0.204 0.198 0.206
Discussed payment for delivery 0.214 0.213 0.207 0.215
Discussed possible blood donor 0.107 0.107 0.103 0.108
Baby was weighed at birth 0.156 0.177 0.156 0.177 0.153 0.170 0.156 0.176
Baby was breastfed within 1 hr of birth
0.029 0.049 0.032 0.051 0.030 0.047 0.031 0.053
as expected,“partial”iron supplementation carries a much higher positive weight than“full” iron supplementation. As the magnitude of the partial and no supplementation variables is considerable, complete exclusion of this variable was inappropriate and might reduce the explanatory ability of the index.
As such, a scenario in which a replacement indicator representing the presence of iron sup-plementation rather than its duration was created. The results of this scenario can be seen in
last two columns inTable 4. Again, this change resulted in only minor increases in the variance
explained by the principal component. This consistency in weights and variance explained by the principal component was also seen during sensitivity testing involving the recreation of a
single QI (Scenario 5) using random subsamples of the dataset (seeS2 File). With regards to
internal consistency, only the DHS based index that included prelacteal feeding (in Column 2)
had an unacceptably low alpha coefficient. This is understandable as Cronbach’s alpha is
designed to reflect the degree to which the indicator set reflects a single, unidimensional con-struct and prelacteal feeding has already been identified as an outlier with regards to the other indicators. Overall these results suggest that the PCA based QIs were not overly sensitive to minor variation in the choice and classification of indicators; the greatest differences in results occurred as a result of the reduced number of variables in the standard DHS indicator set.
To test that this robustness extended also to indices created through the EW method, obser-vations were ranked according to their scores measured using the PCA and EW indices for the scenarios mentioned above and divided into quintiles. The mean value for each variable was
then compared according to each index; as an example,Table 5shows the mean value for each
Table 4.(Continued)
Indicators Scenario 1 2 3 4 5 6 7 8
All Indicators,<5
categories +prelacteal feeding
DHS Indicators,<5
categories +prelacteal feeding All Indicators, <5 categories DHS Indicators, <5 categories All Indicators, <3 categories DHS Indicators, <3 categories All indicators,< 3 categories Any iron DHS indicators,< 3 categories Any iron
No liquids given before milk began toflow
-0.023 -0.010
Maternal postnatal check
Full (<2hrs) 0.147 0.218 0.147 0.218 0.140 0.205 0.146 0.233
Partial 3–12 hrs 0.025 0.011 0.024 0.011 0.009 -0.028 0.005 -0.051
13-24hrs -0.005 -0.018 -0.005 -0.018
25-48hrs -0.004 -0.007 -0.004 -0.007
49hrs + -0.012 -0.020 -0.012 -0.020
None -0.151 -0.184 -0.151 -0.184 -0.148 -0.177 -0.151 -0.182
Neonatal postnatal check
Full (<2hrs) 0.140 0.215 0.140 0.215 0.133 0.199 0.137 0.219
Partial 3–12 hrs 0.018 0.017 0.018 0.017 0.045 0.054 0.044 0.042
13-24hrs 0.007 0.005 0.007 0.005
25-48hrs 0.001 0.002 0.001 0.002
49hrs + 0.011 0.017 0.012 0.017
None -0.178 -0.256 -0.178 -0.256 -0.179 -0.252 -0.181 -0.261
Postpartum Vitamin A 0.155 0.233 0.155 0.233 0.154 0.225 0.156 0.235
Rho 0.1752 0.1589 0.1814 0.1669 0.2017 0.1969 0.2035 0.1978
Cronbach’s
α
0.8359 0.6877 0.8411 0.7020 0.8578 0.7369 0.8534 0.7248
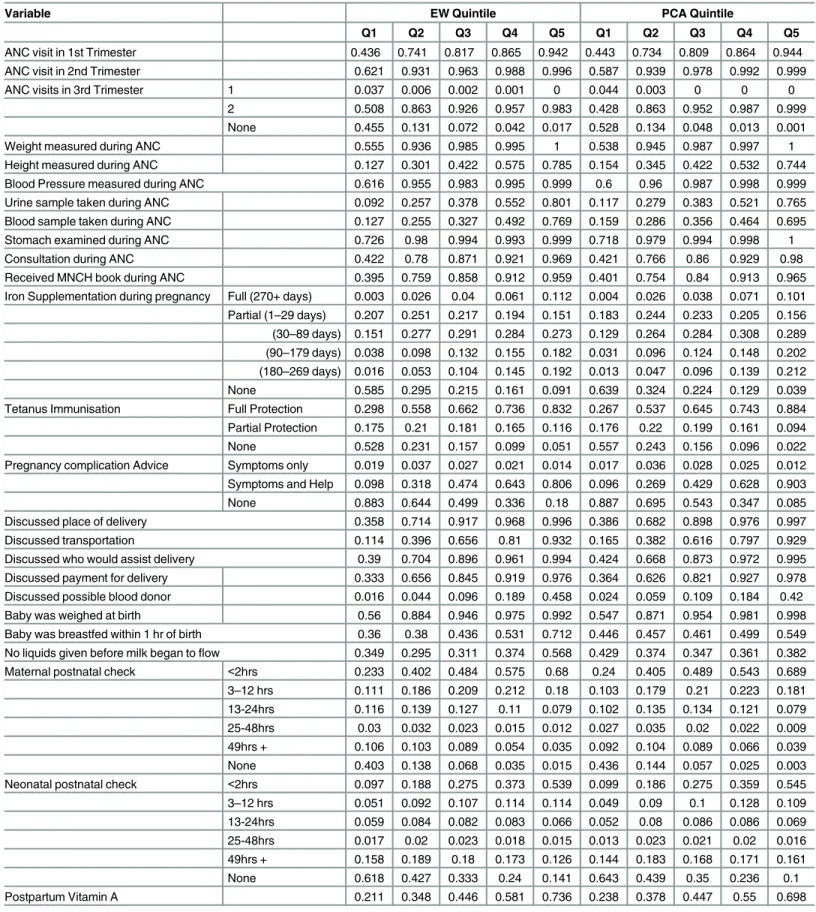
Table 5. Indicator Means by Quality Index based Quintiles (Scenario 1).
Variable EW Quintile PCA Quintile
Q1 Q2 Q3 Q4 Q5 Q1 Q2 Q3 Q4 Q5
ANC visit in 1st Trimester 0.436 0.741 0.817 0.865 0.942 0.443 0.734 0.809 0.864 0.944
ANC visit in 2nd Trimester 0.621 0.931 0.963 0.988 0.996 0.587 0.939 0.978 0.992 0.999
ANC visits in 3rd Trimester 1 0.037 0.006 0.002 0.001 0 0.044 0.003 0 0 0
2 0.508 0.863 0.926 0.957 0.983 0.428 0.863 0.952 0.987 0.999
None 0.455 0.131 0.072 0.042 0.017 0.528 0.134 0.048 0.013 0.001
Weight measured during ANC 0.555 0.936 0.985 0.995 1 0.538 0.945 0.987 0.997 1
Height measured during ANC 0.127 0.301 0.422 0.575 0.785 0.154 0.345 0.422 0.532 0.744
Blood Pressure measured during ANC 0.616 0.955 0.983 0.995 0.999 0.6 0.96 0.987 0.998 0.999 Urine sample taken during ANC 0.092 0.257 0.378 0.552 0.801 0.117 0.279 0.383 0.521 0.765 Blood sample taken during ANC 0.127 0.255 0.327 0.492 0.769 0.159 0.286 0.356 0.464 0.695
Stomach examined during ANC 0.726 0.98 0.994 0.993 0.999 0.718 0.979 0.994 0.998 1
Consultation during ANC 0.422 0.78 0.871 0.921 0.969 0.421 0.766 0.86 0.929 0.98
Received MNCH book during ANC 0.395 0.759 0.858 0.912 0.959 0.401 0.754 0.84 0.913 0.965
Iron Supplementation during pregnancy Full (270+ days) 0.003 0.026 0.04 0.061 0.112 0.004 0.026 0.038 0.071 0.101 Partial (1–29 days) 0.207 0.251 0.217 0.194 0.151 0.183 0.244 0.233 0.205 0.156 (30–89 days) 0.151 0.277 0.291 0.284 0.273 0.129 0.264 0.284 0.308 0.289 (90–179 days) 0.038 0.098 0.132 0.155 0.182 0.031 0.096 0.124 0.148 0.202 (180–269 days) 0.016 0.053 0.104 0.145 0.192 0.013 0.047 0.096 0.139 0.212 None 0.585 0.295 0.215 0.161 0.091 0.639 0.324 0.224 0.129 0.039 Tetanus Immunisation Full Protection 0.298 0.558 0.662 0.736 0.832 0.267 0.537 0.645 0.743 0.884 Partial Protection 0.175 0.21 0.181 0.165 0.116 0.176 0.22 0.199 0.161 0.094 None 0.528 0.231 0.157 0.099 0.051 0.557 0.243 0.156 0.096 0.022 Pregnancy complication Advice Symptoms only 0.019 0.037 0.027 0.021 0.014 0.017 0.036 0.028 0.025 0.012 Symptoms and Help 0.098 0.318 0.474 0.643 0.806 0.096 0.269 0.429 0.628 0.903
None 0.883 0.644 0.499 0.336 0.18 0.887 0.695 0.543 0.347 0.085
Discussed place of delivery 0.358 0.714 0.917 0.968 0.996 0.386 0.682 0.898 0.976 0.997
Discussed transportation 0.114 0.396 0.656 0.81 0.932 0.165 0.382 0.616 0.797 0.929
Discussed who would assist delivery 0.39 0.704 0.896 0.961 0.994 0.424 0.668 0.873 0.972 0.995 Discussed payment for delivery 0.333 0.656 0.845 0.919 0.976 0.364 0.626 0.821 0.927 0.978 Discussed possible blood donor 0.016 0.044 0.096 0.189 0.458 0.024 0.059 0.109 0.184 0.42
Baby was weighed at birth 0.56 0.884 0.946 0.975 0.992 0.547 0.871 0.954 0.981 0.998
Baby was breastfed within 1 hr of birth 0.36 0.38 0.436 0.531 0.712 0.446 0.457 0.461 0.499 0.549 No liquids given before milk began toflow 0.349 0.295 0.311 0.374 0.568 0.429 0.374 0.347 0.361 0.382 Maternal postnatal check <2hrs 0.233 0.402 0.484 0.575 0.68 0.24 0.405 0.489 0.543 0.689
3–12 hrs 0.111 0.186 0.209 0.212 0.18 0.103 0.179 0.21 0.223 0.181 13-24hrs 0.116 0.139 0.127 0.11 0.079 0.102 0.135 0.134 0.121 0.079 25-48hrs 0.03 0.032 0.023 0.015 0.012 0.027 0.035 0.02 0.022 0.009 49hrs + 0.106 0.103 0.089 0.054 0.035 0.092 0.104 0.089 0.066 0.039 None 0.403 0.138 0.068 0.035 0.015 0.436 0.144 0.057 0.025 0.003 Neonatal postnatal check <2hrs 0.097 0.188 0.275 0.373 0.539 0.099 0.186 0.275 0.359 0.545 3–12 hrs 0.051 0.092 0.107 0.114 0.114 0.049 0.09 0.1 0.128 0.109 13-24hrs 0.059 0.084 0.082 0.083 0.066 0.052 0.08 0.086 0.086 0.069 25-48hrs 0.017 0.02 0.023 0.018 0.015 0.013 0.023 0.021 0.02 0.016 49hrs + 0.158 0.189 0.18 0.173 0.126 0.144 0.183 0.168 0.171 0.161
None 0.618 0.427 0.333 0.24 0.141 0.643 0.439 0.35 0.236 0.1
Postpartum Vitamin A 0.211 0.348 0.446 0.581 0.736 0.238 0.378 0.447 0.55 0.698
variable according the PCA and EW index quintiles for the first scenario. A full table of these
results is provided inS2 File. In general the results appear to be robust, with“positive”variables
such as blood testing during ANC having higher means in the higher quintiles and“negative”
variables such as no tetanus protection having higher means in the lower quintiles.Table 6
compares the correlation between quintiles created using QIs that utilise different indicator sets, categorisation and weighting methods. Despite the considerable variation in content the classification of observations into quintiles is relatively stable; even scenarios in which the underlying indicator set and weighting methodology differ have over 75% correlation. This suggests that the indices are reflecting differences in the underlying quality of care rather than differences in a subset of dominant indicators.
For the purpose of summarising differences in quality of care within Indonesia, a single QI was chosen. From a policy perspective, relative variation in quality of care is important in order to provide an overview of which groups are doing better or worse than their peers; for this rea-son the following sections utilise the PCA index based on all available indicators using
simpli-fied categorisation (Scenario 5 fromTable 4).
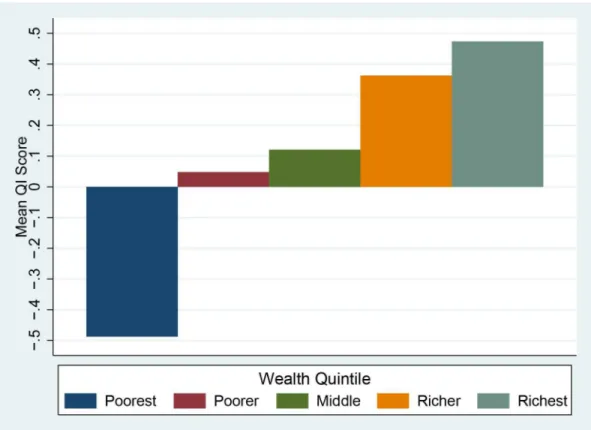
Urban areas have a substantially higher score compared to rural areas (Fig 1). Given that rural areas are known to have issues with access to services[35], it is likely that these areas may have issues with key inputs that limit the level of quality available to the population. Wealth
also appears to have an effect on quality–Fig 2shows the mean scores by wealth quintile.
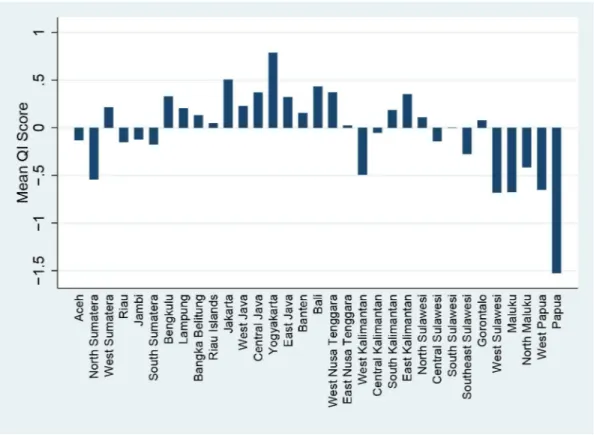
Indonesia is a large and diverse country, and health outcomes have been known to vary
sub-stantially between different geographic regions, and as seen inFig 3and quality of care is no
exception. The impressively high score in Yogyakarta is overwhelmed by the massively negative score seen in Papua and provinces in the Java/Bali region have relatively good scores while out-lying regions such as Sulawesi and Maluku are generally negative.
Examining these provincial scores by urban rural status makes the situation even clearer. Fig 4shows that in the provinces that are doing well there are only minor differences between rural and urban populations, while the rural population in these outlying regions appear to be receiving much worse care than their urban counterparts. As it is possible that this difference
in urban/rural outcomes is due to differences in wealth between the two populations,Fig 5
illustrates the mean quality score for each wealth index by region. Perhaps unsurprisingly, the provinces showing great differences between urban and rural populations also show large dif-ferentials between the poorest and wealthiest quintiles. It is interesting however that even the wealthiest quintile in remote regions do not score highly; conversely in high performing regions such as Yogyakarta even the poorest appear to be receiving a high level of care. Table 6. Correlation between quintiles using different Quality Indexes.
Quality Index A B C D E F G H I J
A All Indicators,<5 categories +prelacteal feeding, Equal Weighting 1 B DHS Indicators,<5 categories +prelacteal feeding, Equal Weighting 0.837 1 C All Indicators,<5 categories +prelacteal feeding, PCA Weighting 0.920 0.821 1
D DHS Indicators,<5 categories +prelacteal feeding, PCA Weighting 0.771 0.866 0.875 1
E All Indicators,<3 categories, Equal Weighting 0.888 0.795 0.864 0.754 1 F DHS Indicators,<3 categories, Equal Weighting 0.828 0.932 0.817 0.853 0.897 1 G All Indicators,<3 categories, PCA Weighting 0.863 0.787 0.902 0.832 0.974 0.885 1
H DHS Indicators,<3 categories, PCA Weighting 0.781 0.864 0.870 0.945 0.851 0.926 0.919 1
I All Indicators,<3 categories, Any Iron, PCA Weighting 0.933 0.823 0.972 0.855 0.871 0.818 0.898 0.853 1 J DHS Indicators,<3 categories, Any Iron, PCA Weighting 0.799 0.894 0.873 0.948 0.776 0.879 0.831 0.926 0.867 1
Discussion
This is the first study to utilise PCA based techniques to attempt to quantify variation in quality of care using DHS data. As one of the major assumptions of the PCA process is that the result-ing index is capturresult-ing an underlyresult-ing dimension of quality, it is heartenresult-ing that both equal weighting and PCA weighting techniques produced indexes that were internally consistent and robust to the inclusion or exclusion of individual indicators. Similarly, the similarities between the results of the country-specific and DHS indicator sets suggests that the process may create similarly robust results in other countries where only the standard set of DHS questions were included.
There is concern however that the current methodology creates an index that is more reflec-tive of access to care rather than the quality of care provided; a woman without access to health services might score the same as a woman with access to only very poor quality services. From a systemic perspective, lack of services may in fact an indicator of poor quality, but from a pol-icy perspective it is far more useful to quantify quality within the scope of those who do receive care in some form. The difficulty lies in defining who does and does not have access to care: should availability of services be considered or only usage? Should the types of services avail-able matter or is having access to any form of care enough? These are issues that should be addressed as the methodology is further refined.
Such refinement would be highly beneficial, as the use of a single composite index to allow the direct comparison of different population subgroups has allowed for greater understanding of the factors driving inequities in MNCH care. In particular, the differing patterns of quality scores seen between and within regions in Indonesia suggests that place of residence may have Fig 1. Quality Index score by Urban/Rural Status (National).
a greater influence on determining the quality of maternal and neonatal care than wealth or urban-rural status alone. This is perhaps unsurprising given the heavily decentralised nature of
Indonesia’s health system; significant regional variation has been noted for other health related
measures such as child mortality [36,37], and observational data suggest that the performance
of local health systems varies substantially from district to district. Countries with more highly centralised health systems would be expected demonstrate different patterns of variation. Importantly, as the questions used to construct the QI score are based around actions that should be undertaken as part of routine care by health providers, it is possible that these results may provide a mechanism through which poorly performing systems may be identified for pol-icy intervention. For example, the positive association between having over a month of iron supplementation and other quality markers, but lack of association with having over six months of iron supplementation, suggests that the continuity of supplementation is an area in need of further attention.
This does however reveal another limitation of the current methodology; without indicators related to the types of health messages provided by health staff, it is difficult to determine why existing practices are ineffective and thus design an appropriate health system intervention to address the problem. In terms of health education, advice about recognising pregnancy compli-cations during ANC is the sole indicator available as part of the standard DHS questionnaire, and while there was a very strong association between the QI and this indicator, as well as the Indonesia specific indicators relating to birth preparedness (discussion of which should occur as part of standard ANC) it remains unknown if other critical health messages communicated to the client. Given the acknowledged importance of interpersonal interaction with the health Fig 2. Quality Index score by Wealth Quintile (National).
provider in encouraging continuance of care, through health promotion and education as well
as patient satisfaction [38,39], future QI would benefit from questions addressing these issues.
Another limitation of the current indicators is the lack of coverage for routine interventions such as clean delivery, thermal management active management of third stage of. Similarly,
there is scant information relating to postnatal care–both in terms of content and timing of
fol-low up visits. As the major benefits of PNC come from the prompt identification of issues that
require additional care [40,41] this represents an area that should ideally be included in any
holistic measure of MNCH quality. Despite concerns regarding recall bias, questions relating
to these interventions have occasionally been included in individual countries’DHSs; for
exam-ple, Nepal 2011 [42] included a questions about oxytocin use during delivery, Philippines 2013 [43] included questions about the type of examinations given during maternal PNC and Ban-gladesh 2011 [44] included questions about cord care and temperature management (albeit only for home deliveries). Similarly, questions about advice and counselling for specific MNCH issues have been included in a number of other country surveys[45]. While there is need for a consensus as to the most appropriate indicators to be used, it does appear that such questions could feasibly be included as part of the standard DHS questionnaire.
One inherent issue with the use of standard DHS methodology however, is that it is reliant upon self-reporting for all variables related to pregnancy and childbirth, with a recall period of up to five years. In addition to the known variability of recall bias in general[46], validation stud-ies comparing self-reported coverage of MNCH indicators to either health care records [47] or direct observation [48]suggest that the sensitivity and specificity of self-reported coverage can vary substantially, both between indicators and between contexts. Care should thus be taken in Fig 3. Quality Index Score by Province.
interpreting the QI, especially with regards to the potential for social desirability and recall bias to affect self-reporting of actions taken during the antenatal, delivery and postpartum period.
Similarly, while provision of emergency obstetric care can have a large impact on both
maternal and neonatal mortality rates [49,50], survivorship bias precludes the DHS from
providing reliable measures relating to the treatment of potentially fatal conditions. Addition-ally, the variable weights produced by the PCA process do not reflect the relative importance of any given intervention in preventing death or disability. As a result, we can only consider the
QI to be a partial indicator of true quality of maternal and neonatal care–however given the
lack of regularly available measures in the existing literature even this imperfect measure may provide significant benefits to our understanding of quality of care in LMICs. Ideally, these findings will stimulate further research into the inclusion of a more diverse range of quality indicators in standard DHS based surveys. With further refinements, it is possible that the QI might be used to compare quality between countries, and provide an additional tool for researchers and policymakers to investigate of the effect of different health system elements on quality of care.
Conclusions
As demonstrated using the Indonesia 2012 DHS, the Quality Index provides a method through which data collected as part of routine DHS programs may be used to examine disparities in the quality of maternal and neonatal health care in LMICs. The resulting analysis can provide important insights into both the current state of quality of care and the potential avenues for health system intervention. In Indonesia, for example, the analysis noted particular disparities Fig 4. Quality Index Score by Province and Urban/Rural Status.
in the quality of care received by the poor as well as those living in outlying provinces. The QI thus represents an important step forward in efforts to understand and improve quality of MNCH care in developing countries. It allows policymakers and development partners to mea-sure, track progress and compare the quality of MNCH care across countries and within target populations.
Supporting Information
S1 File. Potential Indicators and Rationale for Use. (DOCX)
S2 File. Sensitivity Analyses. (DOCX)
Acknowledgments
The authors would like to thank the staff at the School of Public Health, University of Queensland.
Author Contributions
Conceived and designed the experiments: ZD EJ-S AH. Performed the experiments: ZD. Ana-lyzed the data: ZD HG. Contributed reagents/materials/analysis tools: ZD AH EJ-S. Wrote the paper: ZD HG EJ-S.
Fig 5. Quality Index Score by Province and Wealth Quintile.
References
1. Filippi V, Ronsmans C, Campbell OM, Graham WJ, Mills A, Borghi J, et al. Maternal health in poor countries: the broader context and a call for action. Lancet. 2006; 368(9546):1535–41. PMID:
17071287
2. Graham WJ, Varghese B. Quality, quality, quality: gaps in the continuum of care. The Lancet. 2012; 379(9811):e5–e6.
3. Lim SS, Dandona L, Hoisington JA, James SL, Hogan MC, Gakidou E. India's Janani Suraksha Yojana, a conditional cash transfer programme to increase births in health facilities: an impact evaluation. The Lancet. 2010; 375(9730):2009–23.
4. Harimurti P, Pambudi E, Pigazzini A, Tandon A. The Nuts & Bolts of Jamkesmas, Indonesia’s Govern-ment-Financed Health Coverage Program for the Poor and Near-Poor. Washington DC: World Bank, 2013.
5. Chaturvedi S, Randive B, Diwan V, De Costa A. Quality of obstetric referral services in India's JSY cash transfer programme for institutional births: A study from madhya pradesh province. PLoS ONE. 2014; 9 (5).
6. Dettrick Z, Firth S, Jimenez Soto E. Do Strategies to Improve Quality of Maternal and Child Health Care in Lower and Middle Income Countries Lead to Improved Outcomes? A Review of the Evidence. PLoS ONE. 2013; 8(12):e83070. doi:10.1371/journal.pone.0083070PMID:24349435
7. Raven JH, Tolhurst RJ, Tang S, van den Broek N. What is quality in maternal and neonatal health care? Midwifery. 2012; 28(5):e676–e83. doi:10.1016/j.midw.2011.09.003PMID:22018395
8. World Health Organization. Tracking universal health coverage: first global monitoring report. Geneva: 2015.
9. Kozhimannil KB, Hung P, Prasad S, Casey M, McClellan M, Moscovice IS. Birth Volume and the Qual-ity of Obstetric Care in Rural Hospitals. Journal of Rural Health. 2014.
10. Pileggi-Castro C, Camelo JS Jr, Perdoná GC, Mussi-Pinhata MM, Cecatti JG, Mori R, et al. Develop-ment of criteria for identifying neonatal near-miss cases: analysis of two WHO multicountry cross-sec-tional studies. BJOG: an internacross-sec-tional journal of obstetrics and gynaecology. 2014; 121 Suppl 1:110–8.
11. Basu S, Andrews J, Kishore S, Panjabi R, Stuckler D. Comparative performance of private and public healthcare systems in low- and middle-income countries: A systematic review. PLoS Medicine. 2012; 9 (6):19.
12. Das J, Hammer J. Quality of primary care in low-income countries: Facts and economics. Annual Review of Economics. 2014; 6:525–53.
13. James CD, Hanson K, Solon O, Whitty CJM, Peabody J. Do doctors under-provide, over-provide or do both? Exploring the quality of medical treatment in the Philippines. International Journal for Quality in Health Care. 2011; 23(4):445–55. doi:10.1093/intqhc/mzr029PMID:21672923
14. Victora CG, Matijasevich A, Silveira M, Santos I, Barros AJD, Barros FC. Socio-economic and ethnic group inequities in antenatal care quality in the public and private sector in Brazil. Health Policy & Plan-ning. 2010; 25(4):253–61.
15. Björkman M, Svensson J. Power to the people: Evidence from a randomized field experiment on com-munity-based monitoring in uganda. Quarterly Journal of Economics. 2009; 124(2):735–69.
16. Marchant T, Schellenberg J, Peterson S, Manzi F, Waiswa P, Hanson C, et al. The use of continuous surveys to generate and continuously report high quality timely maternal and newborn health data at the district level in Tanzania and Uganda. Implementation Science. 2014; 9(1):112.
17. Uzochukwu BSC, Onwujekwe OE, Akpala CO. Community satisfaction with the quality of maternal and child health services in southeast Nigeria. East African Medical Journal. 2004; 81(6):293–9. PMID:
16167676
18. van Duong D, Binns CW, Lee AH, Hipgrave DB. Measuring client-perceived quality of maternity ser-vices in rural Vietnam. International Journal for Quality in Health Care. 2004; 16(6):447–52. PMID:
15557354
19. Joshi C, Torvaldsen S, Hodgson R, Hayen A. Factors associated with the use and quality of antenatal care in Nepal: A population-based study using the demographic and health survey data. BMC Preg-nancy and Childbirth. 2014; 14(1).
20. Kyei NNA, Chansa C, Gabrysch S. Quality of antenatal care in Zambia: A national assessment. BMC Pregnancy and Childbirth. 2012; 12.
21. Mbuagbaw LCE, Gofin R. A new measurement for optimal antenatal care: Determinants and outcomes in Cameroon. Matern Child Health J. 2011; 15(8):1427–34. doi:10.1007/s10995-010-0707-3PMID:
22. Bryce J, Arnold F, Blanc A, Hancioglu A, Newby H, Requejo J, et al. Measuring Coverage in MNCH: New Findings, New Strategies, and Recommendations for Action. PLoS Medicine. 2013; 10(5).
23. Moran AC, Kerber K, Sitrin D, Guenther T, Morrissey CS, Newby H, et al. Measuring Coverage in MNCH: Indicators for Global Tracking of Newborn Care. PLoS Medicine. 2013; 10(5).
24. Statistics Indonesia (Badan Pusat Statistik—BPS), National Population and Family Planning Board (BKKBN), Kementerian Kesehatan (Kemenkes—MOH), ICF International. Indonesia Demographic and Health Survey 2012. Jakarta, Indonesia: Statistics Indonesia (Badan Pusat Statistik—BPS), National Population and Family Planning Board (BKKBN), Kementerian Kesehatan (Kemenkes—MOH), ICF International, 2013.
25. Donabedian A. Criteria and standards for quality assessment and monitoring. Quality Review Bulletin. 1986; 12(3):99–108. PMID:3085044
26. World Health Organization, United Nations Population Fund, UNICEF, The World Bank. Pregnancy, childbirth, postpartum and newborn care: A guide for essential practice. Geneva: World Health Organi-zation., 2006.
27. Hussein J, Bell J, Nazzar A, Abbey M, Adjei S, Graham W. The skilled attendance index: Proposal for a new measure of skilled attendance at delivery. Reproductive Health Matters. 2004; 12(24):160–70. PMID:15626206
28. Tabachnick BG, Fidell LS. Using multivariate statistics. 6th edition ed2013.
29. Rutstein SO, Johnson K. The DHS Wealth Index. Maryland, USA: MEASURE DHS+2004.
30. Foa R, Tanner JC. Methodology of the Social Development Indices The Hague: International Institute of Social Studies., 2012.
31. Filmer D, Pritchett LH. Estimating wealth effects without expenditure data—or tears: an application to educational enrollments in states of India. Demography. 2001; 38(1):115–32. PMID:11227840 32. Vyas S, Kumaranayake L. Constructing socio-economic status indices: how to use principal
compo-nents analysis. Health policy and planning. 2006; 21(6):459–68. PMID:17030551
33. Steiner DL, Norman GR. Health Measurement Scales—a practical guide to their development and use. Fourth Edition. Fourth Edition ed. New York: Oxford University Press; 2008.
34. Titaley CR, Loh PC, Prasetyo S, Ariawan I, Shankar AH. Socio-economic factors and use of maternal health services are associated with delayed initiation and non-exclusive breastfeeding in Indonesia: Secondary analysis of Indonesia Demographic and Health Surveys 2002/2003 and 2007. Asia Pacific Journal of Clinical Nutrition. 2014; 23(1):91–104. doi:10.6133/apjcn.2014.23.1.18PMID:24561977 35. Barber SL, Gertler PJ. Strategies that promote high quality care in Indonesia. Health Policy. 2008; 88
(2–3):339–47. doi:10.1016/j.healthpol.2008.04.003PMID:18501988
36. Hodge A, Firth S, Marthias T, Jimenez-Soto E. Location matters: Trends in inequalities in child mortality in Indonesia. Evidence from repeated cross-sectional surveys. PLoS ONE. 2014; 9(7).
37. Schroders J, Wall S, Kusnanto H, Ng N. Millennium development goal four and child health inequities in indonesia: a systematic review of the literature. PLoS ONE. 2015; 10: e0123629. doi:10.1371/journal. pone.0123629PMID:25942491
38. Fan VS, Burman MB, D FS. Continuity of care and other determinants of patient satisfaction with pri-mary care. Journal of General and Internal Medicine. 2005; 20:226–33.
39. Haggerty JL, Reid RJ, Freeman GK, Starfield BH, Adair CE, McKendry R. Continuity of care: a multidis-ciplinary review. BMJ. 2003; 327:1219–21. PMID:14630762
40. Lassi ZS, Haider BA, Bhutta ZA. Community-based intervention packages for reducing maternal and neonatal morbidity and mortality and improving neonatal outcomes. Cochrane database of systematic reviews (Online). 2010; 11.
41. Salam RA, Mansoor T, Mallick D, Lassi ZS, Das JK, Bhutta ZA. Essential childbirth and postnatal inter-ventions for improved maternal and neonatal health. Reproductive Health. 2014; 11.
42. Ministry of Health and Population (MOHP) [Nepal], New ERA, ICF International Inc. Nepal Demo-graphic and Health Survey 2011. Kathmandu, Nepal: Ministry of Health and Population, New ERA, ICF International, Calverton, Maryland, 2012.
43. Philippine Statistics Authority (PSA) [Philippines], International I. Philippines National Demographic and Health Survey 2013. Manila, Philippines and Rockville, Maryland, USA: PSA and ICF Interna-tional., 2014.
44. National Institute of Population Research and Training (NIPORT), Mitra and Associates, International I. Bangladesh Demographic and Health Survey 2011. Dhaka, Bangladesh and Calverton, Maryland USA: Mitra and Associates, and ICF International, 2013.
46. Das J, Hammer J, Sánchez-Paramo C. The impact of recall periods on reported morbidity and health seeking behavior. Journal of Development Economics. 2012; 98(1):76–88.
47. Liu L, Li M, Yang L, Ju L, Tan B, Walker N, et al. Measuring Coverage in MNCH: A Validation Study Linking Population Survey Derived Coverage to Maternal, Newborn, and Child Health Care Records in Rural China. PLoS ONE. 2013; 8(5):e60762. doi:10.1371/journal.pone.0060762PMID:23667429 48. Stanton CK, Rawlins B, Drake M, dos Anjos M, Cantor D, Chongo L, et al. Measuring Coverage in
MNCH: Testing the Validity of Women's Self-Report of Key Maternal and Newborn Health Interventions during the Peripartum Period in Mozambique. PLoS ONE. 2013; 8(5).
49. Lassi ZS, Kumar R, Mansoor T, Salam RA, Das JK, Bhutta ZA. Essential interventions: Implementation strategies and proposed packages of care. Reproductive Health. 2014; 11.