ISSN: 2067-533X
INTERNATIONAL JOURNAL
OFCONSERVATION SCIENCE
Volume 4, Issue 4, October-December 2013: 485-492 www. ijcs. uaic. ro
VEGETATION CHARACTERIZATION AND LITTER
PRODUCTION ON THE REHABILITATED
MINED AREA OF MUSSOORIE HILLS, INDIA
Archana JOSHI1*, Harsh Bardhan VASISTHA2, Madhuri DABRAL3
1 College of Natural and Computational Sciences, Haramaya University, Ethiopia 2 Ecology and Environment Division, Forest Research Institute, Dehradun, India
3 SHAPE, Haldukhata, Kotdwara, Uttarakhand, India
Abstract
The floristic diversity of four different age series in rehabilitated mined area which represents the degraded ecosystem was examined. Phytosociological analysis revealed that the highest number of plant species (38 nos.) including tree, shrubs, herbs and grasses were found in eight years old (Site II) rehabilitated site followed by eleven years old (Site I )and six years old (Site 3) (33 nos.) and least was in four years old Site IV (29 nos.). Maximum total basal area was represented by site I followed by site II, site III and site IV. With reference to annual litter production it was highest in Site I (5286 Kg/ha) followed by Site III (1193.2 Kg/ha), Site II (804.0 kg/ha) and least in Site IV (262.0 Kg/ha).
Keywords: Phytosociological analysis; Vegetational composition; litter production; mined area.
Introduction
Litter fall is a principal pathway for the return of nutrients to the soil and its deposition on the ground floor resides in the formation and renewal of forest floor, which helps in conservation of soil moisture and improves its physico-chemical properties. The transfer of matter and energy through litterfall maintains the integrity of an ecosystem. Litter which constitutes dead organic remains of forest vegetation, the carcasses of the herbivores and the predators of herbivores plays a significant role in determining the moisture status, runoff pattern and liberation of mineral elements accumulated in the aerial parts of the vegetation.
If surface litter is not removed and allowed to decompose and contribute to nutrient cycling, the soil can support higher productivity of trees by Miller [1]. The litter on the forest floor acts as input–output system of nutrient and the rates at which forest litter falls and subsequently, decomposes contribute to the regulation of nutrient cycling and primary productivity, and to the maintenance of soil fertility in forest ecosystems was done by Olson [2], Singh et al. [3], Fioretto et al. [4], Onyekwelu et al. [5] and Pandey et al. [6].
The significance of plant species diversity for ecosystem functioning is a central issue in current ecological research as per Hooper et al. [7] and Balvanera et al. [8]. According to Lorenzen et al. [9] and Spehn et al. [10], to date, most studies have focused on diversity– productivity relationships in experimental grasslands or forest plantations. In these studies, positive relationships have generally been found between primary productivity and plant
species diversity by Spehn et al. [10]. In case of degraded restored ecosystem, selection of plant species which can survive in poor substratum (which is devoid of nutrients) is of prime importance to ameliorate the site. The process of litter production and decomposition varies with the plant species and within a species growing under different site conditions.
In this context, the quantitative evaluation of litter production and decomposition rates with respect to the vegetation characteristics offer an opportunity to understand ecosystem processes and those factors that control organic matter production and decomposition rates.
Materials and methods
Study area
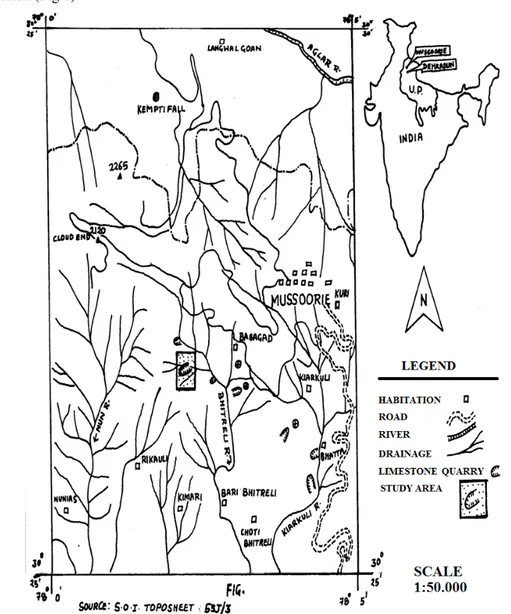
The study area is located between 300 25’ to 30030’ N Lat. and 7800’ to 7805’ E long. at an elevation of 1700- 1850m above msl, under Bhitreli reserved forest of Mussoorie Forest Division (Fig.1).
Study area (lambidhar) is entirely built on pure limestone and in krol belt (Fig. 2). Limestone is present in various forms such as dolomite, argillaceous-limestone etc. The climate of an area is rigorous dry for most part of the year. The year is broadly divided into three seasons viz., summer (April to mid June), rainy (mid June to mid September) and winter (November to March). Study site was divided into four different experimental sites according to their age as: Site I- Eleven years old rehabilitated plot; Site II- Eight years old rehabilitated plot; Site III- Six years old rehabilitated plot; Site IV- Four years old rehabilitated plot.
Fig. 2. General view of degraded limestone mine (Lambidhar) Vegetation Analysis
To find out the relationships between vegetation structure, composition and organic matter accretion and decomposition, vegetation analysis of restored mined sites has been carried out during the course of present study. The vegetation survey was carried out by using litter plot sampling procedure by Misra [11]. Data obtained were quantitatively estimated for frequency, density and abundance by Curtis and Intosh [12]. The Importance Value Index (IVI) for each species was determined as the sum of relative frequency, relative density and relative dominance.
Related frequency = frequency of the ‘i’ species X 100 (1)
total frequency of the plots
Relative density = number of individuals of the species ‘i’ X 100 (2) Total number of individuals in the plot
Relative dominance = sum of the basal area of individuals
of the same species X 100 (3) total basal area of the plot
Importance Value Index (IVI) = relative dominance + relative frequency + relative
density
Litter production
cleared. The litter accumulation over the month was collected and weighed to obtain the fresh weight and samples were brought to the laboratory for oven dry weight estimation at 800C till the constant weight.
Results and discussions
Vegetational Analysis
In four selected sites, the vegetative composition varies with age of site/ year of plantation are presented in Table 1. Maximum life forms were present in Site II represented by the presence of 38 nos. of species followed by Site I (33 nos. of species), Site III (33 nos.) and least in Site IV (29 nos.).
Table 1. Total Basal Cover (TBC) of different plant forms in study sites
Plant forms Site I Site II Site III Site IV
Trees 1 1 1 1 Shrubs 18 13 12 10
Herbs 5 10 8 8
Grasses 3 7 5 6
Seedlings 6 7 7 4
Total 33 38 33 29
Total Basal Cover for trees and shrubs (cm2/25m2) and herbs and grasses (cm2/m2) as reported in Table 2, was highest in Site I (161.88) followed by Site II (102.92), Site III (100.53) and lowest in Site IV (82.12). As Site I and Site II shown equal composition of plant forms but the sites greatly varied in TBC due to the highly variation in basal cover of shrubs (Site I - 127.74 whereas for Site III- 40.44).
In terms of vegetation, maximum number was reported in Site II but the total basal cover of all plant forms (102.92) was lower than Site I due to the variation in the TBC of shrubs (59.05) and herbs & grasses (12.67) in Site II. The least number of plant forms in Site IV contributed lowest basal cover (82.12).
Table 2. Number of species of different plant forms in four study sites Plant forms Site I Site II Site III Site IV Trees 30.16 31.20 39.60 3.17
Shrubs 127.74 59.05 40.44 71.35
Herbs and grasses
3.98 12.67 20.49 7.60
Total 161.88 102.92 100.53 82.12
The dominant species of trees, shrubs, herbs and grasses are shown in Table 3 and 4. The most dominant species of trees and shrubs with their IVI (Importance Value Index) were in order for Site I: Eupatorium glandulosum (79.04) > Coriaria nepalensis (60.51) > Cupressus
torulosa (39.51) > Hypericum patulum (16.77) > Nepeta hindostana (12.40) whereas in case of
herbs and grasses the most dominant species was Bidens biternata (156.76) followed byother species.
For Site II the order of the dominant species of tree and shrubs: Eupatorium glandulosum
(83.67) >Cupressus torulosa(61.29) >Rumex hastatus(30.51) >Hypericum patulum(26.43)
>Debregeasia hypoleuca (15.87). In case of herbs and grasses, the most dominant species was
Chrysopogon fulvus (56.16) whereas IVI (Importance Value Index) of dominant trees and
shrubs species (Site III) was in order: Cupressus torulosa (85.72) > Eupatorium glandulosum
(19.29) while in case of herbs and grasses (Table 4) the most dominant species was
Chrysanthemum leucanthemum (85.08)followed by the other species.For Site IV, floristic
composition of trees and shrubs with their dominance as: Eupatorium glandulosum (114.21) >
Artemisia roxburghii (36.95) > Hypericum patulum (27.08) > Rumex hastatus (26.15) >
Debregeasia hypoleuca (24.80). While in case of herbs and grasses (Table 4), the most
dominant species with their IVI: Artemisia roxbughii (62.40).
Table 3. The Importance Value Indices (IVI) of dominant species of trees and shrubs in each sites
Species Frequency (%)
Density
(Plants/25m2) Abundance TBA (cm2/25m2) IVI
Eupatorium
glandulosum 80.00 17.60 22.00 52.45 79.04
Coriaria nepalensis 80.00 9.40 11.75 49.73 60.51
Cupressus torulosa 80.00 5.20 6.50 30.16 39.51
Hypericum patulum 80.00 2.20 2.75 3.96 16.77
Trees and Shrub species of Site I
Nepeta hindostana 60.00 1.40 2.33 3.50 12.40
Eupatorium
glandulosum 100.00 14.20 14.20 29.68 83.67
Cupressus torulosa 100.00 5.20 5.20 31.20 61.29
Rumex hastatus 60.00 5.40 9.00 7.56 30.51
Hypericum patulum 100.00 3.40 3.40 4.08 26.43
Site II
Debregeasia hypoleuca 60.00 1.60 2.67 3.52 15.87
Cupressus torulosa 80.00 6.60 8.25 39.60 85.72
Eupatorium
glandulosum 80.00 9.60 12.00 11.23 60.48
Rumex hastatus 60.00 4.40 7.33 8.80 36.31
Colebrookia
oppositifolia 40.00 3.60 9.00 5.87 26.47
Site III
Coriaria nepalensis 40.00 1.00 2.50 7.20 19.29
Eupatorium
glandulosum 100.00 18.80 18.80 41.36 114.21
Artemisia roxburghii 100.00 5.80 5.80 7.08 36.95
Hypericum patulum 80.00 4.00 5.00 4.96 27.08
Rumex hastatus 80.00 3.00 3.75 6.06 26.15
Site IV
Debregeasia hypoleuca 100.00 2.20 2.20 4.47 24.80
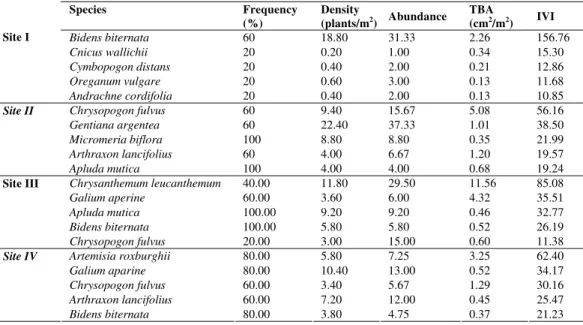
Table 4. The Importance Value Indices (IVI) of dominant species of herbs and grasses in each sites
Species Frequency (%)
Density
(plants/m2) Abundance
TBA
(cm2/m2) IVI
Bidens biternata 60 18.80 31.33 2.26 156.76
Cnicus wallichii 20 0.20 1.00 0.34 15.30
Cymbopogon distans 20 0.40 2.00 0.21 12.86
Oreganum vulgare 20 0.60 3.00 0.13 11.68
Site I
Andrachne cordifolia 20 0.40 2.00 0.13 10.85
Chrysopogon fulvus 60 9.40 15.67 5.08 56.16
Gentiana argentea 60 22.40 37.33 1.01 38.50
Micromeria biflora 100 8.80 8.80 0.35 21.99
Arthraxon lancifolius 60 4.00 6.67 1.20 19.57
Site II
Apluda mutica 100 4.00 4.00 0.68 19.24
Chrysanthemum leucanthemum 40.00 11.80 29.50 11.56 85.08
Galium aperine 60.00 3.60 6.00 4.32 35.51
Apluda mutica 100.00 9.20 9.20 0.46 32.77
Bidens biternata 100.00 5.80 5.80 0.52 26.19
Site III
Chrysopogon fulvus 20.00 3.00 15.00 0.60 11.38
Artemisia roxburghii 80.00 5.80 7.25 3.25 62.40
Galium aparine 80.00 10.40 13.00 0.52 34.17
Chrysopogon fulvus 60.00 3.40 5.67 1.29 30.16
Arthraxon lancifolius 60.00 7.20 12.00 0.45 25.47
Site IV
Litter Return
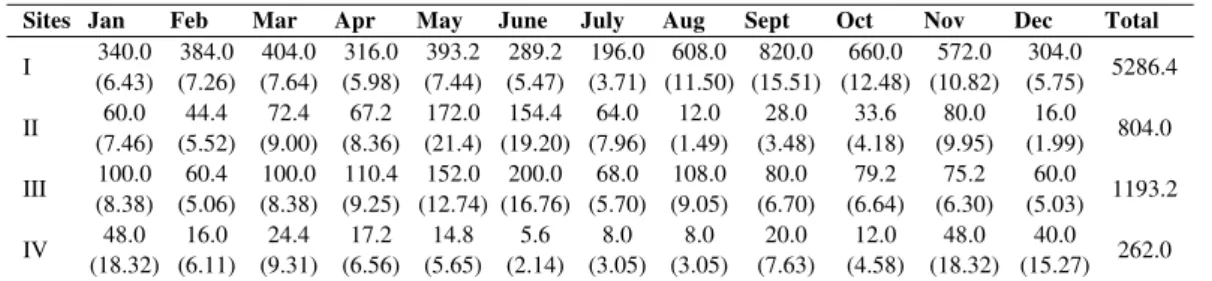
Litter in Kg/ha along with percent contribution of litter production to the total litter in different age stand is shown in Table 5. The annual litter production in 11 years old rehabilitated site (Site I-5286.4 Kg/ha) was higher than that of eight years old (Site II - 804.0kg/ha), six years old (Site III-1193.2kg/ha) and four years old (Site IV-262.0kg/ha) rehabilitated area. This difference in litter production between the sites could be mainly attributed to species composition and their dominance. According to Sundarapandian and Swamy [15] tree species composition was important for litter production within the same climate range.
Table 5. Monthly litter fall (kg/ha) in four study sites
Sites Jan Feb Mar Apr May June July Aug Sept Oct Nov Dec Total
I 340.0 (6.43) 384.0 (7.26) 404.0 (7.64) 316.0 (5.98) 393.2 (7.44) 289.2 (5.47) 196.0 (3.71) 608.0 (11.50) 820.0 (15.51) 660.0 (12.48) 572.0 (10.82) 304.0 (5.75) 5286.4
II 60.0 (7.46) 44.4 (5.52) 72.4 (9.00) 67.2 (8.36) 172.0 (21.4) 154.4 (19.20) 64.0 (7.96) 12.0 (1.49) 28.0 (3.48) 33.6 (4.18) 80.0 (9.95) 16.0 (1.99) 804.0
III 100.0 (8.38) 60.4 (5.06) 100.0 (8.38) 110.4 (9.25) 152.0 (12.74) 200.0 (16.76) 68.0 (5.70) 108.0 (9.05) 80.0 (6.70) 79.2 (6.64) 75.2 (6.30) 60.0
(5.03) 1193.2
IV 48.0 (18.32) 16.0 (6.11) 24.4 (9.31) 17.2 (6.56) 14.8 (5.65) 5.6 (2.14) 8.0 (3.05) 8.0 (3.05) 20.0 (7.63) 12.0 (4.58) 48.0 (18.32) 40.0 (15.27) 262.0 *Figures in parenthesis refers to percentage contribution
The higher litter production in Site I was due to the presence of large number of shrub species than the other sites (Table 1). Shrubs generally have a quality to produce more foliage, which in turn is responsible for producing more organic matter. A regular increase in litter yield with increasing age of rehabilitated site in present study was also attributed due to the continuous development of community structure as well as canopy cover. The results of litter fall in the present study were in agreement with the study conducted in sodic lands by Tyagi [16] and Garg [17].
Whereas Site II recorded lower value of annual litter production than Site III the reason was due to the variations in plant composition and their behavior in these Sites. The species like
Coriaria nepalensis, Rumex hastatus (shrubs), and Cupressus torulosa (tree) and grasses which
have relatively high dominance in Site III than Site II was contributing more litter over the year in Site III.
Though the basal cover of shrubs in Site IV was comparatively higher, even than the litter production was very less comparatively to the other sites. It also depends on the foliar phenology and crown structure. This is an agreement with Binkley et al. [18].
Annual variation in litter production of four study sites shows statistically significant differences (Table 6).
Table 6. Statistical analysis of annual litter fall in four study sites Site I Site II Site III Site III Site I – 185.40*** 146.37*** 255.01***
Conclusions
In conclusion, the selection of species in restored area is of prime importance. Although the study sites were belongs to the same climatic region but it was explained by the results of litter production that it was driven by the vegetation composition and the age of the plantation.
Acknowledgement
We are thankful to Director, Forest Research Institute for providing all the infrastructural facilities. The skilful technical assistance of the Forest Ecology and Environment Division during data collection in the field is gratefully acknowledged.
References
[1] H.G.Miller, Forest fertilization: some guiding concepts, Forestry, 54, 1981, pp. 57-167. [2] J.S.Olson, Energy storage and the balance of produces and decomposition in ecological
systems, Ecology, 44, 1963, pp. 322-331.
[3] K.P.Singh, P.K. Singh, S.K. Tripathi, Litterall, litter decomposition and nutrient release
patterns in four native tree species raised on coal mine spoil at Singrauli, India, Biology
and Fertility of Soils,29, 1999, pp. 371–378.
[4] A. Fioretto, S. Papa, A. Fuggi, Litterfall and litter decomposition in a low Mediterranean
shrubland, Biology and Fertility of Soils,39, 2003, pp. 37–44.
[5] J.C.Onyekwelu, R. Mosandl, B.Stimm, Productivity, site evaluation and state of nutrition of
Gmelina arborea plantations in Oluwa and Omo forest reserves, Nigeria, Forest Ecology
and Management,229, 2006, pp. 214–227.
[6] R.R.Pandey, G.Sharma, S.K.Tripathi, A.K. Singh, Litterfall, litter decomposition and nutrient dynamics in a subtropical natural oak forest and managed plantation in
northeastern India, Forest Ecology and Management,240, 2007, pp. 96– 104.
[7] D.U.Hooper, F.S.Chapin, J.J. Ewel, A. Hector, P. Inchausti, S. Lavorel, J.H. Lawton, D. M. Lodge, M. Loreau, S. Naeem, B. Schmid, H. Setala, A.J. Symstad, J. Vandermeer, D.A. Wardle, Effects of biodiversity on ecosystem functioning: a consensus of current
knowledge, Ecological Monographs, 75, 2005, pp. 3–35.
[8] P. Balvanera, A.B. Pfisterer, N. Buchmann, T. Nakashizuka, D. Raffaelli, B. Schmid, Quantifying the evidence for biodiversity effects on ecosystem functioning and
services, Ecology Letters,9, 2006, pp. 1146–1156.
[9] M. Scherer-Lorenzen, C. Potvin, J. Koricheva, B. Schmid, A. Hector, Z. Bornik, G. Reynolds, E.D. Schulze, Forest diversity and function, Springer, Berlin, 2005, pp. 347– 376.
[10] E. M. Spehn, A. Hector, J. Joshi, M. Scherer-Lorenzen, B. Schmid, E. Bazeley-White, C. Beierkuhnlein, M.C. Caldeira, M. Diemer, P.G. Dimitrakopoulos, J.A. Finn, H. Freitas, P.S. Giller, J. Good, R. Harris, P. Högberg, K. Huss-Danell, A. Jumpponen, J. Koricheva, P.W. Leadley, M. Loreau, A. Minns, C.P.H. Mulder, G. O’Donovan, S.J. Otway, C. Palmborg, J.S. Pereira, A.B. Pfisterer, A. Prinz, D.J. Read, E.D. Schulze, A.S.D. Siamantziouras, A.C. Terry, A.Y. Troumbis, F.I. Woodward, S. Yachi, J.H. Lawton,
Ecosystem effects of biodiversity manipulations in European grasslands, Ecological
Monographs,75, 2005, pp. 37–63.
[11] R. Misra, Ecology Work Book, Oxford and IBH Pub., New Delhi, 1968.
[12] J.T.Curtis, R.P. Mc Intosh, The inter-relationship of certain analytic and synthetic
[13] A. Medwecks - Kornas, Proceedings of the Symposium on Methods of the Study in Soil
Ecology, Ed. Phillipson, UNESCO, Paris, 1970.
[14] N. Suckachev, N. Dylis, Programme and Methods of Biogeocoenological
Investigations, Navka Publishing Office, Moscow, 1966.
[15] S.M.Sundarapandian, P.S. Swamy, Litter production and leaf-litter decomposition of
selected tree species in tropical forests at Kodayar in the Western Ghats, India, Forest
Ecology and Management,123, 1999, pp. 231–244.
[16] K. Tyagi, Nutrient cycling and biomass production in an age series of pure and mixed
plantation in sodic lands of Uttar Pradesh. Ph.D.Thesis, FRI Deemed University, Dehra
Dun 2002.
[17] V. K.Garg, Litter production and its nutrient concentration in some fuel wood trees grown
on sodic soil, Biomass and Bioenergy, 3(5), 1992, pp. 323- 328.
[18] D. Binkley, K.A. Dunkin, D. DeBell, M.G. Ryan, Production and nutrient cycling in mixed
plantations of Eucalyptus and Albizia in Hawaii, Forest Science, 38,1992, pp. 393–408