Regina Mara FisbergI
Dirce Maria Lobo MarchioniI Michelle Alessandra de CastroI Eliseu Verly JuniorII
Marina Campos AraújoII Ilana Nogueira BezerraIII Rosângela Alves PereiraIV Rosely SichieriII
I Departamento de Nutrição. Faculdade de Saúde Pública. Universidade de São Paulo. São Paulo, SP, Brasil
II Departamento de Epidemiologia. Instituto de Medicina Social. Universidade do Estado do Rio de Janeiro. Rio de Janeiro, RJ, Brasil III Faculdade de Ciências Médicas.
Universidade do Estado do Rio de Janeiro. Rio de Janeiro, RJ, Brasil
IV Departamento de Nutrição Social Aplicada. Instituto de Nutrição Josué de Castro. Universidade Federal do Rio de Janeiro. Rio de Janeiro, RJ, Brasil
Correspondence: Regina Mara Fisberg
Faculdade de Saúde Pública – USP Av. Doutor Arnaldo, 715 01246-904 São Paulo, SP, Brasil E-mail: rfi sberg@usp.br Received: 12/1/2012 Approved: 7/18/2012
Article available from: www.scielo.br/rsp
Inadequate nutrient intake
among the Brazilian elderly:
National Dietary Survey
2008-2009
ABSTRACT
OBJECTIVE: To estimate the prevalence of inadequate nutrient intake in the Brazilian elderly.
METHODS: This study was based on data from the National Dietary Survey, part of the Household Budget Survey 2008-2009. All individuals aged 60 and over, totaling 4,322 individuals, were included. Individual food intake was obtained from food records from two non-consecutive days. The habitual intake for each nutrient was estimated by the National Cancer Institute method, in which sex and region were included as covariates. The prevalence of inadequate nutrient intake was estimated stratifi ed by sex and region using the EAR method to defi ne cut-off points.
RESULTS: A high prevalence of inadequate intake (> 50%) of vitamins E, D and A, calcium, magnesium and pyridoxine was observed for both sexes. In all regions, 100% inadequate vitamin E intake was observed. Vitamin D showed almost 100% inadequate intake except in the North region. The prevalence of inadequate vitamin A intake was higher than 70% in the North, Northeast, and Midwest regions. Among the minerals evaluated, calcium and magnesium showed the highest prevalence of inadequate intake (> 80%) in all regions.
CONCLUSIONS: The present study found a high prevalence of inadequate intake of nutrients recognized as being protective against chronic diseases among the Brazilian elderly.
The elderly population is one of the age groups at higher risk of malnutrition and nutritional defi ciencies due to declining physical and cognitive function and which impair the consumption and metabolizing of nutrients.1,4 Thus, dietary and nutritional surveillance have been proven as essential to characterizing dietary practices and their determinants in this population, with the aim of preventing nutritional disorders and related diseases.a
The calculation of the prevalence of inadequate intake has been a strategy used in international health and nutrition surveys to identify individuals at risk of nutritional defi ciencies.15-17,23 Therefore, the Ministry of Health’s National Dietary and Nutritional Policy, in partnership with IBGE (Instituto Brasileiro de Geografia e Estatística — Brazilian Institute of Geography and Statistics) carried out the fi rst INA (National Dietary Survey) as part of the 2008-2009 Household Budget Survey.b In this survey, a diagnosis of the Brazilian dietary and nutritional situation was carried out using calculations of prevalence of inad-equate micronutrient intake.
This article aims to estimate the prevalence of inade-quate nutrient intake among the Brazilian elderly.
METHODS
Data from the National Dietary Survey, corresponding to one module of the 2008-2009 Household Budget Survey were analyzed.b
The Household Budget Survey used a two-stage cluster sampling design.b In the fi rst stage census primary sampling units were selected for the sample, with probability proportional to the number of residences in each tract. The primary sampling units were randomly selected, with probability proportional to the number of residences based on the 2000 Demographic Census. In the second stage, the sample units were permanent private residences, selected using simple random sampling without replacement, from within each primary sampling unit. All of the strata in the study were evaluated throughout the 12 months of the survey.
An amount of 68,373 households were selected. A subsample for the INA was calculated at 25% of the households in the Household Budget Survey 2008-2009 sample and was organized so that one in every four residences in each primary sampling unit was selected. In the data collection stage 16,764 residences (24.5%) were sampled. There were 38,340 residents aged ten and over, in 13,569 households, who responded to the INTRODUCTION
a Ministério da Saúde, Secretaria de Atenção à Saúde, Departamento de Atenção Básica. Indicadores de vigilância alimentar e nutricional: Brasil 2006. Brasília (DF); 2009.
b Instituto Brasileiro de Geografi a e Estatística. Pesquisa de Orçamentos Familiares 2008-2009: análise do consumo alimentar pessoal no Brasil. Rio de Janeiro: IBGE; 2011.
research, with a non-response rate of 19%. A total of 34,032 individuals completed the data on food and/or drink intake (11% non-response rate). In this analysis, only those aged 60 or over are included, giving a sample of 4,322 individuals, of both sexes.
Data on individual food intake were obtained through food records completed by residents aged 60 and over on two non-consecutive days according to Institute of Medicine recommendations,9 with the aim of estimating usual intake and calculating the prevalence of inad-equate nutrient intake. Guidance was given on how to record portion sizes, times and places of meals (at home or away from home) and detailed description of all food and drink consumed, including the cooking methods and ingredients. In addition to collecting information on food and drink consumed, the food record included a question on sugar and/or sweetener consumption.
In the households, interviewers entered the data on food consumption into a program specially developed by the IBGEb which included food and drinks taken from 5,686 records contained in the Household Budget Survey 2002-2003 database of household food and drink acquisition. This program has approximately 1,500 items of food and drink, 16 options of cooking methods and 106 types of portions and measurements, as well as items which were compulsory such as the place and time of consumption. Food and drink consumed by the individuals who were not included in the survey were included by the interviewer. At the end of the survey, 1,120 items of food and drink were reported.
To control the quality of data of dietary consumption, partial analysis was carried out during data collection, such as verifying the frequency of the response, mean number of items consumed on the fi rst and second day of food recording, codifying items which were not recorded and inspecting items included by the interviewer.
Details on the pre-test, training, validation of the data collection instrument and data input are published by the IBGE.b
In order to convert the reported food items into values for micronutrients, tables of nutritional compositionc
and portion sizes,d
specially created to analyze food and dishes cited in the 2008-2009 Household Budget Survey, were used. The nutritional composition tables were drawn up based on the Nutrition Data System for Research (NDS-R), version 2008 program,17 as well as the Brazilian Table of Food Composition (TACO).e Data on nutrient intake represents only nutrients gleaned from food and/or drink and does not include supplements and/or medication.
Usual intake of each nutrient was estimated using the method developed by researchers at the National Cancer Institute.24 The National Cancer Institute method is a mixed model with two parts. In the fi rst part, the probability of consumption is estimated using logistic regression with random effects (probability model); in the second, using the data transformed for normality, the quantity consumed is estimated using linear regression with random effects (quan-tity model). Due to the fact that the nutrients are consumed almost daily, probability, in this study, is assumed to be equal to 1 for each nutrient, thus dispensing with the use of the probability model. In the quantity model gender (male; female) and region (North, Northeast, Southeast, South and Mideast) were used as co-variables. The means and percentiles of intake were estimated for each gender. The National Cancer Institute method was used with DISTRIB and MIXTRAN macros developed for SAS (Statistical Analysis System) version 9.1 software.
The rates of prevalence of inadequate micronutrient intake were estimated according to gender and age group (51-70 years old; > 70 years old), using the EAR (Estimated Average Requirement) method as cut off points, according to the Institute of Medicine proposal for the population of the United States and Canada.7,9-12 The prevalence of inadequate micronutrient intake was calculated as the percentage of individuals with intake below the EAR value, i.e., with intake lower than the mean estimated requirement for the micronutrient for each gender and age group. Sodium intake was compared with the UL (Tolerable Upper Intake Level), which allowed the percentage of the population at risk of adverse health effects to be estimated.
The analyses were stratifi ed by gender and region. Confi dence interval of 95% were calculated for the means and prevalence of inadequacy based on the standard error values estimated using the Balanced Repeated Replication (BRR) technique used in the
National Cancer Institute method. These intervals were used to compare prevalence of inadequate intake according to gender and region.
This study was approved by the Ethics Committee of the Faculdade de Saúde Pública, Universidade de São Paulo (Protocol nº 2258/2011).
RESULTS
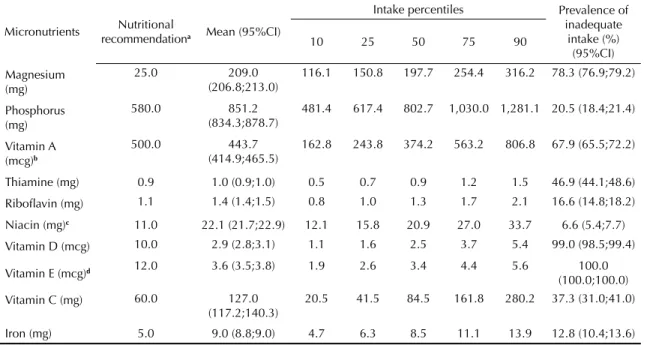
High rates of prevalence of inadequate vitamin E, vitamin D, calcium and magnesium intake were observed in elderly people of both sexes (Tables 1 and 2). For these micronutrients, the rates of prevalence of inadequate intake were around or above 80%. Inadequate intake of thiamine, pyridoxine, and vitamin C in both sexes also stood out, with values between 37% and 57%, as did vitamin A, with percentages between 68% in women and 83% in men.
Prevalence rates of inadequate intake lower than 15% were observed for phosphorus, selenium, iron and niacin for males (Table 1), and for only iron and niacin in females (Table 2). The prevalence rates of inadequate magnesium, vitamin A, ribofl avin and zinc intake were higher for men, whereas inadequate phosphorus, niacin, iron and copper intake was more prevalent among women. For the other micronutrients, no signifi cant differences were observed between sexes.
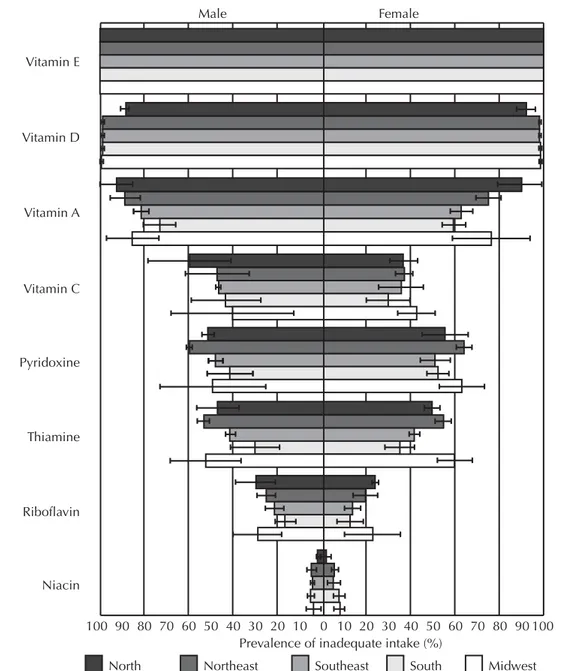
Figure 1 shows prevalence rates of inadequate vitamin intake by region. Throughout the country, vitamins E, D and A had the highest rates of inadequate intake. Irrespective of region, vitamin E was the only nutrient to show 100% inadequate intake for both sexes. Vitamin D had rates close to 100% in all regions except the North, where the rate was signifi cantly lower (89% in men and 92% in women). For vitamin A, higher rates of inadequate intake were observed in the North (93% in men and 91% in women), Northeast (89% in men and 76% in women) and Midwest (86% in men and 78% in women), with a signifi cant differ-ence between men and women only in the Northeast. Other vitamins with high prevalence rates of inad-equate intake in the North, Northeast and Midwest were pyridoxine (49% to 60% in men and 56% to 65% in women), thiamine (47% to 53% in men and 50% to 61% in women) and vitamin C (40% to 60% in men and 37% to 43% in women), with no signifi cant difference between the sexes.
With regards to minerals, calcium was that which showed the highest rates of inadequate intake in all
c Instituto Brasileiro de Geografi a e Estatística. Pesquisa de Orçamentos Familiares 2008- 2009: tabela de composição nutricional dos alimentos consumidos no Brasil. Rio de Janeiro: IBGE; 2011.
d Instituto Brasileiro de Geografi a e Estatística. Pesquisa de Orçamentos Familiares 2008-2009: tabela de medidas referidas para os alimentos consumidos no Brasil. Rio de Janeiro: IBGE; 2011.
Table 2. Mean, percentiles and prevalence of inadequate intake of vitamins and minerals of elderly females. Brazil, 2008-2009.
Micronutrients Nutritional
recommendationa Mean (95%CI)
Intake percentiles Prevalence of inadequate
intake (%) (95%CI)
10 25 50 75 90
Magnesium (mg)
25.0 209.0
(206.8;213.0)
116.1 150.8 197.7 254.4 316.2 78.3 (76.9;79.2)
Phosphorus (mg)
580.0 851.2
(834.3;878.7)
481.4 617.4 802.7 1,030.0 1,281.1 20.5 (18.4;21.4)
Vitamin A (mcg)b
500.0 443.7
(414.9;465.5)
162.8 243.8 374.2 563.2 806.8 67.9 (65.5;72.2)
Thiamine (mg) 0.9 1.0 (0.9;1.0) 0.5 0.7 0.9 1.2 1.5 46.9 (44.1;48.6)
Ribofl avin (mg) 1.1 1.4 (1.4;1.5) 0.8 1.0 1.3 1.7 2.1 16.6 (14.8;18.2)
Niacin (mg)c 11.0 22.1 (21.7;22.9) 12.1 15.8 20.9 27.0 33.7 6.6 (5.4;7.7)
Vitamin D (mcg) 10.0 2.9 (2.8;3.1) 1.1 1.6 2.5 3.7 5.4 99.0 (98.5;99.4)
Vitamin E (mcg)d 12.0 3.6 (3.5;3.8) 1.9 2.6 3.4 4.4 5.6 100.0
(100.0;100.0)
Vitamin C (mg) 60.0 127.0
(117.2;140.3)
20.5 41.5 84.5 161.8 280.2 37.3 (31.0;41.0)
Iron (mg) 5.0 9.0 (8.8;9.0) 4.7 6.3 8.5 11.1 13.9 12.8 (10.4;13.6)
Continue
Table 1. Mean percentiles and prevalence of inadequate intake of vitamins and minerals in elderly males. Brazil, 2008-2009.
Micronutrientes Nutritional
recommendationa Mean (95%CI)
Intake percentiles Prevalence of inadequate
intake (%) (95%CI)
10 25 50 75 90
Magnesium (mg)
350.0 250.9 (244.4;255.7) 144.1 183.8 237.9 303.8 373.9 86.1 (84.6;88.5)
Phosphorus
(mg) 580.0 984.1 (954.3;999.2) 568.5 720.1 929.5 1,188.1 1,468.5 11.1 (10.3;12.4)
Vitamin A (mcg)b
625.0 409.9 (394.4;428.7) 150.9 224.2 344.4 521.4 746.6 83.3 (81.6;85.4)
Thiamine (mg) 1.0 1.1 (1.1;1.2) 0.6 0.8 1.1 1.3 1.7 44.1 (42.1;45.5)
Ribofl avin (mg) 1.1 1.6 (1.5;1.6) 0.9 1.2 1.5 1.9 2.4 21.5 (18.5;26.9)
Niacin (mg)c 12.0 26.5 (25.4;27.2) 15.0 19.3 25.1 32.2 39.8 3.6 (3.3;4.3)
Vitamin D (mcg)
10.0 3.1 (2.9;3.3) 1.2 1.7 2.6 4.0 5.7 98.8 (98.3;99.2)
Vitamin E (mcg)d
12.0 4.3 (4.1;4.4) 2.5 3.1 4.0 5.2 6.4 99.9
(99.9;100.0)
Vitamin C (mg) 75.0 117.9 (108.2;137.0) 19.0 38.0 77.8 150.6 260.9 49.0 (39.3;53.4)
Iron (mg) 6.0 11.2 (10.9;11.6) 6.2 8.1 10.7 13.8 17.0 8.8 (7.4;10.2)
Calcium (mg)e 800 499.9 (447.8;552.0) 231.4 323.8 455.2 626.2 823.5 88.8 (86.5;91.0)
1,000 501.7 (446.3;557.0) 231.2 322.5 453.4 628.6 832.4 97.6 (95.4;99.7)
Pyridoxine (mg) 1.4 1.5 (1.4;1.5) 0.8 1.1 1.4 1.8 2.2 50.5 (45.6;53.3)
Zinc (mg) 9.4 11.1 (10.8;11.4) 6.3 8.0 10.5 13.5 16.8 39.1 (35.9;42.2)
Copper (mg) 0.7 1.1 (1.0;1.2) 0.6 0.8 1.0 1.4 1.8 21.0 (16.8;24.6)
Sodium (mg) 2,300
f 3,232.0
(3,145.0;3,304.0)
1,960.0 2,457.0 3,111.0 3,875.0 4,660.0
-a according to Estimated Average Requirement values (EAR), Institute of Medicine (2000)
b retinol activity equivalents
c niacin equivalents
d total alpha-tocopherol
e EAR values according to age group (60-70 years old and 71 and over respectively)
Tabela 2. Continuation
Micronutrients Nutritional
recommendationa Mean (95%CI)
Intake percentiles Prevalence of inadequate intake
(%) (95%CI)
10 25 50 75 90
Cálcio (mg) 1,000 476.6
(429.4;523.9)
217.5 305.2 433.6 599.9 789.8 96.5 (94.9;98.0)
Pyridoxine (mg) 1.4 1.3 (1.2;1.4) 0.7 0.9 1.2 1.6 1.9 57.2 (52.1;60.5)
Zinc (mg) 6.8 9.0 (8.8;9.1) 4.9 6.4 8.4 10.9 13.7 30.5 (28.6;32.3)
Copper (mg) 0.7 0.9 (0.9;1.0) 0.5 0.6 0.8 1.1 1.5 35.6 (31.8;38.4)
Sodium (mg) 2,300e (2,630.0;2,714.0) 1,557.0 1,996.0 2,568.0 3,237.0 3,939.0 -a according to Estimated Average Requirement values (EAR), Institute of Medicine (2000)
b retinol activity equivalents
c niacin equivalents
d total alpha-tocopherol
e upper tolerable limit intake(UL)
Female Male
Vitamin E
Vitamin D
Vitamin A
Vitamin C
Pyridoxine
Thiamine
Riboflavin
Niacin
100 90 80 70 60 50 40 30 20 10 0 10 20 30 40 50 60 70 80 90100 Prevalence of inadequate intake (%)
North Northeast Southeast South Midwest
regions, for both men (84% to 98%) and women (94% to 98%). In the fi ve regions of the study, no signifi -cant differences between the sexes were observed in the prevalence rates of inadequate calcium intake. Signifi cant difference were only observed between women in the North and Southeast (North: 98%, 95%CI 97.0;100.0 and Southeast: 94%, 95%CI 93.0;96.0). Magnesium was the mineral with the second highest prevalence rate of inadequate intake (77% to 88% in men and 69% to 82% in women), with signifi cant differences apparent between men and women in the Northeast (men: 86%, 95%CI 82.3;90.3; women: 79%, 95%CI 76.5;80.6) and Southeast (men: 85%, 95%CI 83.0;87.9; women: 78%, 95%CI 76.1;79.0), and between women in the South (82%, 95%CI 80.0;84.0)
and Southeast (78%, 95%CI 76.0;79.0) (Figure 2). Other minerals with high rates of inadequate intake were zinc among men in all of the regions (26% to 42%) and copper in women in the North (56%), Northeast (45%), Midwest (38%) and Southeast (32%). No signifi cant differences were observed in prevalence rates of inadequate intake of zinc according to region. Inadequate copper intake in women was higher in the Northeast (45%, 95%CI 39.0;52.0) compared with the Southeast (32%, 95%CI 30.0;34.0).
With regard to sodium, 80% of the elderly males and 61% of the elderly females in the study showed usual intake above the tolerable intake level. Figure 3 shows these percentages according to region. The highest percentages of excessive sodium intake were observed in the North Magnesium
Male Female
Zinc
Copper
Iron
Phosphorous
Prevalence of inadequate intake (%)
100 90 80 70 60 50 40 30 20 10 0 10 20 30 40 50 60 70 80 90 100
North Northeast Southeast South Midwest
Figure 2. Prevalence of inadequate intake of minerals in the elderly by sex and region. Brazil, 2008-2009.
Magnesium
Male Female
Percentage of individuals with intakes above the tolerable upper intake
100 90 80 70 60 50 40 30 20 10 0 10 20 30 40 50 60 70 80 90 100
North Northeast Southeast South Midwest
Figure 3. Percentage of elderly with habitual intake of sodium above the tolerable upper intake by gender and region. Brazil,
(64% for women and 83% for men), Southeast (65% for women and 82% for men) and the Midwest (61% for women and 80% for men), although there were no signifi cant differences between the regions.
DISCUSSION
This study found high percentages of inadequate intake of vitamins E, D and A, thiamine and pyridoxine and the minerals calcium, magnesium, zinc and copper, as well as high percentages of excessive sodium intake. With the exception of vitamin D, calcium and copper, these nutrients were also those which had high rates of inadequate intake in the North American elderly popu-lation assessed in the NHANES 2001-200215 health and nutrition survey.
Compared with Americans aged over 50, the Brazilian elderly showed higher prevalence rates of inadequate intake, especially of vitamin A, pyridoxine, thiamine and copper. In the Brazilian elderly, the highest rate of inadequate vitamin A intake was 83% in males and of the highest rates of inadequate pyridoxine, thiamine and copper intake were 57%, 47% and 36% respectively, in females. For the Americans, the prevalence of inad-equate vitamin A intake in males was 55%, and 49%, 12% and 14% for pyridoxine, thiamine and copper respectively, in females.
As the EAR values for vitamin D and calcium have only recently been established by the Institute of Medicine Nutrition Committee,13,21 there is still no published data on rates of inadequate intake of these nutrients in the elderly in other countries. However, based on the data from 2005-2006 NHANES,16 it is believed that the rates of inadequate vitamin D and calcium intake are also high in the North American population, if we take into consideration that fewer than 6% of Americans aged 50 and over have an higher than recommended intake of vitamin D, this fi gure being 24% for calcium.
In the analysis by region, it was verifi ed that the North had the lowest percentages of inadequate vitamin D intake for both sexes, whereas the Southeast was where the lowest rates of inadequate magnesium and copper intake for females were found. These results suggest that consumption of foods with high levels of micro-nutrients by the elderly varies signifi cantly between the different regions of the country. For example, the lower rates of inadequate vitamin D intake in the North may be explained by greater regular consumption of
fi sh, the rate being twice as high as in the North East and more than seven times higher than consumption in the other regions.b
Insuffi cient micronutrient intake may be a result of the reduced variety of foods which make up the usual diet of the elderly in Brazil. On analyzing food items consumed (data not shown), it was noted that rice, beans and beef were the items which contributed the most to the total calories consumed, fl owed by cassava fl our in the North, couscous in the Northeast, pasta and bread in the South and Southeast and pork in the Midwest. These food items, together, provided around 50% of the total calories consumed. Moreover, insuffi cient fruit and vegetable intake, which represents around a third of the recommendations proposed in the Food Guide for the Brazilian Populationf (≥ 400 g/day), may also lead to the low levels of micronutrient intake and explain the high rates of inadequate intake found here.b
The implications of high levels of inadequate intake observed in this study highlight the current demographic and epidemiological profi le of the Brazilian population, characterized by the increasing number of adults and the elderly and the high fi gures of non-communicable diseases associated with ageing.14 Although elderly brings a higher number of chronic diseases, studies have shown that they are not inevitable consequences of ageing19,20 and can be prevented by making healthy life-style choices, such as diet. There are an increase number of scientifi c evidence which indicate the protective role played by nutrients in etiology and the progression of chronic diseases, for example, anti-oxidants (vitamins C and E),2,13 those related to bone metabolism (vitamin D, calcium, magnesium and phosphorus)5,18 and those involved in cognitive functions (thiamine, ribofl avin, niacin and pyridoxine).6 High sodium intake in this population is a potential health risk, due to its link with increased blood pressure. According to World Health Organization estimates,25 17.2% of deaths in developing countries are attributed to high blood pressure, the most important cardiovascular risk factor known.
Another important aspect is the adjustment of nutrient intake for intra-individual variance. The National Cancer Institute method is, at the moment, one of the most commonly used to remove intra-individual variance in nutrients and food items when these are measured by short term methods, such as 24-hour recall or food records.3 In spite of providing more detailed information on dietary consumption than long term methods, the short term ones are incapable of capturing the day–to-day variation and, therefore, require accounting for the intra-individual variance
using statistical techniques, in order to calculate the prevalence of inadequate intake.22,24 Thus this study maintained methodological rigor in using statistical techniques suitable for measuring inadequate intake.
Vitamin and mineral intakes among the elderly in Brazil were lower than recommended values. Actions to encourage health eating by facilitating access to food sources of micronutrients, such as whole grains, fruit and vegetables, dairy products and fi sh for the elderly population may contribute to improve this situation.
1. Brownie S. Why are elderly individuals at risk of nutritional defi ciency? Int J Nurs Pract. 2006;12(2):110-8. DOI:10.1111/j.1440-172X.2006.00557.x
2. Carr AC, Zhu BZ, Frei B. Potential antiatherogenic mechanisms of ascorbate (vitamin C) and
α-tocopherol (vitamin E). Circ Res. 2000;87(5):349-54. DOI:10.1161/01.RES.87.5.349
3. Dodd KW, Guenther PM, Freedman LS, Subar AF, Kipnis V, Midthune D, et al. Statistical methods for estimating usual intake of nutrients and foods: a review of the theory. J Am Diet Assoc. 2006;106(10):1640-50. DOI:10.1016/j.jada.2006.07.011
4. Gariballa S. Nutrition and older people: special considerations relating to nutrition and ageing. Clin Med. 2004;4(5):411-4.
5. Gennari C. Calcium and vitamin D nutrition and bone disease of the elderly. Pub Health Nutr. 2001;4(2B):547-59.
6. Huskisson E, Maggini S, Ruf M. The infl uence of micronutrients on cognitive function and performance. J Inter Med Res. 2007;35(1):1-19. DOI:10.1177/147323000703500101
7. Institute of Medicine, Food and Nutrition Board. Dietary reference intakes for calcium, phosphorus, magnesium, vitamin D, and fl uoride. Washington (DC): National Academy Press; 1997.
8. Institute of Medicine, Food and Nutrition Board. Dietary reference intakes for thiamin, ribofl avin, niacin, vitamin B6, folate, vitamin B12, pantothenic acid, Biotin, and choline. Washington (DC): National Academy Press; 1998.
9. Institute of Medicine, Food and Nutrition Board. Dietary reference intakes: applications in dietary assessment. Washington (DC): National Academy Press; 2000.
10. Institute of Medicine, Food and Nutrition Board. Dietary reference intakes for vitamin C, vitamin E, selenium, and carotenoids. Washington (DC): National Academy Press; 2000.
11. Institute of Medicine, Food and Nutrition Board. Dietary reference intakes for vitamin A, vitamin K, arsenic, boron, chromium, copper, iodine, iron, manganese, molybdenum, nickel, silicon, vanadium, and zinc. Washington (DC): National Academy Press; 2001.
12. Institute of Medicine, Food and Nutrition Board. Dietary reference intakes for calcium and vitamin D. Washington (DC): National Academy Press; 2010.
13. Kaliora AC, Dedoussis GVZ, Schmidt H. Dietary antioxidants in preventing
atherogeneis. Atherosclerosis. 2006;187(1)1-17. DOI:10.1016/j.atherosclerosis.2005.11.001
14. Lebrão ML, Laurenti R. Saúde, bem-estar e envelhecimento: o estudo SABE no Município de São Paulo. Rev Bras Epidemiol. 2005;8(2):127-41. DOI:10.1590/S1415-790X2005000200005
15. Moshfegh A, Goldman J, Cleveland L. What we eat in America, NHANES 2001-2002: usual nutrient intakes from food compared to dietary reference intakes. Washington (DC): USDA Agricultural Research Service; 2005 [cited 2011 Oct 23]. Available from: http://www. ars.usda.gov/SP2UserFiles/Place/12355000/pdf/0102/ usualintaketables2001-02.pdf
16. Moshfegh A, Goldman J, Cleveland L. What we eat in America, NHANES 2005-2006: usual nutrient intakes from food and water compared to 1997 dietary reference intakes for vitamin D, calcium, phosphorus, and magnesium. Washington (DC): USDA Agricultural Research Service; 2009 [cited 2011 Oct 23]. Available from: http://www.ars.usda.gov/SP2UserFiles/ Place/12355000/pdf/0506/usual_nutrient_intake_vitD_ ca_phos_mg_2005-06.pdf
17. NCC. Nutrition Coordinating Center. Nutrition Data System For Research – NDS-R. Features. [cited 2012 Jan 26]. Available from: http://www.ncc.umn.edu/ products/ndsrfeatures.html
18. Palacios C. The role of nutrients in bone health, from A to Z. Crit Rev Food Sci Nutr. 2006;46(8):621-8. DOI:10.1080/10408390500466174
19. Parahyba MI, Simões CCS. A prevalência de incapacidade funcional em idosos no Brasil. Cien Saude Coletiva. 2006;11(4):967-74. DOI:10.1590/S1413-81232006000400018
20. Parahyba MI, Veras RP, Melzer D. Incapacidade funcional entre as mulheres idosas no Brasil.
Rev Saude Publica. 2005;39(3):383-91.
DOI:10.1590/S0034-89102005000300008
21. Ross AC, Manson JE, Abrams AS, Aloia JF, Brannon PM, Clinton SK, et al. The 2011 Dietary Reference Intakes for calcium and vitamin D: what dietetics
The authors declare that there are no confl icts of interest.
This manuscript was submitted for publication and underwent a peer review process as any other manuscripts submitted to this publication, and anonymity was guaranteed for authors and reviewers. Editors and reviewers declare no confl icts of interest that may affect the peer-review process.
and practitioners need to now. J Am Diet Assoc. 2011;111:524-527.
22. Subar AF, Dodd KW, Guenther PM, Kipnis V, Midthune D, McDowell M, et al. The food propensity questionnaire: concept, development, and validation for use as a covariate in a model to estimate usual food intake. J Am Diet Assoc. 2006;106(10):1556-63. DOI:10.1016/j.jada.2006.07.002
23. Tabacchi G, Wijnhoven TMA, Branca F, Román-Viñas B, Ribas-Barba L, Ngo J, et al. How is the adequacy of micronutrient intake assessed across Europe? A
systematic literature review. Br J Nutr. 2009;101(Suppl 2):S29-36. DOI:10.1017/S0007114509990560
24. Tooze JA, Midthune D, Dodd KW, Freedman LS, Krebs-Smith SM, Subar AF, et al. A new statistical method for estimating the usual intake of episodically consumed foods with application to their
distribution. J Am Diet Assoc. 2006;106(10):1575-87. DOI:10.1016/j.jada.2006.07.003