*Correspondence: L. C. Silva. Faculdade de Farmácia, Universidade Federal do Rio de Janeiro. Av Carlos Chagas Filho, 373. Sala 31, 21941902 – Rio de Janeiro – RJ, Brasil. E-mail: [email protected]
A
vol. 50, n. 2, apr./jun., 2014 http://dx.doi.org/10.1590/S1984-82502014000200008
Preparation and scale up of extended-release tablets of
bromopride
Guilherme Neves Ferreira
1,2, Marcos Giovani Rodrigues Silva
1, Aline Guerra Manssour Fraga
1,
Luiz Cláudio Rodrigues Pereira da Silva
1,*, Luiz Marcelo Lira
1, Carlos Rangel Rodrigues
1, Helena
Carla Castro
3,
Valéria Pereira de Sousa
1, Lucio Mendes Cabral
11Faculty of Pharmacy, Federal University of Rio de Janeiro, Rio de Janeiro, RJ, Brazil, 2Roche Chemicals and Pharmaceuticals, Rio de Janeiro, RJ, Brazil, 3Institute of Biology, Fluminense Federal University, RJ, Niterói, Brazil
Reproducibility of the tablet manufacturing process and control of its pharmaceutics properties depends on the optimization of formulation aspects and process parameters. Computer simulation such as Design of Experiments (DOE) can be used to scale up the production of this formulation, in particular for obtaining sustained-release tablets. Bromopride formulations are marketed in the form of extended-release pellets,
which makes the product more expensive and dificult to manufacture. The aim of this study was to
formulate new bromopride sustained release formulations as tablets, and to develop mathematical models to standardize the scale up of this formulation, controlling weight and hardness of the tablets during manufacture according to the USP 34th edition. DOE studies were conducted using Minitab™ software. Different excipient combinations were evaluated in order to produce bromopride sustained-release matrix tablets. In the scale-up study, data were collected and variations in tableting machine parameters were measured. Data were processed by Minitab™ software, generating mathematical equations used for prediction of powder compaction behavior, according to the settings of the tableting machine suitable for scale-up purposes. Bromopride matrix tablets with appropriate characteristics for sustained release were developed.
The scale-up of the formulation with the most suitable sustained release proile was established by using
mathematical models, indicating that the formulation can be a substitute for the pellets currently marketed.
Uniterms: Bromopride/extended-release tablets/preparation. Design of experiments. Extended-release tablets/scale up obtention. Direct compression. Tablets/kinetics release.
A reprodutibilidade do processo de fabricação de comprimidos e o controle das suas propriedades farmacotécnicas depende da otimização dos aspectos de formulação e dos parâmetros de processo. O planejamento de experimentos como o Desenho de Experimentos (DOE) pode ser utilizado para acelerar a produção desta formulação, em particular, para a obtenção de comprimidos de liberação prolongada. Formulações de bromoprida são comercializadas sob a forma de péletes de liberação prolongada, o que torna o produto caro e de difícil fabricação. O objetivo deste estudo foi preparar novas formulações de bromoprida de liberação prolongada na forma de comprimidos e desenvolver modelos matemáticos visando ao escalonamento destas formulações, controlando o peso e a dureza dos comprimidos durante a fabricação, de acordo com a 34ª Edição da USP. Estudos de DOE foram realizados utilizando o software Minitab™. Diferentes combinações de excipientes foram avaliadas visando à obtenção dos comprimidos de liberação prolongada de bromoprida. No estudo de scale-up, coletaram-se e mediu-se a inluência das variações nos parâmetros da máquina de compressão. Processaram-se os dados obtidos pelo software Minitab ™, gerando equações matemáticas aptas para a previsão do comportamento de compactação do pó em escala industrial. Os comprimidos obtidos apresentavam características adequadas em termos de liberação sustentada, sendo a cinética de liberação estabelecida utilizando modelos matemáticos, indicando que esta formulação pode ser uma substituta aos péletes de bromoprida atualmente comercializados.
INTRODUCTION
T h e i n t e r n a t i o n a l q u a l i t y s t a n d a r d s o f
pharmaceuticals, as recommended by pharmacopeias and regulatory agencies, state the importance of robust manufacturing processes, in order to ensure both minimal variation between batches and adequate formulation development. Oral solid dosage forms must be compliant to mass and content uniformity as indicators of robustness, where this is even more relevant for sustained-release
direct compression formulations (Tiwari,
Rajabi-Siahboomi, 2008).
Validation and manufacturing process control are
therefore key elements in preventing “out-of-speciication”
production. Mass and content uniformity can be indirectly evaluated by hardness and weight variations of tablets produced during the fabrication process. It is important to consider, besides pharmacopeia regulations, the statistical process control indicators, as these are associated with either formulation or process variations (Gershon, 1991).
A m o n g t h e d i ff e r e n t t e c h n i q u e s u s e d f o r manufacturing tablets, direct compression is the most
practical and cost-effective (Jivraj, Martini, Thomson,
2000; McCormick, 2005). For this process, tablets are obtained from the mixture of active ingredient and diluents, followed by the addition of lubricants, disintegrants and,
inally, by compression of the inal mixture. This method
may be employed for immediate and extended-release
forms (Skelly et al., 1993). Comparatively, the direct
compression method has proven be much simpler, faster and cheaper than other techniques for producing
sustained-release solid dosage forms. Thereby is more attractive in
industrial terms than encapsulation techniques, particularly those involving coated pellet or microgranule preparation processes, as used to prepare bromopride (BPD) capsules
(Wertheimer et al., 2005). The development of new
sustained-release BPD tablets represents an industrial solution for cost reduction, leading to a more reproducible
batch to batch drug release proile.
Mathematical models in compression processes and their optimization (Ivic et al., 2010; Yu, 2008; Charoo et al., 2012) stand out as useful tools for tablets manufacturing scale up, particularly for direct compression. Likewise, the development of a robust and rational formulation may help toward preventing process deviation and ensuring
dissolution proile reproducibility in sustained-release
tablet preparation (Bagchi, Li, Plakogiannis, 2012).
Thus, the aim of this study was the development
and scale-up of new BPD sustained-release tablets using hydrophilic matrix by direct compression, using mathematical optimization based on Design of
Experiments (DOE). The proposed formulation is a
cheaper alternative to the commercial BPD encapsulated pellets, which have a higher manufacturing complexity and cost.
MATERIAL AND METHODS
Material
The BPD reference chemical substance was obtained
from Genix (produced as described by ISO guide 34;
purity 99.95%). Digesan®Retard - RLD (Sanoi-Aventis),
sustained-release capsules containing coated pellets loaded containing 20 mg of BPD, were obtained from the market (batches 7051315 and 7051317). Ethyl cellulose (EC) 50 mPas was purchased from Sigma-Aldrich (São Paulo, Brazil) whereas hydroxypropyl methylcellulose (HPMC) 100.000 mPas for small and large-scale batches
was purchased from Shin-Etsu Chemical (Tokyo,
Japan). Lactose alpha monohydrate and Viscogel® B8
(VB8) bentonite modified with octadecylamine salt were purchased from Shin-Etsu Chemical Co. Ltd-
(Tokyo, Japan) and Bentec (Livorno, Italy), respectively.
Microcrystalline cellulose PH 102 (MC-102) was purchased from Blanver (São Paulo, Brazil). Magnesium stearate (MS) and talc were supplied by AMC (São Paulo, Brazil). Bromopride (active pharmaceutical ingredient) was provided by Genix (São Paulo, Brazil). Dissolution media were prepared according to the United States
Pharmacopeia 34 (USP 34, 2011). Water was puriied by
Permution RO 0320 reverse osmosis (Permution, Brazil).
Tablet manufacture
The development of BPD sustained-release tablets
was performed in low-scale batches with 1.0 kg of
powder mixture. The sustained-release matrix and BPD
were mixed in a pilot 6L V mixer for 30 min and then the external phase was added and mixed during 5 min and compressed using a 9.0-mm biconcave punch. For the large-scale batch with the ideal new BPD
sustained-release formulation (200 kg) and for process qualiication
with lactose/cellulose placebo, all components, except magnesium stearate, were previously mixed in a stainless steel cubic mixer having a 1200 L capacity during 30 min at 6 rpm, with rotation direction reversed every 3 min. Subsequently, lubricant was added and mixed for 5 min and the mixture obtained was directly compressed using
a Kilian model T400 compressor machine with 55 sets of
BPD sustained-release tablet formulations
BPD tablets were formulated as an alternative to
coated pellets marketed in capsules. The tablets were
prepared by combining several different swelling sustained-release matrices and 1.0% w/w magnesium stearate added
as lubricant. The HMPC 100.000 mPas, ethyl cellulose
50 mPas (Abdel-Rahman, Mahrous, El-Badry, 2009) and Viscogel B8 (Dornelas et al., 2008) were tested as sustained-release matrices at drug:matrix mass ratios of 1:0.5 to 1:3. All formulations were prepared in triplicate.
Tablet characterization
The BPD content test was carried out according
t o U S P 3 4 u s i n g a S h i m a d z u U V- 1 6 0 A U V- Vi s
spectrophotometer (Tokyo, Japan). Tablet physical properties, such as friability (SOTAX F1 Y-600-01
friability tester, Switzerland) and hardness (Nova Ética
298-ATTS hardness tester, Brazil), were evaluated
according to the USP 34 monograph of BPD tablet
(USP 34, 2011). The dissolution test was performed on a
Hanson Research SR8PLUS automatic dissolution system (Chatsworth, CA, USA) using previously filtered and
degassed simulated gastric luid (SGF) as the dissolution
media, prepared as recommended by USP 34. Dissolution
proiles were compared by independent and
model-dependent methods (Mourao et al., 2010).
Experimental design
A mathematical model was proposed for describing hardness and weight variation (response variables) in the BPD tablet production related to process parameter adjustment in
right side (RS) and left side (LS) of compressor machine. The
continuous or independent variables selected for test weight variation were rotation velocity (rpm), directly related to the
number of units produced per hour, and the modiications
of dosing system position (mm), which determines the position of lower punches within the matrix at the moment
of illing. Similarly, minimum distances between upper and
lower punches and the distance between upper punch top and compaction roll at maximum compression point were selected as continuous variables for testing the hardness variation. Maximum and minimum limits of each parameter tested were chosen based on the best conditions obtained
during the performance qualiication of Kilian T400 tableting machine using lactose/cellulose placebo. Thus, experimental
batches were prepared applying a combination of different rotation velocities of 400,000 and 100,000 tablets/h; dosing system position 4.0 and 6.0 mm; punch distances 0.7 and 2.0
mm; and upper punch distance 2.2 and 3.0 mm. A factorial DOE study with 16 runs (24 factorial model) was developed
in order to evaluate the robustness of the experimental
data. Two responses were studied, namely, tablet weight
and hardness after compaction. Samples of 70 tablets were taken per batch for each side of the tablet machine, LS and RS (left and right sides). All data (16 batch/tablet machine side) were then analyzed using Minitab™ version 7 software
(Minitab™ Inc., Pennsylvania, US), generating mathematical
equations which correlated all parameters and settings used throughout the tests. For all measurements, variables with significant influence on mean weight and hardness parameters were considered as those that had p < 0.05. R-Sq
deined the degree of conidence of the resulting equation, in
other words, the experiment behavior according to the given
equation. The correlation model obtained (Poisson, linear Pearson or Spearman) shows the inluence of the equation
and, therefore, the variability of weight and hardness, as well as the interaction between them.
Statistical analysis
In vitro release kinetics was evaluated by the following models (Equations 1 to 5):
Q0 - Qt = K0*t Zero order (Equation 1)
ln (Q0 – Qt) = K1*t First order (Equation 2)
Qt = KH*t1/2 Higuchi (Equation 3)
Qt = Kp*tn Korsmeyer and Peppas (Equation 4)
W01/3 – Wt1/3
= Ks*t Hixson‐Crowell (Equation 5)
Where Qt is the concentration of the drug released at time t and Q0 is the concentration of drug released at time zero;
K0, K1 and KH are the coeficients of Zero Order, First
Order and Higuchi equations, respectively. In equation 4, Kp is the constant incorporating structural and geometric characteristics of the release device and n is the release exponent indicating the release mechanism. In equation 5, Ks is a constant incorporating drug surface-volume relation and. W0 and Wt are de mass of the drug molecule initially and at time t, respectively.
Average data sets of released BPD were assessed
by variance analysis (One Way ANOVA), with
a significance level of 0.05 using Statistica 9.0 software
The applied methods for the in vitro dissolution
proiles comparison are model-dependent methods, and
(Moore, Flanner, 1996; FDA, 2003; Asare-Addo et al., 2010; Escudero, Ferrero, Jimenez-Castellanos, 2010).
(Equation 6)
(Equation 7)
RESULTS AND DISCUSSION
BPD tablet preparation and evaluation
Different sustained-release matrices were tested in order to obtain a new formulation with a suitable BPD release profile I. All matrix concentration that do not led to a controlled release profile were excluded from
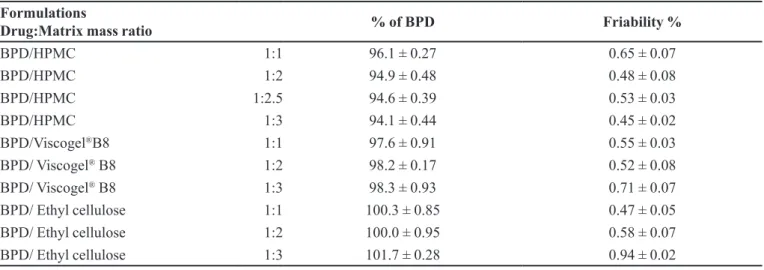
the study, by listing in Table I only those that showed a sustained release proile of BPD. All tablets produced had
satisfactory friability values and BPD dose values in the tested formulations were according to USP 34 monograph
speciications, 90.0 -110.0% (Table I).
Three different extended-release matrices were
studied, HPMC, ethyl cellulose and Viscogel® B8 with
BPD:matrix mass ratio range of 1:1 to 1:3. HPMC and ethyl cellulose matrices are usually used in sustained-release tablet preparation (Velasco et al., 1999;
Abdel-Rahman, Mahrous, El-Badry, 2009). However, Viscogel®
B8 was not a usual matrix, but had been used previously by our research group with good results for production
of theophylline sustained-release tablets (Dornelas et al.,
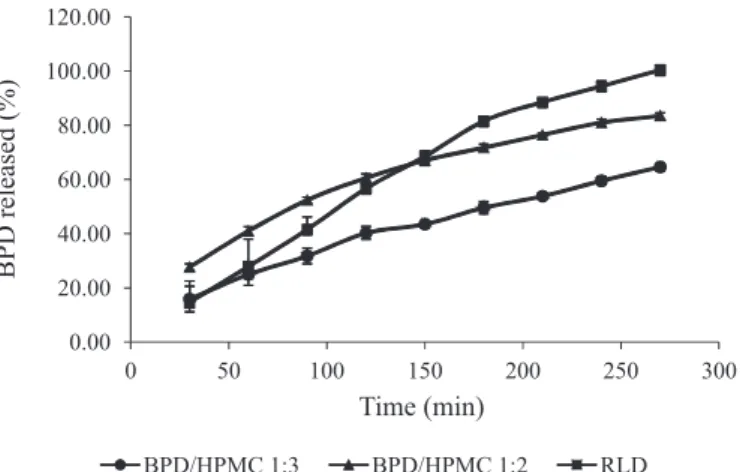
2011). A comparable dissolution proile was only obtained with the use of HPMC 100000 mPas (Table II and Figure 1) as the sustained-release matrix. The tablets produced
with Viscogel® B8 showed good sustained-release
behavior, but were less eficient than other tested matrices,
indicating that release from this matrix was dependent on drug physicochemical properties and drug loading, being more suitable for lipophilic drugs (Korsmeyer et al., 1983; Velasco et al., 1999; Dornelas et al., 2011).
For HPMC tablets, dissolution studies showed an adequate sustained-release profile of BPD for the formulations tested (Figure 1), with a maximum of 30% of drug released within 20 min using SGF as the
TABLE II - Percentage of BPD dissolved from different sustained-release matrix in SGF after 60 min
SAMPLE % Dissolved in SGF (60 min)
RLD 22.66 ± 3.94
BPD/HPMC
1:1 50.02 ± 3.07
1:2 42.06 ± 2,75
1:3 29.36 ± 2.15
BPD/VCG
1:1 101.49 ± 1.47
1:2 88.12 ± 3.72
1:3 106.64 ± 3.21
BPD/EC
1:1 90.51 ± 0.85
1:2 82.13 ± 1.79
1:3 88.12 ± 6.01
Mean ± RSD. TABLE I - Composition and properties of different formulations of BPD matrix tablets
Formulations
Drug:Matrix mass ratio % of BPD Friability %
BPD/HPMC 1:1 96.1 ± 0.27 0.65 ± 0.07
BPD/HPMC 1:2 94.9 ± 0.48 0.48 ± 0.08
BPD/HPMC 1:2.5 94.6 ± 0.39 0.53 ± 0.03
BPD/HPMC 1:3 94.1 ± 0.44 0.45 ± 0.02
BPD/Viscogel®B8 1:1 97.6 ± 0.91 0.55 ± 0.03
BPD/ Viscogel® B8 1:2 98.2 ± 0.17 0.52 ± 0.08
BPD/ Viscogel® B8 1:3 98.3 ± 0.93 0.71 ± 0.07
BPD/ Ethyl cellulose 1:1 100.3 ± 0.85 0.47 ± 0.05
BPD/ Ethyl cellulose 1:2 100.0 ± 0.95 0.58 ± 0.07
BPD/ Ethyl cellulose 1:3 101.7 ± 0.28 0.94 ± 0.02
dissolution medium for all tested BPD: matrix mass
ratios. The BPD:HPMC mass ratio of 1:1 showed a
drug release of 32.0% in 30 min bearing no similarity to Digesan capsules, while the mass ratio of 1:2 released
only 28.39% at the same time interval. The formulation
BPD/HPMC 1:3 exhibited an excessive delay in drug release, failing to attain 80% drug release by the end of
the dissolution test (Table II). Compared to the Digesan
commercial formulation, the BPD/HPMC 1:2 formulation
showed a very similar drug release proile, demonstrating
the possibility of using the direct compression production method for industrial purposes, with only drug, matrix and lubricant in the tablet composition (Figure 1).
The dissolution proile was considered similar only
for BPD/HPMC 1:2 tablets, where the difference (f1)and
similarity (f2)factors calculated were 12.08 and 50.65, respectively. Korsmeyer-Peppas release kinetics showed the best correlation for both formulations in SGF media,
yielding calculated correlation coeficients of 0.995 for
Digesan® and 0.990 for BPD/HPMC 1:2. These results
demonstrate the feasibility of obtaining an alternative formulation with greater robustness and lower cost compared to the reference product based on encapsulated coated pellets.
Design of experiments
After choosing the optimal sustained-release formulation, DOE studies were performed using BPD/
HPMC 1:2 powder mixture for scale-up purposes. The
following BPD tablet parameters were established for
this study after tablet machine qualiication with lactose/
cellulose placebo: cylindrical biplanar morphology;
FIGURE 1 - Dissolution proiles of bromopride tablets: BPD/ HPMC 1:3; BDP/HPMC 1:2; Reference Label Drug in 0.1 M HCl dissolution media.
diameter between 8.80 and 9.20 mm; thickness between 2.20 and 2.70 mm; hardness between 34 and 103 N; average weight 200 mg ± 3%. Four independent variables that exert the most impact on weight and hardness for the compression process were studied. Rotation velocity and dosing system position were studied on the weight variation, while distances between two punches and distance between upper punch top and compaction roll (compaction roll setting) were evaluated on hardness variation. Responses were measured at two outputs of the tablet machine feeders, to the right and left sides. After data collection, the factorial design results was analyzed using the Minitab™ software to
ascertain the inluence of the cited independent variables on
the studied responses (mean weight and hardness), as well as the correlation with equations which determine these interdependencies, the degree of interaction, and percentage
of conidence of measurements. All DOE results obtained are given in Tables III to VIII and Figure 2.
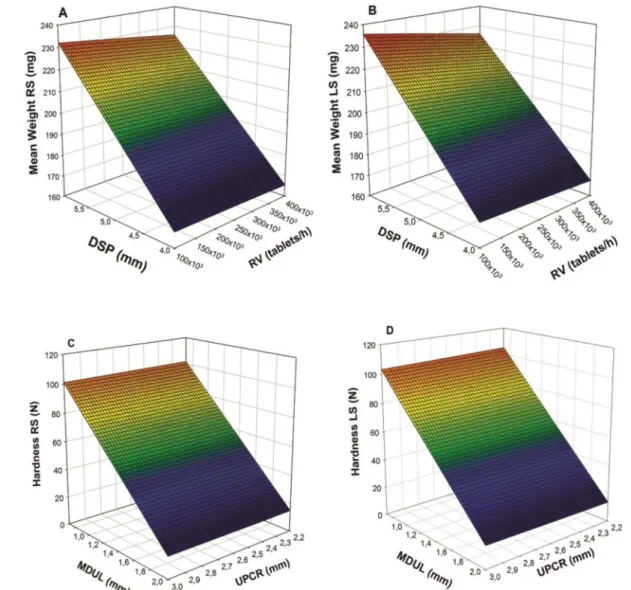
It is evident that the dosing system position and
rotation velocity (rpm) parameters had an inluence on
the weight variation of the tablets, exerting a positive and negative effect, respectively. Based on these results, it can also be inferred from the overall process that interaction among these factors had occurred resulting in a negative effect on mean weight (Figure 2A and Figure 2B).
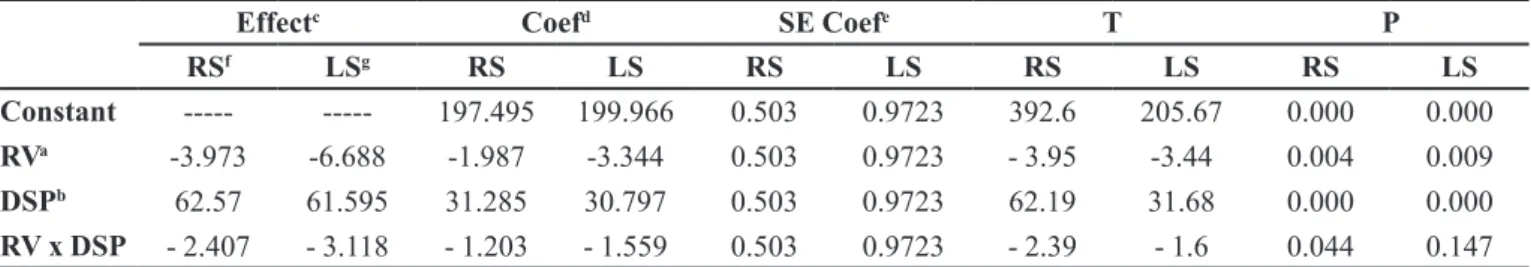
In terms of weight adjustment of the right side of the machine, the dosing system position variable showed
great inluence on tablet weight, since the measured values
had a positive correlation standardized effect and this
variable had a greater inluence on weight than did the
rotation velocity parameter (rpm). An interaction among
all parameters in the equation deining weight variation
behavior was also noted by a negative effect value of
-2.407 (Table III, IV, Figure 2 A).
On the left side (LS) of the machine, dosing system position and rotation velocity variables (rpm)
displayed a similar inluence. The interaction, however,
between these two parameters is described by a negative
correlation standardized effect value of -3.118 (Table III
and Figure 2B).
The response surface graph of mean weight
response variable on the right side (Figure 2A) and left
side (Figure 2B) shows a slight inluence of DSP and RV
interaction. On both sides, the DSP independent variable
showed greater inluence than RV on tablets mean weight,
TABLE III - Estimated effects and coeficients for mean weight
Effectc Coefd SE Coefe T P
RSf LSg RS LS RS LS RS LS RS LS
Constant --- --- 197.495 199.966 0.503 0.9723 392.6 205.67 0.000 0.000
RVa -3.973 -6.688 -1.987 -3.344 0.503 0.9723 - 3.95 -3.44 0.004 0.009
DSPb 62.57 61.595 31.285 30.797 0.503 0.9723 62.19 31.68 0.000 0.000
RV x DSP - 2.407 - 3.118 - 1.203 - 1.559 0.503 0.9723 - 2.39 - 1.6 0.044 0.147
a – RV: rotation velocity; b – DSP: dosing system position; c - Effect: Effect size; d - Coef.:Estimated Coeficients; e - SE Coef.: Standard error of estimated coeficient; f-RS: right side; g – LS: left side.
in mechanical adjustment in relation to the right side. Furthermore, the independent variable RV caused small changes on tablets mean weight of approximately 231 mg (100,000 tablets/hour) to 225 mg (400,000 tablets/ hour) while DSP independent variable DSP was constant at 6.0 mm.
Varying RV independent variable from 100,000 to 400,000 tablets/hour and keeping DSP constant at 6.0 mm on right side there is a variation of 6.38 mg on mean weight response variable. In the other hand, on the left side this
variation is 9.81 mg, showing the higher inluence of RV on this side, conirming the differences on mechanical
adjustments between the two sides.
Concerning the studies of variations in hardness, similar results were obtained for both outputs sides of the machine. For the RS, only the distance between punches
(MDUL) was detected as an inluential parameter, since
neither compression roll setting (UPCR) nor interaction
between these variables inluenced the hardness outcome. The same behavior was found for the LS of the tableting machine (Tables IV and VI; Figure 2C and 2D). The
response variable hardness showed no such interactions variables on both sides, showing that the only factor that really alters the hardness response variable is MDUL.
It is important to note that the machine settings used in this work are made by hand wheels, which are not very
TABLE IV - Estimated effects and coeficients for hardness
Effectc Coefd SE Coefe T P
RSf LSg RS LS RS LS RS LS RS LS
Constant --- --- 58.07 59.38 0.2562 0.4097 226.64 144.92 0.000 0.000
MDULa -86.59 -89.53 -43.30 -44.77 0.2562 0.4097 -168.96 -109.26 0.000 0.000
UPCRb -0.26 -0.01 -0.13 0.000 0.2562 0.4097 -0.50 -0.01 0.630 0.991
MDUL x UPCR 0.43 1.76 0.21 0.880 0.2562 0.4097 0.84 2.15 0.426 0.064
a – MDUL: minimum distances between upper and lower punches; b – UPCR: distance between upper punch top and compaction
roll at maximum compression; c - Effect: Effect size; d - Coef.: Estimated Coeficients; e - SE Coef.: Standard error of estimated
coeficient; f – RS: right side; g – LS: left side.
accurate, but that perfectly met the aim of this work. The
main goal of DOE studies in this work was to understand how the response changes in a given direction by adjusting the design independent variables.
Taken together, the results obtained from all the equations (Table V, TableVI) indicate it is mathematically
possible to state that experiments will reproduce according to the mathematical models in 99% of cases (R-Sq).
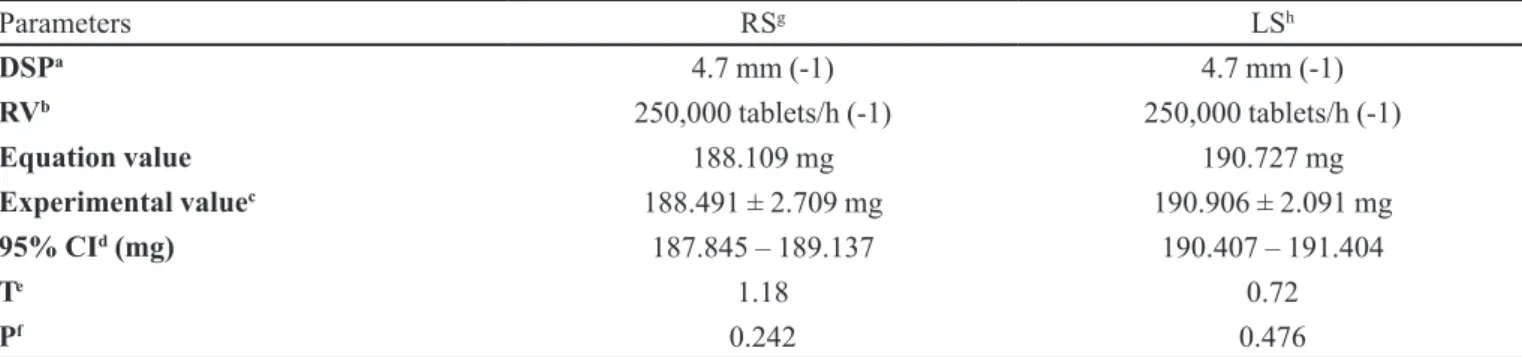
After establishing the equations that defined tableting machine behavior, based on the BPD/HPMC 1:2 powder mixture for direct compression tablet manufacture, tests were performed with other three batches in order to check mean weight and hardness. For this purpose, values lying within the limits of the parameters used to determine the applicability of these equations were adopted in order to prove the robustness of the DOE method. Subsequently, some values were randomly selected from within each parameter range and used to produce a tablet batch, sampling tablets from the tablet machine, measuring their average weight and hardness on
both sides (LS and RS). These experimental values (weight
of 70 tablets and hardness of 35 tablets, on both sides) were compared to those mathematically obtained using the equations, in order to verify whether the calculated values were within possible limits, considering the
FIGURE 2 - Response surface graph of (A) mean weight RS vs DSP vs RV; (B) mean weight LS vs DSP vs RV; (C) hardness RS vs MDUL vs UPCR; (D) hardness LS vs MDUL vs UPCR.
TABLE V - Mean weight equations for RS and LS of tablet machine
Machine side Sc R-Sqd R-Sq (adj)e Mean Weight Equation
RSa 1.74259 99.79% 99.72% 197.495 – 1.987 x (RVf) + 31.285 x (DSPg) – 1.203 x (RVf x DSPg)
LSb 3.36809 99.22% 98.93% 199.966 – 3.344 x (RVf) + 30.797 x (DSPg)
a - RS: right side; b - LS: left side; c - S: square root of mean square error; d - R-Sq: estimated R square; e - R-Sq (adj): estimated adjusted R square; f - RV: rotation velocity; g - DSP: dosing system position.
TABLE VI - Hardness equations for RS and LS of tablet machine
Machine side Sc R-Sqd R-Sq (adj)e Hardness Equation
RSa 0.88767 99.97% 99.96% 58.07 – 43.30 x (MDULf)
LSb 1.4193 99.93% 99.91% 59.38 – 44.77 x (MDULf)
was carried out employing the ONE SAMPLE T tool in
the Minitab™ software package. The results demonstrated
that, at these two random levels (Table VII, TableVIII),
statistically relevant mean weight and hardness values were obtained that were very close to predicted results, thus confirming the predictive capacity of the derived equations. Korsmeyer-Peppas release kinetics showed the best correlation for the three new batches produced were formulations in SGF media, yielding calculated correlation
coeficients ranging from 0.989 to 0.991, with the amount
of drug dissolved and dissolution profile showing no statistical differences (p>0.05).
CONCLUSIONS
This work allowed the obtention of a robust new
BPD extended-release formulation for use on a large scale, that proved simpler and less expensive than the commercial
formulation (capsule containing coated pellets, the reference product), representing a viable alternative for the manufacture of low dosage drugs in sustained-release solid
oral formulations. The use of Viscogel B8 as the
sustained-release matrix was suggested for lipophilic drugs, but more
detailed study must be conducted to conirm this proposal.
Different HPMC concentrations were tested to obtain a tablet with appropriate release kinetics, reinforcing the use of this excipient as the best matrix for sustained release. In the scale-up studies, the BPD/HPMC 1:2 powder mixture showed better results when subjected to the compression process on a Kilian 400 tableting machine. After analyzing the results and comparing them to responses, was observed that maximum variation between the theoretical values and those obtained on practical tests (residual) did not exceed 3.10%, showing that the new formulation obtained is reproducible and robust, suitable for the preparation of new BPD generic medicines. It is also noted that both
TABLE VII - Mean weight challenge test
Parameters RSg LSh
DSPa 4.7 mm (-1) 4.7 mm (-1)
RVb 250,000 tablets/h (-1) 250,000 tablets/h (-1)
Equation value 188.109 mg 190.727 mg
Experimental valuec 188.491 ± 2.709 mg 190.906 ± 2.091 mg
95% CId (mg) 187.845 – 189.137 190.407 – 191.404
Te 1.18 0.72
Pf 0.242 0.476
a – RV: rotation velocity; b – DSP: dosing system position; c - Experimental value: average ± SD; d – CI: conidence interval; e - T: Indicates direction and degree to which a sample mean difference is distant from null hypothesis (H0) in a range of standard
deviation units; f - P: p-value is probability of obtaining a statistic test at least as extreme as that observed, assuming null hypothesis is true; g – RS: right side; h – LS: left side.
TABLE VIII - Hardness challenge test
Parameters RSg LSh
MDULa 1.3 mm (-1) 1.3 mm (-1)
UPCRb 2.4 mm (-1) 2.4 mm (-1)
Equation value 61.101 N 62.513 N
Experimental valuec 60.4677 ± 4.26 N 64.058 ± 4.66 N
95% CId (N) 59.0043 – 61.9311 62.4588 – 65.6580
Te -0.88 1.96
Pf 0.385 0.058
a – MDUL: minimum distances between upper and lower punches; b – UPCR: distance between upper punch top and compaction
roll at maximum compression; c - Experimental value: average ± SD; d – CI: conidence interval; e -T: Indicates direction and
sides of the compressor machine presented negative
inluence by DSP and RV interaction. Left side presented higher inluence of RV factor than right side, conirming
mechanical differences on machine adjustment. Hardness
was not inluenced by independent variables interactions on both sides, which showed similar proiles in hardness
changes.
This study applies to several purposes, among which can be highlighted: The rapid adjustment of compressor
machine, productivity increase, reduction of waste production; rational use of raw materials, reduction of environmental impacts by destruction of production waste.
ACKNOWLEDGMENTS
This work was supported by FAPERJ, CAPES Edital
CAPES Nanobiotecnologia 2008 and CNPq.
REFERENCES
ABDEL-RAHMAN, S.I.; MAHROUS, G.M.; EL-BADRY, M. Preparation and comparative evaluation of sustained release metoclopramide hydrochloride matrix tablets. Ann. Saudi Med., v.17, p.283-288, 2009.
ASARE-ADDO, K.; LEVINA, M.; RAJABI-SIAHBOOMI, A . R . ; N O K H O D C H I , A . S t u d y o f d i s s o l u t i o n hydrodynamic conditions versus drug release from
hypromellose matrices: the inluence of agitation sequence.
Colloids Surf. B Biointerfaces, v.81, p.452-60, 2010.
BAGCHI, S.; LI, W.; PLAKOGIANNIS, F. Optimization and prediction of drug release from matrix tablets using response surface methodology and near infrared chemical imaging. Pharm. Dev. Technol., v.17, p.398-406, 2012.
C H A R O O, N.A.; S H A M S H E R, A.A.; Z I D A N, A.S.; RAHMAN, Z. Quality by design approach for formulation development: a case study of dispersible tablets. Int. J. Pharm., v.423, p.167-178, 2012.
DORNELAS, C.B.; SILVA, A.M.; DANTAS, C.B.; RODRIGUES, C.R.; COUTINHO, S.S.S.; SATHLER, P.C.; CASTRO, H.C.; DIAS, L.R.S.; SOUZA, V.P.;
CABRAL, L.M. Preparation and evaluation of a new nano pharmaceutical excipients and drug delivery system based in polyvinylpyrrolidone and silicate. J. Pharm. Pharm. Sci., v.14, p.17-35, 2011.
DORNELAS, C.B.R.; RESENDE, D.K.; ROCHA, H.V.A.;
GOMES, A.S.; TAVARES, M.I.B.; COUTINHO, S.S.S.;
CABRAL, L.M. Avaliação de derivados poliméricos intercalados em montmorilonita organofílica na preparação
de novos materiais de uso farmacêutico. Polímeros, v.18, p.222-229, 2008.
E S C U D E R O , J . J . ; F E R R E R O , C . ; J I M E N E Z
-CASTELLANOS, M.R. Compaction properties, drug
release kinetics and fronts movement studies from matrices combining mixtures of swellable and inert polymers. II. Effect of HPMC with different degrees of methoxy/ hydroxypropyl substitution. Int. J. Pharm., v.387, p.56-64, 2010.
FOOD AND DRUG ADMINISTRATION. FDA. Guidance
for Industry. Bioavailability and Bioequivalence Studies or Orally Administered Drug Products - General Considerations. Rockville: US Food and Drug Administration, 2003. Available at: http://www.fda.gov/ downloads/Drugs/.../Guidances/ucm070124.pdf. Accessed
on: March 20th 2014.
GERSHON, M. Statistical process control for the pharmaceutical industry. J. Parenter. Sci. Technol., v.45, p.41-50, 1991.
IVIC, B.; IBRIC, S.; CVETKOVIC, N.; PETROVIC, A.;
TRAJKOVIC, S.; DJURIC, Z. Application of design of
experiments and multilayer perceptrons neural network in the optimization of diclofenac sodium extended release tablets with carbopol (R) 71G. Chem. Pharm. Bull., v.58, p.947-949, 2010.
JIVRAJ, M.; MARTINI, L.G.; THOMSON, C.M. An overview
of the different excipients useful for the direct compression of tablets. Pharm. Sci. Technol.. Today, v.3, p.58-63, 2000.
KORSMEYER, R.W.; GURNY, R.; DOELKER, E.; BURI, P.; PEPPAS, N.A. Mechanisms of solute release from porous hydrophilic polymers. Int. J. Pharm., v.15, p.25-35, 1983.
MCCORMICK, D. The principles of direct compression haven’t
changed in more than a century. So why can the topic still pack a ballroom? Evolutions in direct compression. Pharm. Technol., special issue, p.52-62, 2005.
MOORE, J.W.; FLANNER, H.H. Mathematical Comparison
of curves with an emphasis on in vitro dissolution proiles.
MOURAO, S.C.; DA SILVA, C.; BRESOLIN, T.M.B.; SERRA,
C.H.R.; PORTA, V. Dissolution parameters for sodium
diclofenac-containing hypromellose matrix tablet. Int. J. Pharm., v.386, p.201-207, 2010.
SKELLY, J.P.; VAN BUSKIRK, G.A.; SAVELLO, D.R.;
AMIDON, G.L.; ARBIT, H.M.; DIGHE, S.; FAWZI, M.B.;
GONZALEZ, M.A.; MALICK, A.W.; MALINOWSKI, H. Scaleup of immediate release oral solid dosage forms. Pharm. Res., v.10, p.2313-2316, 1993.
TIWARI, S.B.; RAJABI-SIAHBOOMI, A.R. Extended-release
oral drug delivery technologies: monolithic matrix systems. Methods Mol. Biol., v.437, p.217-243, 2008.
UNITED STATES PHARMACOPEIA. USP 34. NF 29.
Rockville: United States Pharmacopeia Convention, 2011.
VELASCO, M.V.; FORD, J.L.; ROWE, P.; RAJABI-S I A H B O O M I , A . R . I n f l u e n c e o f d r u g : hydroxypropylmethylcellulose ratio, drug and polymer particle size and compression force on the release of diclofenac sodium from HPMC tablets. J. Control. Release, v.57, p.75-85, 1999.
WERTHEIMER, A.I.; SANTELLA, T.M.; FINESTONE, A.J.;
LEVY, R.A. Drug delivery systems improve pharmaceutical
proile and facilitate medication adherence. Adv. Ther., v.22, p.559-577, 2005.
YU, L.X. Pharmaceutical quality by design: product and process development, understanding, and control. Pharm. Res., v.25, p.2463-2473, 2008.
Received for publication on 25th April 2013