Vignettes and diferential health reporting:
results from the Japanese
World Health Survey
Vinhetas e relatos diferenciais na saúde: os
resultados do estudo japonês da
Pesquisa
Mundial de Saúde
Viñetas y relatos diferenciales en la salud: los
resultados del estudio japonés de la
Encuesta
Mundial de Salud
Md. Ismail Tareque 1 Nayu Ikeda 2 Atsushi Koshio 3 Toshihiko Hasegawa 4
Abstract
We examined the factors associated with the evaluation of health description vignettes and how Japanese people make decisions related to the eight health dimensions (mobility, emotions, pain, relationship with others, sleep and ener-gy, vision, recognition/remembering abilities, and self-care). We investigated
a dataset of 4,959 respondents (≥ 18 years) from the Japanese World Health
Survey. Ordered probit models were used to identify factors associated with all health dimensions. On all dimensions, older people appraised extreme problems as less problematic than did younger people did. Compared to with men, women reported greater severity in the case of extreme problems on three health dimensions: emotion, pain, and sleep/energy. The study also found negative effects of alcohol consumption in almost all dimensions. Doctors and other health care workers should be careful when assessing severity of health problems in elderly older individuals; in this population, health problems may be more severe than reported.
Consumer Health Information; Health Surveys; Health Promotion
Correspondence
M. I. Tareque
Department of Population Science and Human Resource Development, University of Rajshahi.
Rajshahi-6205, Bangladesh. [email protected]
1 Department of Population Science and Human Resource Development, University of Rajshahi, Rajshahi, Bangladesh. 2 Center for International Collaboration and Partnership, National Institute of Health and Nutrition, Tokyo, Japan. 3 The Graduate School of Project Design, Tokyo, Japan. 4 Nippon Medical School, Tokyo, Japan.
Introduction
Health status of population in Japan has substantially improved in the 20th century 1. In 2012, women
in Japan had the longest life expectancy at birth in the world at 87 years, followed by Spain, Swit-zerland and Singapore, while male life expectancy at birth in Japan became eighth at 80 years 2. The
Japanese eat less and maintain healthy body weight. However, we do not know how the Japanese think about situations and problems related to health. We know very little about health decision making in this population.
In health surveys, anchoring vignettes have increasingly become part of an integrated strategy of instrument design and analysis as self-reported health measures is reported to be biased because people have different standards when assessing their health 3,4,5; the goal of this approach is to make
self-report measures more comparable between individuals, communities, and populations 6,7,8,9.
Vignettes are brief descriptions of hypothetical situations presented to respondents, who then answer a series of questions based on the information provided; these responses can be used with other forms of data collection to obtain more information about respondents. Vignettes also enable examina-tion of systematic differences in categorical cut-points between and within populaexamina-tions, and can be applied to many problems in which ordered categorical self-reported data are collected 8. Several
studies showed that using anchoring vignettes to correct for reporting heterogeneity is beneficial to health research 3,4,5,6,7,8,9. However, a recent study based on the World Health Survey (WHS) (Japanese
version) reported that correction for reporting heterogeneity using anchoring vignettes is not neces-sary for problems related to sleep and energy among Japanese adults 10.
Therefore, this study examines how people evaluate severity of health issues. We use anchoring vignettes separately, rather than with self-reported measures that require employing compound hierarchical ordered probit or hierarchical ordered probit models. As a vignette – and the response categories associated with it – represents a situation, vignettes can be rated (here according to their level of severity), and responses to particular vignettes can then be employed as categorical measures of a corresponding health dimension.
The Japanese WHS collected data on health state descriptions and health state valuation for eight health dimensions: mobility, emotions, pain, relationship with others, sleep and energy, vision, rec-ognition/remembering abilities, and self-care. There were five anchoring vignettes for each dimen-sion, and 40 vignettes in total for above eight dimensions, each representing a different severity level (none/mild/moderate/severe/extreme) for hypothetical individuals. Examining factors associated with all vignettes would elucidate how Japanese people consider 40 hypothetical severity levels of health states. To our knowledge, in the Japanese as well as in any other population, the factors associ-ated with all vignettes, i.e., factors affecting self-evaluation of all eight health dimensions have never been identified. We thus employed 40 vignettes from the Japanese WHS to examine factors that affect the evaluation of each vignette; the goal was to explain how the Japanese make decisions regarding their health statuses.
Materials and methods
Data source and sample design
Data for this study were drawn from a pilot study of the Japanese WHS. The Japanese WHS employs methodologies developed by the World Health Organization (WHO). The objectives, sampling design, and methodologies of this instrument are described in English in detail elsewhere 11. The English
ver-sion of the questionnaire and instruments can be obtained from the WHO website 12. The objectives
of the Japanese WHS were to develop a means of providing low-cost, valid, reliable and comparable health information, and to provide policy-makers with the evidence they need to develop and adapt policies, strategies, and programs.
selected from both urban and rural areas of each prefecture, and 21 municipalities that expressed willingness to participate were included in the survey. Households were randomly sampled from each municipality. All members aged ≥ 18 years of the sampled households were eligible for an interview, and 5,016 participants were surveyed. Trained public health nurses were recruited to interview par-ticipants face-to-face, and the interviews took place in 2002 and 2003.
This study employed 40 anchoring vignettes from the Health Description Use (HDU) section of the Japanese WHS. There were four sets (set A to set D) of vignettes for the eight health dimensions for the HDU, set A was comprised of mobility and emotions dimensions; set B was comprised of pain and relationship with others; set C was comprised of sleep and energy and vision; and set D was com-prised of recognition/remembering abilities and self-care. Each respondent responded 10 vignettes from one of the sets; about one-fourth of respondents were randomly chosen to respond to one complete set of vignettes. This way, all respondents responded to the selected vignettes. Fifty-seven respondents with missing observations for vignette identification variable were excluded, leaving a final sample size of 4,959. Of 4,959 respondents, 1,487 responded to set A of mobility and emotions dimensions, 1,263 responded to set B of pain and relationship with others, 1,125 responded to set C of sleep and energy and vision, and the rest responded to set D of recognition/remembering abilities and self-care. However, due to missing observations on explanatory variables, different numbers of cases (provided in the respective tables) were analyzed in the multivariate models.
Measurements
• Outcomes
All 40 anchoring vignettes from the HDU were considered as outcome variables in this study. Figure 1 shows an example of five vignettes, each representing a different level of severity (none/mild/moder-ate/severe/extreme) for the mobility problems. A similar set of vignettes was employed for each of the remaining seven dimensions; vignettes not shown here can be obtained from the WHO website 12.
To ensure consistency, respondents were asked to rate the level of vignettes in the same way as they would rate their own health on each dimension. They were also asked to assume that the age and socio-economic position of the hypothetical individuals described in the vignettes were similar to their own. The response categories for each vignette were recoded as 1 (extreme), 2 (severe), 3 (moder-ate), 4 (mild), and 5 (none).
• Explanatory variables
Explanatory variables were selected based on existing literatures on vignettes and on the WHS
4,8,10,11,13. Following the previous study in Japan 10, age in single year was used in the regression
analy-sis. Sex (male or female) and number of schooling years were employed in the regression analyanaly-sis. A disease status variable was created on the diagnoses of eight diseases/health problems: (a) angina, (b) pain or discomfort in chest when walking uphill or hurrying, (c) asthma, (d) wheezing or whistling breathing, (e) depression, (f) felt sad, empty or depressed, (g) lost interest in most enjoyable things, and (h) decreased energy. Respondents were grouped according to their disease status into: (1) respon-dents who reported not having health problems, (2) responrespon-dents who reported having one or more of the health problems. Additional variables used were smoking behavior (current smoker or non-smoker) and alcohol behavior (current alcohol consumer or non-drinker).
Analysis plan
We first recorded descriptive statistics for the study sample. We then employed a standard ordered probit model to estimate the coefficients of the explanatory variables for each outcome. For each set of vignettes, we included only the corresponding SEHD along with the other explanatory variables in the model. For example, we included the other explanatory variables (age, sex, years of schooling, dis-ease status, smoking, and alcohol consumption) and self-evaluation on the mobility dimension when we fit ordered probit model for five anchoring vignettes (i.e. outcomes) for the mobility dimension. Because there were eight dimensions, each with five anchoring vignettes, we constructed 40 multi-variate ordered probit models. Additionally, a Brant’s test 14 with ordered logit models was performed
and revealed that the parallel regression assumption had been violated. Violations of parallel regres-sion assumption are common in ordered logit regresregres-sion as it is rare that all levels of independent variables have the same relationship with the dependent variable. We therefore fit separate general-ized ordered logistic regression models as a check. Generalgeneral-ized ordered logistic regression has the advantage of constraining model parameters so the effects meet the proportional odds assumption. After finding that the results were similar in all models, and since the proportional odds assumption was held for most of the model parameters, we decided to present the results from the ordered probit regression models in this study. The entire analysis of the study was performed with Stata/SE version 12.1 (StataCorp LP, College Station, USA).
Ethical considerations
The National Institute of Public Health of Japan approved the recruitment, consent procedure, and the fieldwork for the Japanese WHS.
Figure 1
Anchoring vignettes for the mobility dimension of the Japanese World Health Survey.
Note: names are included as examples only. Interviewers presented the set of names matched to each respondent’s gender.
For each of the following situations, how much overall difficulty do you think Mr./Ms. [name] experienced while moving around in the last 30 days? (a) none (b) mild (c) moderate (d) severe (e) extreme/cannot [move].
No difficulty
Mr./Ms. Itoh has no difficulties in walking or running and can use his/her hands, arms and legs. Twice a week, he/she jogs four kilometers.
Mild difficulty
Mr./Ms. Yamaguchi can walk 200 meters without any difficulty but tires if he/she walks a kilometer or up and down stairs. However, he/she can perform daily activities, such as buying groceries and carrying them home, without any trouble.
Moderate difficulty
Mr./Ms. Katayama does not exercise. Because he/she is overweight, he/she cannot go up and down the stairs or do other physical exercises. However, he/she can carry groceries and do light housework.
Severe difficulty
For health reasons, Mr./Ms. Shigeta has severe leg swelling. Because of the swelling, he/she has a hard time walking around the house.
Results
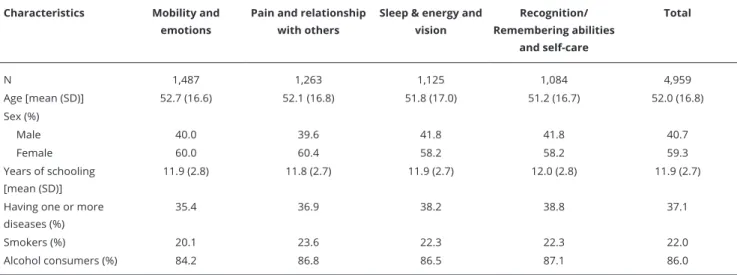
Table 1 gives the distribution of the study sample by health dimensions and by selected socio-demo-graphic characteristics. The sample mean age was 52 years. Approximately 60% of respondents were female. The mean year of schooling was 12 years. Around 35-39% of respondents reported having one or more diseases/health problems in the studied health dimensions. Approximately a fifth of the respondents reported use of tobacco products, such as cigarettes, cigars or pipe tobacco, and 84-87% reported being alcohol (beer or wine) consumers. The characteristics of the respondents were appar-ently similar across health dimensions.
Table 2 provides results for the ordered probit models on all vignettes (outcome variables) of mobility, emotions, pain and relationship with others along with the magnitude of the coefficients. Each column represents an equation with positive coefficients corresponding to lower severity (higher numerical rating) on outcome variables and negative coefficients corresponding to greater severity (lower numerical rating) on outcome variables. Age and alcohol consumer in case of extreme problem and education and SEHD in case of no problem vignettes were found to be in a single direc-tion. For results of evaluation of the extreme problem vignettes, we expected negative probit coeffi-cients for all of the independent variables. However, only age had a positive influence on the extreme vignette for all dimensions, suggesting that older individuals have a higher probability of reporting extreme problems, such as mobility, emotions, pain and relationship with others as less problematic. Compared with men, women had a negative influence on severe and extreme vignettes for emotions, severe vignette for pain, and severe vignette for relationship with others. This suggests that, for these dimensions, women report severe health issues as being more problematic than men do.
As expected, years of schooling, as well as SEHD, had a positive influence on the vignette with no problem for all dimensions, suggesting that people with more education and people with less health problems (higher numerical rating in SEHD), respectively, have a higher probability of reporting no problem on all dimensions or find them less problematic than their counterparts. Also expected, people with one or more diseases in case of relationship with others, and alcohol consumers in all dimensions have a higher probability of reporting extreme problem as more problematic than their counterparts. Smoking had a positive influence on one dimension (relationship with others), sug-gesting that smokers rate extreme health issues as less problematic when talking about relationships. As well as Table 2, Table 3 shows results for the ordered probit coefficients for all vignettes of sleep & energy, vision, recognition/remembering abilities and self-care dimensions. Age in case of
Table 1
Distribution of the characteristics of the study sample by health dimensions.
Characteristics Mobility and emotions
Pain and relationship with others
Sleep & energy and vision
Recognition/ Remembering abilities
and self-care
Total
N 1,487 1,263 1,125 1,084 4,959
Age [mean (SD)] 52.7 (16.6) 52.1 (16.8) 51.8 (17.0) 51.2 (16.7) 52.0 (16.8)
Sex (%)
Male 40.0 39.6 41.8 41.8 40.7
Female 60.0 60.4 58.2 58.2 59.3
Years of schooling [mean (SD)]
11.9 (2.8) 11.8 (2.7) 11.9 (2.7) 12.0 (2.8) 11.9 (2.7)
Having one or more diseases (%)
35.4 36.9 38.2 38.8 37.1
Smokers (%) 20.1 23.6 22.3 22.3 22.0
Alcohol consumers (%) 84.2 86.8 86.5 87.1 86.0
Table 2
Regression results of beta coeicients (standard error) on vignettes for mobility, emotions, pain and relationship with others.
Dimension, N, explanatory variables Severity of vignettes
No Mild Moderate Severe Extreme
Mobility
Number of respondents 1,310 1,305 1,307 1,298 1,304
Age -0.004 (0.002) -0.004 * (0.002) 0.005 * (0.002) 0.001 (0.002) 0.010 * (0.002)
Female -0.054 (0.073) 0.129 * (0.066) -0.061 (0.067) 0.060 (0.071) -0.103 (0.073)
Years of schooling 0.051 * (0.013) -0.013 (0.012) -0.010 (0.012) -0.020 (0.013) -0.001 (0.013)
Having one or more diseases 0.004 (0.032) -0.066 * (0.029) -0.002 (0.029) 0.004 (0.031) -0.015 (0.033)
Smoker -0.088 (0.087) -0.048 (0.078) 0.018 (0.079) 0.105 (0.084) 0.058 (0.087)
Alcohol consumer 0.037 (0.094) 0.051 (0.085) -0.113 (0.086) -0.188 * (0.091) -0.284 * (0.092)
SEHD 0.236 * (0.032) 0.002 (0.029) 0.025 (0.029) 0.038 (0.031) -0.071 * (0.032)
Emotions
Number of respondents 1,302 1,306 1,304 1,305 1,305
Age 0.001 (0.002) -0.002 (0.002) 0.006 * (0.002) 0.004 * (0.002) 0.005 * (0.002)
Female 0.055 (0.071) 0.040 (0.066) -0.083 (0.066) -0.148 * (0.071) -0.163 * (0.076)
Years of schooling 0.044 * (0.013) 0.001 (0.012) -.008 (0.012) -0.040 * (0.013) -0.048 * (0.014)
Having one or more diseases 0.036 (0.033) -0.017 (0.031) -0.052 (0.032) 0.003 (0.033) -0.010 (0.035)
Smoker 0.031 (0.085) 0.003 (0.078) 0.072 (0.078) -0.073 (0.085) -0.060 (0.091)
Alcohol consumer 0.044 (0.093) 0.187 * (0.086) -0.160 (0.086) -0.198 * (0.090) -0.317 * (0.094)
SEHD 0.166 * (0.033) 0.044 (0.031) 0.138 * (0.031) 0.003 (0.033) 0.002 (0.036)
Pain
Number of respondents 1,159 1,153 1,146 1,153 1,154
Age -0.003 (0.002) 0.001 (0.002) 0.001 (0.002) 0.011 * (0.002) 0.011 * (0.003)
Female 0.115 (0.079) 0.215 * (0.074) -0.007 (0.072) -0.037 (0.076) -0.177 * (0.087)
Years of schooling 0.052 * (0.016) -0.004 (0.014) -0.023 (0.014) 0.009 (0.015) -0.032 (0.017)
Having one or more diseases 0.007 (0.035) 0.030 (0.032) -0.057 (0.032) -0.1 00 * (0.034) -0.004 (0.039)
Smoker -0.026 (0.092) 0.025 (0.084) 0.134 (0.084) 0.163 (0.087) 0.164 (0.100)
Alcohol consumer 0.341 * (0.103) 0.215 * (0.101) -0.128 (0.099) 0.091 (0.103) -0.498 * (0.110)
SEHD 0.068 * (0.036) 0.122 * (0.033) 0.067* (0.033) 0.047 (0.035) -0.033 (0.040)
Relationship with others
Number of respondents 1,153 1,151 1,150 1,151 1,154
Age -0.003 (0.003) 0.001 (0.002) -0.002 (0.002) 0.002 (0.002) 0.013 * (0.002)
Female 0.030 (0.084) -0.038 (0.072) 0.148 * (0.071) -0.203 * (0.077) 0.041 (0.078)
Years of schooling 0.033 * (0.016) 0.026 (0.014) 0.022 (0.014) -0.031 * (0.015) -0.007 (0.015)
Having one or more diseases -0.006 (0.036) 0.010 (0.032) -0.053 (0.031) -0.036 (0.034) -0.089 * (0.035)
Smoker -0.135 (0.096) 0.085 (0.083) 0.029 (0.082) 0.055 (0.089) 0.186 * (0.089)
Alcohol consumer 0.303 * (0.110) 0.006 (0.100) 0.138 (0.097) -0.202 * (0.105) -0.284 * (0.105)
SEHD 0.149 * (0.036) -0.039 (0.032) 0.102 * (0.031) -0.033 (0.034) 0.024 (0.034)
SEHD: self-evaluations on health dimensions. * p < 0.05.
Table 3
Regression results of beta coeicients (standard errors) on vignettes for sleep and energy, vision, recognition/remembering abilities and self-care.
Dimension, N, explanatory variables Severity of vignettes
No Mild Moderate Severe Extreme
Sleep and energy
Number of respondents 1,004 1,011 999 1,014 1,013
Age -0.005 (0.003) 0.003 (0.002) -0.005 * (0.002) 0.009 * (0.003) 0.010 * (0.003)
Female 0.148 (0.107) -0.078 (0.079) -0.008 (0.078) -0.037 (0.085) -0.190 * (0.079)
Years of schooling 0.071 * (0.021) -0.064 * (0.015) -0.030 * (0.015) -0.043 * (0.017) -0.029 (0.015)
Having one or more diseases 0.085 (0.046) 0.011 (0.032) 0.009 (0.032) -0.046 (0.035) -0.032 (0.033)
Smoker -0.318 * (0.119) 0.121 (0.090) 0.029 (0.090) 0.328 * (0.096) 0.123 (0.091)
Alcohol consumer 0.423 * (0.129) -0.094 (0.105) -0.025 (0.105) -0.152 (0.111) -0.223 * (0.105)
SEHD 0.140 * (0.043) 0.062 (0.033) 0.007 (0.033) -0.001 (0.036) 0.033 (0.033)
Vision
Number of respondents 999 1,002 1,010 1,002 1,012
Age -0.050 (0.003) -0.005 * (0.002) 0.004 (0.002) 0.011 * (0.003) 0.010 * (0.003)
Female 0.004 (0.085) -0.229 * (0.076) -0.076 (0.078) -0.056 (0.081) -0.105 (0.093)
Years of schooling 0.054 * (0.017) -0.021 (0.015) -0.003 (0.015) -0.024 (0.016) -0.036 * (0.018)
Having one or more diseases 0.021 (0.035) -0.061 * (0.031) -0.032 (0.031) -0.070 * (0.033) -0.012 (0.038)
Smoker -0.142 (0.097) -0.165 * (0.087) 0.129 (0.089) 0.084 (0.092) 0.162 (0.105)
Alcohol consumer 0.263 * (0.109) -0.006 (0.101) -0.097 (0.104) -0.179 (0.107) -0.287 * (0.117)
SEHD 0.104 * (0.037) 0.010 (0.034) 0.004 (0.035) 0.043 (0.036) -0.030 (0.041)
Recognition/Remembering abilities
Number of respondents 992 985 985 987 986
Age -0.009 * (0.003) -0.004 (0.002) -0.002 (0.002) 0.005 * (0.002) 0.006 * (0.003)
Female 0.252 * (0.089) 0.011 (0.077) -0.062 (0.076) 0.167 * (0.077) -0.116 (0.081)
Years of schooling 0.036 * (0.016) 0.047 * (0.014) -0.010 (0.014) 0.001 (0.014) -0.005 (0.015)
Having one or more diseases -0.022 (0.037) -0.042 (0.032) 0.001 (0.031) -0.061 * (0.032) 0.031 (0.034)
Smoker 0.021 (0.105) -0.073 (0.089) 0.003 (0.088) 0.038 (0.089) 0.037 (0.094)
Alcohol consumer 0.109 (0.122) -0.002 (0.107) 0.166 (0.106) 0.014 (0.107) 0.027 (0.114)
SEHD 0.199 * (0.042) 0.146 * (0.036) 0.081 * (0.036) 0.173 * (0.036) 0.007 (0.038)
Self-care
Number of respondents 983 987 990 992 989
Age -0.001 (0.003) -0.004 (0.002) -0.001 (0.002) -0.002 (0.003) 0.007 * (0.002)
Female 0.193 * (0.083) 0.029 (0.076) -0.186 * (0.079) -0.029 (0.081) -0.091 (0.079)
Years of schooling -0.002 (0.015) -0.006 (0.014) -0.007 (0.015) -0.009 (0.015) 0.005 (0.015)
Having one or more diseases -0.071 * (0.033) -0.024 (0.031) 0.018 (0.032) -0.033 (0.033) -0.005 (0.033)
Smoker -0.079 (0.096) -0.153 (0.089) 0.005 (0.092) 0.036 (0.094) -0.015 (0.093)
Alcohol consumer 0.082 (0.118) 0.076 (0.106) 0.024 (0.110) 0.145 (0.113) 0.074 (0.112)
SEHD 0.254 * (0.039) -0.011 (0.036) -0.067 (0.038) -0.066 (0.039) -0.033 (0.038)
SEHD: self-evaluations on health dimensions. * p < 0.05.
the exception of the age and SEHD variables. Although coefficients for age and SEHD showed differ-ing directions and values across vignettes, significant and positive effects were found for age on the extreme problem vignettes and for SEHD on the no problem vignettes for all health dimensions. The findings on SEHD are usual, while age exerted unusual findings, which suggest that older individuals are more likely to report extreme health problems as being less problematic than younger individuals.
Discussion
The main finding of our study was that older Japanese people appear to view extreme health problems as being less problematic than younger people do. To our knowledge, this is the first study investigat-ing how people in Japan evaluate anchorinvestigat-ing vignettes and associated health issues. Although several variables were associated with different vignettes and with varying directionality, no patterns were observed except for age on the extreme vignettes for all studied health dimensions and SEHD on the no problem vignettes for all studied health dimensions. As usual, people with less health problems have a higher probability of reporting no problem on all studied health dimensions as less problematic than their counterparts. However, the findings on age on the extreme vignettes for all studied health dimensions suggest that older Japanese people view extreme health problems more positively than younger Japanese people do. This may occur because older people have experienced more adverse events and may view these events as a normal aspect of life. Everyone experiences difficult life events (e.g., diseases, getting married, having a child, changes in marital status, supporting aging parents, depression) during his/her lifetime. Probably, older people have had experienced and observed more adverse events than younger people and may therefore interpret such events as “normal.” This may explain why the older Japanese people (when compared with younger people) in our study reported that health-related extremes were less problematic. In Japan, the average age at death has remained mostly unchanged due to a twin-peak pattern of increasing numbers of deaths at younger ages (30-64 years) and older ages (≥ 75 years). The fatality rate in the older population is high, and aging is a factor that increases the number of deaths and mortality costs 15. We should thus pay special attention to the
older population in Japan. Our finding concerning age is important for doctors and other healthcare workers who treat health problems in older adults and suggests that older people may underempha-size the severity of their own health problems.
All studied health dimensions (mobility, emotions, pain, relationship with others, sleep and ener-gy, vision, recognition/remembering abilities, and self-care) used in this study likely have great significance for an individual’s life because limitations/problems on one dimension of health may significantly affect other dimensions. For example, mobility limitations are reported to be a strong predictor of subsequent disabilities and the need for assistance 16,17. Because of the close relationship
between disability and dependency, mobility limitations can often restrict activity and social par-ticipation and provoke isolation, anxiety, and depression. Such limitations contribute to an overall poorer quality of life 18. In this study, we found negative coefficients on the self-evaluation only for
mobility, indicating that individuals who report greater mobility also report extreme mobility limita-tions as being more problematic.
We also found a gender effect in our study. When compared with men, Japanese women reported greater severity in the case of extreme problems on three health dimensions: emotion, pain, and sleep/ energy. This is consistent with the finding from a study of community-dwelling older Singaporeans showing that women reported greater severity of pain than men 4. In the United States, sleep
prob-lems were reported to be more common among women 19. Women seem to have better sleep quality
than men, with longer sleep time, shorter sleep onset latency, and higher sleep efficiency. Despite this, women have more sleep-related complaints than men 20. In Latin America, women were reported to
be more exposed to social and material disadvantages during their life course than men. They had higher rate of depression than men. Cumulative life-course exposure to social and material disadvan-tage and current material, social, and health conditions explained the higher frequency of depression in women 21.
individuals with one or more diseases reported greater severity of relationship problems than the individuals without diseases. This is consistent with the earlier finding that comorbid states incre-mentally worsen health when compared with single disease states 10,16.
Unexpectedly, smokers viewed extreme health problems more positively than non-smokers when they talked about relationships. A possible reason is that smokers may consider cigarettes, cigars, or pipe tobacco as a way to alleviate loneliness and do not care much about relationships. This study also found negative effects of alcohol consumption. When participants reported being consumers of alcohol, they reported more negative effects when health problems were extreme. This was true for all dimensions except recognition/remembering and self-care. This is consistent with considerable research demonstrating the detrimental effects of alcohol consumption. The harmful health effects and social consequences of alcohol intake include loss of workplace productivity, social discord, domestic violence, and homicide 22. Excess of alcohol intake can also lead to acute alcoholism,
addic-tion, overweight, and obesity. Long-term consumption affects metabolic and nutritional conditions, hypertension, liver disease, and is related to illnesses such as cancer 23.
Limitations
There were a few limitations to our study. First, only about one-fourth of respondents were given the opportunity to respond to one full set of vignettes (i.e., one of sets A to D) and caution should be there-fore exercised in generalizing these results to the larger population. In addition, we did not explore the onset of the eight diseases/health problems, a factor that may have influenced the report on the anchoring vignettes. The number of cigarettes smoked and the amount of alcohol intake could not be explored in this study due to lack of data on these factors in the Japanese WHS. These limitations should be addressed in future research to clarify effects on health decisions in the Japanese popula-tion. However, a strength of our study was that socio-demographic characteristics were similar across all the health dimensions studied, thus indicating that our sample was representative for each set of vignettes in the Japanese population.
Conclusions
In conclusion, older people reported fewer severe problems even in the case of extreme health dif-ficulties. This was true for all eight dimensions of health explored in this study. This finding is impor-tant for Japan’s “super-aging” society; although health systems have contributed enormously to better health status in Japan, the findings imply that healthcare workers should be careful when assessing the severity of health problems in the older population. The health problem may be more severe than reported.
Contributors
M. I. Tareque conceived the study and contributed to the study design; performed the statistical anal-ysis and drafted the manuscript; and contributed to manuscript revisions. N. Ikeda, A. Koshio, and T. Hasegawa conceived the study and contributed to the study design and manuscript revisions. All authors read and approved the final manuscript.
Acknowledgments
References
1. Ikeda N, Saito E, Kondo N, Inoue M, Ikeda S, Satoh T, et al. What has made the population of Japan healthy? Lancet 2011; 378:1094-105. 2. World Health Organization. World health
sta-tistics 2014. Geneva: World Health Organiza-tion; 2014.
3. Bago d’Uva T, van Doorslaer E, Lindeboom M, O’Donnell O. Does reporting heterogeneity bias the measurement of health disparities? Health Econ 2008; 17:351-75.
4. Chan A, Malhotra C, Do YK, Malhotra R, Øst-bye T. Self reported pain severity among mul-tiethnic older Singaporeans: does adjusting for reporting heterogeneity matter? Eur J Pain 2011; 15:1094-9.
5. Grol-Prokopczyk H, Freese J, Hauser RM. Us-ing anchorUs-ing vignettes to assess group differ-ences in general self-rated health. J Health Soc Behav 2011; 52:246-61.
6. Kapteyn A, Smith JP, van Soest A. Vignettes and self-reports of work disability in the Unit-ed States and the Netherlands. Am Econ Rev 2007; 97:461-73.
7. d’Uva TB, O’Donnell O, van Doorslaer E. Dif-ferential health reporting by education level and its impact on the measurement of health inequalities among older Europeans. Int J Epi-demiol 2008; 37:1375-83.
8. Salomon JA, Tandon A, Murray CJL; World Health Survey Pilot Study Collaborating Group. Comparability of self rated health: cross sectional multi-country survey using an-choring vignettes. BMJ 2004; 328:258.
9. King G, Murray CJ, Salomon JA, Tandon A. Enhancing the validity and cross-cultural comparability of measurement in survey re-search. Am Polit Sci Rev 2004; 98:191-207. 10. Tareque MI, Ikeda N, Koshio A, Hasegawa T. Is
adjustment for reporting heterogeneity neces-sary in sleep disorders? Results from the Japa-nese World Health Survey. BMC Psychiatry 2016; 16:25.
11. Wada K, Kakuma R, Hoshi K, Sato Y, Hasegawa T, Satoh T. Factors associated with preferences for health system goals in Japan: a pilot study of the World Health Survey. Asia Pac J Public Health 2011; 23:721-9.
12. World Health Organization. World Health Survey. http://www.who.int/healthinfo/sur-vey/en/index.html (accessed on 17/Oct/2012).
13. Moussavi S, Chatterji S, Verdes E, Tandon A, Patel V, Ustun B. Depression, chronic diseas-es, and decrements in health: results from the World Health Surveys. Lancet 2007; 370:851-8. 14. Brant R. Assessing proportionality in the pro-portional odds model for ordinal logistic re-gression. Biometrics 1990; 46:1171-8. 15. Hayata E, Seto K, Haga K, Kitazawa T,
Matsu-moto K, Morita M, et al. Cost of illness of the cervical cancer of the uterus in Japan – a time trend and future projections. BMC Health Serv Res 2015; 15:104.
16. Hirvensalo M, Rantanen T, Heikkinen E. Mo-bility difficulties and physical activity as pre-dictors of mortality and loss of independence in the community-living older population. J Am Geriatr Soc 2000; 48:493-8.
17. Jette AM, Assmann SF, Rooks D, Harris BA, Crawford S. Interrelationships among disable-ment concepts. J Gerontol A Biol Sci Med Sci 1998; 53A:M395-404.
18. Netuveli G, Wiggins RD, Hildon Z, Montgom-ery SM, Blane D. Quality of life at older ages: evidence from the English Longitudinal Study of Aging (wave 1). J Epidemiol Community Health 2006; 60:357-63.
19. Walsh JK. Clinical and socioeconomic corre-lates of insomnia. J Clin Psychiatry 2004; 65 Suppl 8:13-9.
20. Krishnan V, Collop NA. Gender differences in sleep disorders. Curr Opin Pulm Med 2006; 12:383-9.
21. Alvarado BE, Zunzunegui MV, Béland F, Si-cotte M, Tellechea L. Social and gender inequal-ities in depressive symptoms among urban older adults of Latin America and the Caribbe-an. J Gerontol B Psychol Sci Soc Sci 2007; 62: S226-36.
22. Hirayama F, Lee AH, Binns CW, Okumura C, Yamamoto S. Alcohol consumption by older adults in Central and Southern Japan. Asia Pac J Public Health 2009; 21:170-6.
Resumo
Os autores examinaram os fatores relacionados à avaliação das vinhetas para descrição da saú-de e as maneiras pelas quais os japoneses tomam decisões nas oito dimensões da saúde (mobilida-de, emoção, dor, relacionamento com outros, sono e energia, visão, habilidades de reconhecimento/ memória e cuidados próprios). Foi analisado um
conjunto de dados de 4.959 indivíduos (≥ 18 anos)
do estudo japonês da Pesquisa Mundial de
Saú-de. O estudo usou modelos probit ordenados para
identificar os fatores relacionados a todas as di-mensões da saúde. Indivíduos mais idosos demons-travam uma leitura menos problemática dos pro-blemas mais graves. As mulheres relatavam maior gravidade no caso de problemas extremos, em três dimensões da saúde: emoção, dor e sono/energia. O estudo também mostrou efeitos negativos do consumo de álcool em quase todas as dimensões. Médicos e outros profissionais da saúde devem ser criteriosos ao avaliar a gravidade dos problemas de saúde nos idosos, porque neste grupo etário, os problemas podem ser mais graves do que os pró-prios pacientes relatam.
Informação de Saúde ao Consumidor; Inquéritos Epidemiológicos; Promoção da Saúde
Resumen
Los autores examinaron los factores relacionados con la evaluación de las viñetas para la descrip-ción de la salud y las maneras por las que los ja-poneses toman decisiones en las ocho dimensiones de la salud (movilidad, emoción, dolor, relación con otros, sueño y energía, visión, habilidades de reconocimiento/memoria y cuidados propios). Se analizó un conjunto de datos de 4.959 individuos
(≥ 18 años) del estudio japonés de la Encuesta
Mundial de Salud. El estudio usó modelos pro-bit ordenados para identificar los factores relacio-nados con todas las dimensiones de la salud. Los individuos más ancianos demostraban una lectura menos problemática de los problemas más graves. Las mujeres relataban mayor gravedad, en el caso de problemas extremos, en tres dimensiones de la salud: emoción, dolor y sueño/energía. El estudio también mostró efectos negativos del consumo de alcohol en casi todas las dimensiones. Médicos y otros profesionales de la salud deben ser criteriosos al evaluar la gravedad de los problemas de salud en los ancianos, porque en este grupo de edad, los problemas pueden ser más graves de lo que los pro-pios pacientes relatan.
Información de Salud al Consumidor; Encuestas Epidemiológicas; Promoción de la Salud
Submitted on 31/May/2016