Balance in Parkinson’s disease patients changing the visual input
Abstract
Hamlet Suarez1, Dario Geisinger2, Enrique D. Ferreira3, Santiago Nogueira4, Sofia Arocena5, Cecilia San Roman6, Alejo Suarez7
1 MD. PHD. (Prof. of Otolaryngology.CLAEH School of Medicine. Director of Otoneurology Briish Hospital. Montevideo). 2 Mr. (Researcher, Laboratorio de Otoneurologia).
3 Eng. PhD. (Aggregate Professor, UCUDAL - Uruguay). 4 Mr. (Researcher, Laboratorio de Otoneurologia). 5 Mrs (Researcher, Laboratorio de Otoneurologia). 6 Mrs (Researcher, Laboratorio de Otoneurologia).
7 MD, MSc (ENT department, Briish Hospital. Montevideo. Researcher, Laboratorio de Otoneurologia).
Paper submited to the BJORL-SGP (Publishing Management System – Brazilian Journal of Otorhinolaryngology) on November 25, 2010;
and accepted on January 1, 2011. cod. 7427
T
he description of the postural responses in Parkinson’s disease patients when visual information changes from a stable to a moving visual field analyzing the impact on balance in these patients.Methods (Clinical): Limits of Stability, Body center of pressure and balance functional reserve were measured by means of the force platform in 24 Parkinson´s patients in stages 1 and 2 of the Boher classification and 19 volunteers as a control group. Both groups were stimulated with 1-Static visual field and 2-horizontal optokinetic stimulation using a virtual reality system. Postural responses were analyzed using the inverted pendulum as mathematical model.
Results: While the control group didn’t show significant differences on the postural control between the two sensory conditions (COP p=0.0017, BFR p=0.0025), Parkinson’s patients presented significant differences in the area of the center of pressure and the balance functional reserve values between static visual field and optokinetic stimulation. (COP p=0.0017, BFR p=0.0025).
Conclusions: The results support the hypothesis about the influence of the changes in the visual information in triggering balance control disorders in Parkinson’s patients. It is discussed the interest of these fact in the assessment and the rehabilitation programs of this disease.
ORIGINAL ARTICLE
Braz J Otorhinolaryngol. 2011;77(5):651-5.
BJORL
Keywords: linear models, parkinson disease, postural balance, visual perception.
INTRODUCTION
Balance disorders in patients with Parkinson´s disease (PD) manifest in different stages of the disease, even in the initial stages, thus increasing disability with falls and freezing of gait (FOG). Although balance is typi-cally preserved early in the course of idiopathic PD, many surveys have shown a higher incidence of falls (and their consequences) with rates near 70% in patients in the initials stages of the Boher classification. Fall rates are higher in studies that also include “near falls”1.
Recent studies have shown that sensory input and sensory motor processing appear to be relevant in clinical issues in PD, such as instability in open spaces, postural control disorientation, or FOG2-8. One of the interesting
points about the relationship between the changes in the cues of sensory information and postural control is the possibility to assess postural responses with these changes in order to understand all of the mechanisms involved in balance disorders in patients with PD. Also, this informa-tion could be useful for introducing sensory stimulainforma-tion in PD rehabilitation protocols in an attempt to achieve postural adaptation.
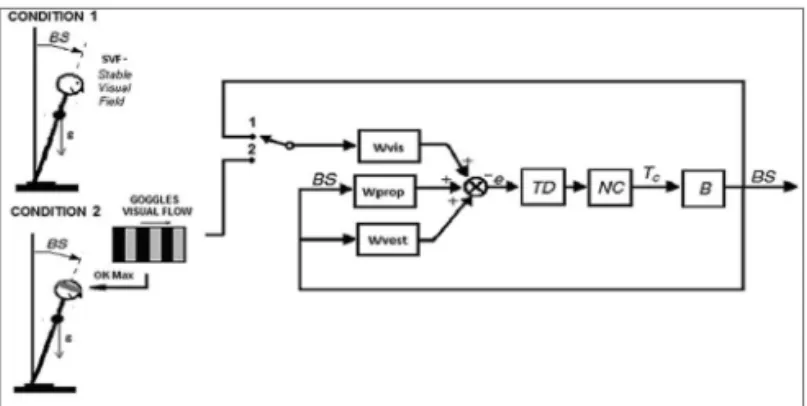
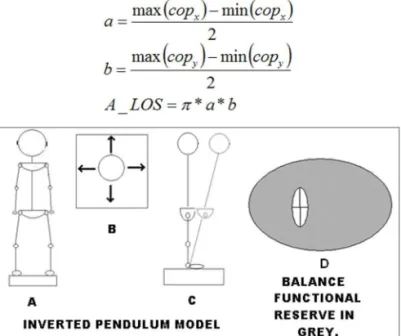
This study aims to understand the role of changes in one of the most important visual cues (motion) in ge-nerating alterations on the postural control model of these patients and analyzing which is the most sensitive para-meter for the measurement of altered postural responses. We studied the postural responses in patients with early stage PD when they have a stable visual field (SVF) and when they receive a visual input with a moving field (optokinetic stimulation). The spatial behavior of the body center of pressure (COP) with these two visual input con-ditions has been analyzed based on the inverted pendulum model (Figure. 1). Figure 1 shows a typical model of the postural control system. This feedback control model is commonly used to describe the mechanism of how humans are able to maintain balance.
In this model the human body (B) is represented as an inverted pendulum with axis through both ankle joints. (NC) is the Neuromuscular Controller that generates the corrective torque (Tc) from the sensory information to stabilize the body. (TD) represents the delay in the transmission, processing, and muscle activation. An inter-nal orientation error siginter-nal e is formed from a weighted combination of visual, vestibular, and proprioceptive in-formation with weighting factors Wvis, Wvest, and Wprop, respectively. (BS) Body-in-space is the angular deviation from upright stance. In Figure 1 two conditions are sho-wn; Condition 1 represents static visual field (SVF), where the visual input is the angular deviation; Wvis closes the feedback loop with the switch in position 1. Condition 2 represents optokinetic stimulation, where the input is the visual flow presented on the goggles; Wvis closes the feedback loop with the switch in position 2.
The goal of this study is the assessment of the postural control in Parkinson’s patients without clinical significant complaint on the balance (Stages 1 and 2 of the Boher classification) when the visual field has a stable frame or a visual input with a constant velocity flow, sug-gesting a mechanism of alteration on the postural control model with changes in the motion cue in the visual infor-mation. We also evaluate the balance functional reserve (BFR) as parameter in the measurement of postural control behavior when these patients receive different sensory stimulation. Functional reserve is a way to describe the range of operation for a specific organ or system, such as renal, respiratory or cardiac. The BFR is a parameter which we have introduced to assess the relationship be-tween the limits of stability (LOS) and the COP area, and quantifies the remaining swaying capacity under different sensory conditions.
METHODS
Population
Twenty-four patients in stages 1 and 2 of the Boher classification of PD were studied. (Mean age 66.5 ± 8.5) They were assessed by neurologic bedside examinations, psychological testing using a depression scale, cognitive evaluations, brain MRIs, and SPECT scans of the brain for the measurement of dopaminergic transportation. Patients with musculoskeletal disorders, cognitive impairment, or neuropathy were excluded from this study. All studied pa-tients were being treated with levodopa. Informed consent was obtained from the patients according to the ethical standards of the Helsinki Declaration (1975, revised 1983) and ethical approval was received from the Catholic Uni-versity of Uruguay (www.ucu.edu.uy/Portals/0/.../Etica/ PROTO-aprob-hasta%20DIC09.doc). A control group (CG) of 19 volunteers was recorded under the same conditions as the PD patients (Mean age 62.3 ± 12.7).
Stimulation Paradigm
Data was obtained using a force platform with a sampling rate of 50 Hz. Subjects performed a posturo-graphy session using the BRU (Medicaa System), which includes measurement of the LOS and the COP under a SVF and under visual optokinetic stimulation (60o/s). All subjects where checked for a constant distance between the toes as marked on the force platform (approximately 8 cm) in all exercises.
Limits of Stability
Instructions to carry on the LOS measurements in-clude swaying forward, backward, and laterally until the maximum was reached without losing balance or lifting the feet. This should be performed using an ankle strategy exclusively from a starting point at which the subject is in a basal position in quiet stance. This generates a cross-like pattern in the COP record. Figure 2A shows the subject in a quiet stance, with the oscillations he ought to perform (top view, Figure 2B) and when swaying in the forward direction (lateral view, Figure 2C). Quantification of the LOS is performed by calculating an ellipse that will esti-mate its area. This is achieved by approximating the sway pattern to an ellipse, using the maximum and minimum of the total distance swayed in the medio-lateral and antero-posterior axes:
For the area of the COP during optokinetic stimu-lation,(60 o/s) we took the maximum value of the COP between the right to left and left to right stimulation (OK).
Balance Functional Reserve
We determined the ratio of the area of the LOS and the area of the CE giving a measurement on how much area of the LOS is still available for the patient to safely sway. The BFR is presented as the percentage of the to-tal swaying capacity (LOS) still available to sway. Figure 2D graphically shows the meaning of the BFR. The gray area represents the area of the LOS without the CE of an exercise. The BFR quantifies the percentage of the gray area compared to the entire area of the LOS, computed as:
Center of Pressure (COP)
The COP area is estimated by the ellipse of confi-dence (CE) for each exercise. The area of the CE at 95% is computed as:
Figure 2. LOS and BFR - Schematic representation of the LOS proce-dures showing subject in quiet stance (A) , direction of the oscillations to test the LOS (B) and the ankle strategies to perform the test (C). The grey area between the LOS and the CE represents the BFR (D).
Data Analysis
Statistical analysis was performed with the Wilcoxon test to compare SVF and OK in each population. The Mann -Whitney U test was used to compare between populations for each parameter (both with an alpha at 5%).
To determine the discriminative characteristics of the OK parameter, ROC curves were used. These curves are plotted using the specificity and sensitivity of the sample and determining the cut-off point by maximizing these values. A common value to compare between classifiers is to use the area under the ROC curves (AUC), which is a value between 0.5 (random guessing) and 1 (perfect classifier; 12). All data was processed using Matlab.
RESULTS
Table 1 shows the LOS, COP and BFR values (With SVF and OK stimulation) for both populations.
Control Group PD Patients
Units min mean max min mean max
LOS cm2 57 270 748 31 146 281
COP SVF cm2 0.91 3.97 11.5 1.2 8.45 43.6
COP OK cm2 0.68 3.23 11.4 0.85 15.5 80.1
BFR SVF % 95.88 98.31 99.88 50.53 91.5 99.47
BFR OK % 91.77 98.35 99.74 31.43 86.76 99.45
Table 1.
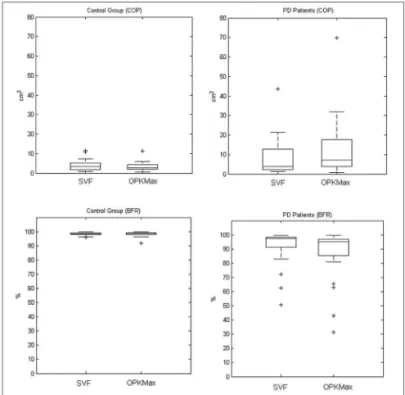
COP and BFR compared in CG and PD
COP and BFR values in the CG didn’t show signifi-cant difference between SVF and OK stimulation (COP
p=0.1531, BFR p=0.1161).
For the PD patients there was significant difference in COP and BFR values between both conditions (COP
p=0.0017, BFR p=0.0025). Figure 3 presents box plot results for SVF and OK conditions for both populations.
better than all other parameters except for the LOS which has lower specificity yet better sensitivity.
Figure 3. Boxplot comparing results for the COP of the CG between SVF and OK conditions (upper-left), BFR of the CG between both conditions (lower-left), COP of the PD group between both conditions (upper-right) and BFR of the PD group between both conditions (lower-right).
COP and BFR compared between CG and PD in the two sensory Conditions (SVF-OK).
A comparison between the 2 groups (CG and PD) was done to study the behaviour of the COP and BFR in SVF and OK conditions.
COP with SVF showed no difference between the two populations (p=0.1992). While LOS, BFR with SVF and both COP and BFR for OK stimulation showed a significant difference between CG and PD patients (p<0.001, p=0.0035,
p<0.001 and p<0.001).
Figure 4 shows the box plot of the CG and PD patients for all parameters (LOS, COP, BFR).
ROC analysis
BFR with OK stimulation proved to be a better discriminator under ROC analysis than LOS, COP in both conditions and BFR with SVF (AUC BFR OK = 0.89583, AUC LOS = 0.78299, AUC COP SVF = 0.61979, AUC COP OK = 0.81771, AUC BFR SVF = 0.74653). BFR for OK presented
Figure 4. Box plot of the COP of both groups with SVF and OK conditions (Upper left). Box plot of the BFR in the same groups and conditions (Upper right). Box plot of the LOS comparing the CG and PD patients (Lower right).
Figure 5. Graphic representation of the sensitivity and specificity cal-culated by ROC curves for the BFR with OK condition.
DISCUSSION
for the body swaying in these patients is less than when they are subjected to a stable visual field, thereby increas-ing the risk of falls. The results suggest the importance of the visual sensory information on the postural control response in PD patients.
The model of postural control system described in Figure 1 may help to understand the meaning of these findings. Many authors have suggested that the postural control system in humans alters the weighting of sensory orientation cues as environmental conditions change9-11.
The dynamic behavior of the model (Figure. 1) changes according to the values of the three weighting factors. Each factor represents the weight that the central nervous system will give to the information coming from its respective sensor (visual, vestibular or somatosensory). As suggested by Peterka11, the values of the weighting factors can be
altered according to the environment in which the subject is immersed, specifically discarding information which is not suitable to correctly estimate the deviation from the vertical and prioritizing those inputs which may be giving more accurate information. Our results together with those proposed by Peterka suggest that the control group can minimize the weighting of the visual input when an opto-kinetic flow is present and thus maintaining similar values of BFR in both conditions. On the other hand, either by minimizing the visual weighting, PD patients must rely on their somatosensory cues which are likely to be impaired12
or they do not correctly discard the visual information. This may explain the deterioration in the results when the PD patients are stimulated with a “dynamic visual field” (OK stimulation).
CONCLUSIONS
This study shows the impact on balance and pos-tural control due to changes in one of the visual cues (mo-tion) in PD patients. Postural control skills in these patients is impaired when they are submitted to a constant visual flow. As a consequence, it shows the risks of instability and falls in open spaces. This paper also suggests the use of BFR to measure postural control with changes on the sensory input.
REFERENCES
1 Grimbergen YA, Langston JW, Roos RA, Bloem BR. Postural instabi-lity in Parkinson’s disease: the adrenergic hypothesis and the locus coeruleus. Expert Rev Neurother. 2009;9(2):279-90.
2. Jobst EE, Melnick ME, Byl NN, Dowling GA, Aminoff MJ. Sensory perception in Parkinson disease. Arch Neurol. 1997;54(4):450-4. 3. Bronstein A, Hood JD, Gresty MA, Panagi C. Visual control of
bal-ance in cerebellar and parkinsonian syndromes. Brain. 1990;113(Pt 3):767-79.
4. Azulay JP, Mesure S, Amblard B Pouge JT. Increased visual de-Azulay JP, Mesure S, Amblard B Pouge JT. Increased visual de-pendence in Parkinson’s disease. Percept Mot Skills. 2002;95(3 Pt 2):1106-14.
5. Davidsdottir S, Wagenaar R, Young D, Cronin-Golomb A. Impact of optic flow perception and egocentric coordinates on veering in Parkinson’s disease. Brain. 2008;131(Pt 11):2882-93.
6. Suarez H, Geisinger D, Suarez A, Carrera X. Buzo R. Postural control and sensory perception in patient with Parkinson’s disease. Acta Otolaryngol. 2009;129(4):354-60.
7. Pastor MA, Day BL. Marsden CD. Vestibular induced postural res-ponses in Parkinson’s disease. Brain. 1993;116(Pt 5):1177-90. 8. Mannan SK, Hodgson TL, Husain M, Kennard C. Eye movements in
visual search indicate impaired saliency processing in Parkinson’s disease. Prog Brain Res. 2008;171:559-62.
9. Maurer C, Peterka RJ. A new interpretation of spontaneous sway measures based on a simple model of human postural control. J Neurophysiol.2005;93(1):189-200.
10. Maurer C, Mergner T, Peterka RJ. Multisensory control of human upright stance. Exp Brain Res. 2006;171(2):231-50.
11. Peterka RJ. Simplifying the complexities of maintaining balance. IEEE Eng Med Biol. 2003;22(2):63-8.