Acta Scientiarum
http://www.uem.br/acta ISSN printed: 1679-9275
ISSN on-line: 1807-8621
Doi: 10.4025/actasciagron.v37i3.19063
Effects of nitrogen and potassium on the chemical composition of
coffee beans and on beverage quality
Junia Maria Clemente1, Herminia Emilia Prieto Martinez1*, Leonardo Corrêa Alves1, Fernando Luíz Finger1 and Paulo Roberto Cecon2
1
Departamento de Fitotecnia, Universidade Federal de Viçosa, Av. P.H. Rolfs, s/n, 36570-000, Viçosa, Minas Gerais, Brazil. 2Departamento de Estatística, Universidade Federal de Viçosa, Viçosa, Minas Gerais, Brazil.*Author for correspondence. E-mail: [email protected]
ABSTRACT. The ratio of nitrogen (N) to potassium (K) is important in the production of specialty coffees because the relative amounts of N and K can either suppress the formation or increase the concentration of compounds that are essential to the flavor and aroma of specialty coffees. The purpose of this study was to evaluate the effect of different N:K ratios (w/w) and K doses on the cup quality of coffee. The concentrations of chemical compounds essentials to achieve good flavor and aroma, the N and K contents, and the caffeine contents of coffee leaves and beans were evaluated in this study. The N:K ratio and the K dose were found to be important factors in cup quality, the best quality corresponding to an N:K ratio of 1:1.56. The best cup quality was obtained from beans with greater PPO activity, caffeine, color index, and sugars and lower total tritatable acidity, pH, electrical conductivity and leached potassium. Keywords: Coffea arabica L., coffee, caffeine, fertilization.
Efeitos de nitrogênio e potássio sobre a composição química de grãos de café e na
qualidade da bebida
RESUMO. A razão entre nitrogênio (N) e potássio (K) pode ser importante para obtenção de cafés especiais, uma vez que doses adequadas destes nutrientes podem suprimir ou aumentar a concentração de certos compostos químicos essenciais ao sabor e aroma da bebida. Objetivou-se com este trabalho avaliar o efeito de diferentes relações N:K e doses de K na qualidade da bebida do café. Foram realizadas avaliações referentes à concentração de compostos químicos essenciais à formação de sabor e aroma dos grãos e teores de N, K e cafeína em folhas e grãos. A relação N:K e o K são importantes definidores da qualidade da bebida de café sendo a melhor qualidade observada na relação N:K 1:1.56. Os grãos que apresentam melhor qualidade da bebida têm maiores atividade da PPO, cafeína, índice de coloração, açúcares redutores e menores acidez total titulável, pH, condutividade elétrica e lixiviação de potássio.
Palavras-chave: Coffea arabica L., café, cafeína, adubação.
Introduction
Nitrogen (N) fertilization is essential for high-yield production of coffee, and N is the most required nutrient for vegetative growth and the second most exported to beans (CATANI; MORAES, 1958). The potassium (K) requirement is commonly considered to be equivalent to the N requirement, even though, unlike N, K is mostly found in the pulp of coffee beans (MORAES; CATANI, 1964).
Mineral nutrients must be available in adequate quantities and at the right phases of plant growth to achieve good productivity and quality of agricultural products. The toxicity or deficiency of nutrients can cause metabolic disorders that do considerable damage to production and quality (PEREIRA; MALTA, 2004). However, supplying nutrients to
plants by fertilization has, over time, favored the achievement of high yields. Recent studies have associated mineral nutrition with the quality of the harvested product. For coffee, which is a perennial crop, the information available on the relation between mineral nutrition and quality is sparse.
The quality of coffee is mainly related to the chemical constituents responsible for the flavor and aroma of the beverage (PEREIRA; MALTA, 2004). The flavor and aroma of coffee are the result of the presence of volatile constituents, caffeine, proteins, amino acids, fatty acids, phenolic compounds, and the action of enzymes on some of these constituents producing compounds that affect the cup quality.
(IKAN, 1991). Its function is limited to giving coffee its bitter taste, but it is not predominant in the coffee beverage (FARAH et al., 2006; NOGUEIRA; TRUGO, 2003; RIBEIRO-ALVES et al., 2003). Caffeine biosynthesis in coffee leaves is induced by low K doses, but is reduced by N deficiency (MAZZAFERA, 1999).
Phenolic compounds are aromatic substances derived from mevalonic and shikimic acids. They influence the taste, flavor and color of many vegetables. Chlorogenic acids are the main non-volatile phenolic compounds found in coffee and are responsible for its astringency. The formation of these compounds can result from a shift in the lignin synthesis route from the p-coumaric acid, which gives rise to caffeic acid and other simple phenyl propanamides. These compounds, together with quinic acid, originate, by esterification, chlorogenic acids (LEHNINGER et al., 2008). High N doses can activate the lignin synthesis route and intermediate compounds that are precursors of chlorogenic acids.
Polyphenol oxidase (PPO) is a copper enzyme linked to cell membranes and is reported to be directly related to coffee cup quality (CARVALHO et al., 2003). Different PPO activity levels are related to different coffee cup classifications: for the rio and rioysh types, the activity is below 55.99 U g-1
sample; for the hard type, the activity is between 55.99 and 62.99 U g-1 sample; for the soft type, the
activity is between 62.99 and 67.66 U g-1, and for the
strictly soft type, the activity is above 67.99 U g-1.
Based on the above information, it is apparent that the compounds considered important definers of the cup quality of coffee are the products of the secondary metabolism of N, and this nutrient certainly plays a significant role in the final quality obtained.
Sugars are also important to the cup quality of coffee. Coffee beans have between 5 and 10% total sugars. The sugars participate in important reactions during the roasting process, such as the Maillard reaction and/or caramelization, which are responsible for the formation of the color (non-enzymatic browning), flavor and aroma of coffee (MENDONÇA et al., 2007).
The acidity of coffee, which can have either beneficial or undesirable effects on cup quality, results from the presence of non-volatile acids, such as oxalic, malic, citric, tartaric, and pyruvic acid, and volatile acids, such as acetic, propionic, valeric and butyric acids, which are produced by endogenous routes related to the metabolism of sugars or fermentation. Standard samples for preparation of espresso coffee
classified as rio and riado flavors have higher acidity than samples classified as soft and strictly soft (FARNEZI et al., 2010; SIQUEIRA; ABREU, 2006).
The functions of K in the metabolism of nitrogen compounds and carbohydrates are well known. K plays a major role in enzyme activation in cells by inducing changes in enzyme conformation. In plants deficient in K, soluble carbohydrates accumulate, decreasing the starch content and accumulating soluble nitrogen compounds. This is related to the high K requirement for operation of certain regulatory enzymes, especially pyruvate kinase and phosphofructokinase. On the other hand, the starch synthase, which catalyses the transfer of glucose into starch molecules, is highly dependent on monovalent cations, including K, which is the most efficient (MARSCHNER, 2011).
Coffee beans from plants that received K2O
doses applied as potassium sulphate varying from 0 to 400 g per plant showed significantly higher PPO activity in the first year of evaluation, and in the next year, the same trend for the activity of this enzyme was observed (SILVA et al., 1999).
Coffee beans from plants fertilized with different N sources were found to exhibit a quadratic response of PPO activity to increased N doses (MALTA et al., 2003). Doses of 50 and 121 kg ha-1
N as ammonium sulfate and ammonium nitrate resulted in higher enzyme activity, with subsequent reduction at higher doses. In contrast, for potassium nitrate, the highest PPO activity occurred with the highest N dose applied, 320 kg ha-1.
Although the effect of nutrition is evident, the trial described above was conducted in the field, which did not permit isolating the effects of N and K or establishing clear cause-and-effect relationships. These were not possible because of the concomitant variations in the doses of accompanying ions and the heterogeneity and variability of the soil environment (MARTINEZ; CLEMENTE, 2011).
Based on the above considerations, the objective of the present study was to evaluate the effect of K and the N:K ratio applied to coffee plantation on the main chemical attributes responsible for the cup quality of coffee and to relate them to the concentrations of these nutrients in leaves and beans. We opted to conduct the experiment with nutrient solutions to isolate the effects of nutrients studied and the effects of their accompanying ions.
Material and methods
greenhouse of the Departamento de Fitotecnia of the Universidade Federal de Viçosa in Viçosa, Brazil, between September 2006 and July 2009.
The plants received nutrient solutions with 1.08, 2.15, 3.23 and 5.38 mmol L-1 of K combined with a
dose of 6 mmol L-1 of N, resulting in N:K ratios
(w/w) of 1:0.5, 1:1, 1:1.5, and 1:2.5. A control treatment received 3 mmol L-1 N and 1.61 mmol L-1
K, resulting in a N:K ratio (w/w) of 1:1.5. The other nutrients were supplied as a half-strength nutrient Steiner solution (STEINER, 1961).
Seedlings of Catuaí Vermelho IAC 99 germinated in a conventional substrate and bearing one pair of true leaves were transferred to a sub-irrigation hydroponic system using expanded clay as the substrate.
The plants were grown in containers 3.75 m long by 0.85 m wide at the top, 0.60 m wide at the base and 0.20 m in height, closed at the ends, waterproofed and filled with expanded clay particles 8–13 mm in diameter to a height of 0.17 m from the base. In this system, the plants were watered with a nutrient solution seven times every 24 hours. The nutrient solution was supplied for 30 minutes every three hours during the day and every six hours overnight.
During cultivation, the pH was monitored and maintained between 5.5 and 6.5 by adding HCl or NaOH (3 mol L-1). The electrical conductivity of
the nutrient solution was monitored daily and adjusted whenever the values showed 30% depletion relative to the start.
Harvesting was carried out 780 days after the beginning of the experiment, when the plants had approximately 90% coffee cherries. Production was measured using six plants in the usable area of the plot. Subsequently, coffee cherries were hand-picked and dried on a bench in a greenhouse to an 11% moisture content. After drying, the coffee beans were hulled and used for the chemical analysis.
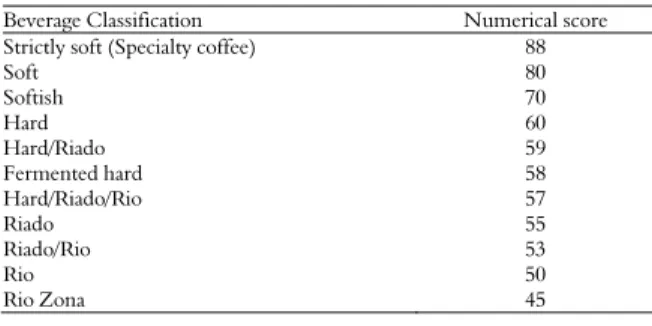
The cup test was performed by professional tasters, using the CoE (cup of excellence) method. Each attribute evaluated (clean beverage, sweet, acidity, body, taste, flavor, and reminiscent taste) receive a score based on the intensity of the taste exhibited in the samples (Table 1).
Table 1. Numericalscores for coffee cup test.
Beverage Classification Numerical score
Strictly soft (Specialty coffee) 88
Soft 80 Softish 70 Hard 60 Hard/Riado 59
Fermented hard 58
Hard/Riado/Rio 57 Riado 55 Riado/Rio 53 Rio 50
Rio Zona 45
To diagnose the nutritional status of the plants, leaves were collected from the third or fourth node, from the apex to the basis of the branches, in the middle third of the plants, during the period between flowering and rapid fruit expansion.
To evaluate the nutrient content of the beans, we took samples of 100 g of benefited beans for each treatment. The N content was determined by the Kjeldahl method, (BREMNER, 1965) and the K content was determined by the flame absorption photometry method (JOHNSON; ULRICH, 1959).
The caffeine in the leaves and beans was extracted and analyzed using the method described by Vitorino et al. (2001).
The extraction of PPO from the beans was conducted according to the method described by Concellón et al. (2004) using DOPA (L-3,4 dihidroxifenil-alanine) as substrate.
Bean total phenols were extracted using the Folin Denis method (MORAIS et al., 2007).
Bean color index was determined using the method described by Singleton (1966), adapted for coffee.
Bean reducing sugars and total sugars were extracted and determined as described by the Knopp et al. (2006).
The acidity of the beans was determined by titration with NaOH 0.1 mol L-1 and expressed in
mL of NaOH 0.1 mol L 100 g-1 sample (AOAC,
1990). From the same extract, the pH was determined with a pH meter (AOAC, 1990).
The methods employed to determinate the electrical conductivity and potassium leached for the beans were those adapted and described by (PRETE, 1995).
An analysis of variance (ANOVA) of the data was conducted. The means of the control (N:K ratio of 1:1.5) and the other treatments were compared using Dunnett’s test at the 5% significance level. The data for the treatments with various K rates were subjected to regression analysis. The statistical analyses were performed using the SAEG statistical software (EUCLYDES, 1983).
By deriving an equation for cup quality as a function of K dosage, we were able to determine the dosage of K associated with the best cup quality (the maximum point). This dosage was used to estimate coffee production and the leaf content of K (the nutritional status of the plant) when high coffee quality is attained.
Results and discussion
the treatment with the N:K ratio of 1:0.5, whose doses of N and K were 6.0 and 1.08 mmol L-1,
respectively. Responses to K doses were observed for almost all of the variables evaluated.
The production of cherry coffee was significantly different for the treatments with the same N:K ratios and different doses of those nutrients (6.0 and 3.23 mmol L-1 X 3.0 and 1.61 mmol L-1), indicating
that in this experiment, the N:K ratio was not important definer of the production of cherry coffee. Production for treatments with N doses higher than that of the control treatment and K doses relatively close to the control dose (N:K 1:0.5 – 6.0 and 1.08 mmol L-1 of N and K and N:K 1:1 –
6.0 and 2.15 mmol L-1 N and K) were not
significantly different of the production obtained for the control treatment, which suggests that the K dose, not the N dose, affected the production of cherry coffee (Table 2).
However, in comparing the two treatments with N:K ratios of 1:1.5, no difference was detected between them with respect to cup quality, which indicates the effect of the N:K ratio on this variable (Table 2).
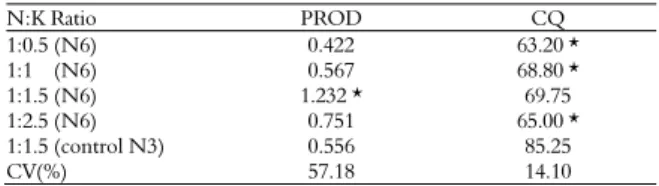
Table 2. Production of cherry coffee (PROD, kg per plant) and cup quality (CQ) of coffee produced in nutrient solution with different N:K ratios.
N:K Ratio PROD CQ
1:0.5 (N6) 0.422 63.20 *
1:1 (N6) 0.567 68.80 *
1:1.5 (N6) 1.232 * 69.75
1:2.5 (N6) 0.751 65.00 *
1:1.5 (control N3) 0.556 85.25
CV(%) 57.18 14.10
Means followed by * differ statistically from the control treatment at the 10%
significance level, according to Dunnett’s test.
At a dose of 6.0 mmol L-1, there was a quadratic
response to the K dose. Initially, there was an increase in cup quality with increasing K, reaching a maximum at 3.36 mmol L-1 of K. (Figure 1). It is
worth noting that the point of maximum quality occurred at a K dose slightly lower than that which promoted the highest coffee production per plant (3.72 mmol L-1 K, as shown in Figure 1).
Using 3.36 mmol L-1 of K as the dependent
variable in the mathematical functions obtained for the relationship between K dose and K content in the leaves, and between K dose and N content in the leaves, we obtained 3.01 and 2.94 dag kg-1. It is
interesting that the N and K leaf contents corresponding to the point of optimal cup quality, as evaluated by the cup test, were both at the upper limit of the sufficiency range used for diagnosing the nutritional status of coffee plants (MARTINEZ et al., 2003). Using the same procedure, the K content estimated in beans at the maximum point of
sensory quality was 1.82 dag kg-1. It should also be
noted that 3.36 mmol L-1 of K, the dose that
provided a beverage of the highest quality, was found to result in a level of plant production only 1.3% lower than that corresponding to the maximum yield of individual plants. This result is not consistent with the widespread belief that the greatest production most likely does not correspond to the highest quality.
PROD = -0.403 + 0.794*K - 0.107*K² R²=0.72
0 1 2 3 4 5 6
P
R
OD (
k
g
p
la
n
t-1
)
0.0 0.2 0.4 0.6 0.8 1.0 1.2 1.4
CQ = 54.64 + 9.708*K - 1.531*K² R²=0.99
Doses of K (mmol L-1)
CQ
0 52 54 56 58 60 62 64 66 68 70 72
Figure 1. Production of cherry coffee (PROD) and cup quality of coffee (CQ) as functions of the K dose in the nutrient solution.
Significant differences in contents of N in leaves (LN), K in leaves (LK) and N in beans (BN) were found between the treatment with an N:K ratio of 1:1.5 (6.0 and 3.23 mmol L-1 ) and the control
treatment (N:K 1:1.5 – 3.0 and 1.61 mmol L-1),
indicating that the individual effects of the N and K doses prevailed over the effect of the N:K ratio. In general, the leaves of plants that received higher doses of N and K had higher concentrations of these nutrients (Table 3).
Comparing the two treatments with the same N:K ratio, there was no significant difference detected in the K content in beans (BK), indicating the effect of this relation on this characteristic (Table 3). Interestingly, however, the control plants had a bean yield 39% lower than the plants treated with an N:K ratio of 1:1.5 and higher doses of N and K. It is noteworthy that for all treatments except the control, the foliar contents of N and K were within or above the range considered adequate for coffee (from 2.47 to 3.2 for N and from 1.97 to 3.10 for K, according to MARTINEZ et al., 2003).
indicating little effect of the N:K ratio on this variable. The same was true at the final stage of fruiting, that is, at harvest (Table 4).
Table 3. N and K contents in coffee leaves (LN and LK - dag kg-1
) and coffee beans (BN and BK - dag kg-1
) of plants cultivated with different N:K ratios
N:K ratio LN LK BN BK
1:0.5 (N6) 3.35 * 2.62 * 2.41 * 1.68 *
1:1 (N6) 3.19 * 2.71 * 2.32 * 1.81
1:1.5 (N6) 2.98 * 2.88 * 2.27 * 1.77
1:2.5 (N6) 3.12 * 3.27 * 1.96 1.82
1:1.5 (control N3) 1.85 2.14 1.65 1.85
CV(%) 9.40 7.10 12.96 4.83
Means followed by * differ statistically from the control treatment at the 5% significance
level, according to Dunnett’s test.
As for the beans, the caffeine levels observed for the treatments with N:K ratios of 1:0.5 and 1:1 were significantly different from those for the control treatment, resulting in lower means (Table 4). A comparison between the treatments with the same N:K ratio and different doses of these nutrients did not reveal significant differences, indicating that perhaps the effect of the ratio overwhelms the effect of the nutrient doses.
Despite the apparent direct relationship between N and caffeine in leaves before fruit filling, the effect of this nutrient on the caffeine content of leaves at the end of the cultivation cycle and in beans (Table 4) was different from the effect expected, considering the content found in the initial phase, which might be due to dilution effects promoted by differences in the coffee yields obtained.
The estimated caffeine contents were within the range of 8–14 mg g-1, which is normal for Coffea
arabica (MONTEIRO; TRUGO, 2005).
Table 4. Caffeine contents in index leaves (CL1 - mg g-1), leaves collected at harvest (CL2 - mg g-1
) and in processed beans (CB - mg g-1) of coffee produced in nutrient solution with different N:K ratios
N:K ratio CL1 CL2 CB
1:0.5 (N6) 5.31 * 6.82 11.20 *
1:1 (N6) 5.36 * 5.96 11.10 *
1:1.5 (N6) 5.01 * 6.88 11.84
1:2.5 (N6) 4.51 * 6.42 11.64
1:1.5 (control N3) 2.73 6.34 13.18
CV(%) 12.11 13.51 9.60
Means followed by * differ significantly from that of the control treatment, according to
Dunnett’s test.
At the higher N dose, the increase in K dose resulted in a decreasing linear response in the caffeine content in index leaves at the initial stage of fruiting (Figure 2). The results corroborate those obtained by Mazzafera (1999), who found that the omission of K in the nutrient solution induced the highest caffeine content in leaves.
In beans, at the end of fruiting, the response followed a crescent quadratic shape, and the K dose
of 4.61 mmol L-1 corresponded to the highest
production of caffeine (Figure 2).
CB =10.65 + 0.460*K - 0.049*K² R²=0.57
Doses of K (mmol L-1)
0 1 2 3 4 5 6
CB (mg g
-1)
0.0 10.4 10.6 10.8 11.0 11.2 11.4 11.6 11.8 12.0
CL = 5.651 - 0.202*K r²=0.91
CL (
m
g g
-1)
0.0 4.2 4.4 4.6 4.8 5.0 5.2 5.4 5.6 5.8 6.0
Figure 2. Caffeine contents in leaves (CL) in the period between flowering and rapid expansion of the fruits and caffeine in processed coffee beans (CB) as a function of the K dose in the nutrient solution.
These results indicate that the K concentrations in leaves and beans must be sufficient to ensure growth and production via primary metabolism of N routes but also low enough to generate satisfactory amounts of compounds derived from secondary metabolism of N routes.
The PPO activity and CI levels for the treatments with N:K ratios of 1:0.5, 1:1, 1:1.5 and 1:2.5 were significantly different from those for the control treatment, which demonstrates the effects of the N and/or K doses rather than the N:K ratio (Table 5).
For the control treatment, the CI was directly related to the PPO activity, these being the coffees that had the best cup quality. These results are in agreement with those reported by Silva et al. (2002), who reported that in beans with good cup quality, the PPO activity was 66.20 U g-1 sample and CI was
1.015 DO 425 nm. However, the same was not true for the other treatments, with a dose of 6 mmol L-1
N combined with different K doses; for these treatments, the highest CI level did not correspond to higher means levels of PPO activity (Table 5).
For TP and TS, there were no significant differences between the N:K ratio 1:1.5 established with 6.0 mmol L-1 N and the control treatment, and
neither were there significant differences in TP or TS between the other ratios and the control treatment. These results indicate that the N:K ratio does not influence the TP content in coffee beans (Table 5).
Table 5. Color index (CI - DO 425 nm), total phenols (TP - %) polyphenol oxidase activity (PPO - U g-1), total sugars (TS - %) and reducing sugars (RS - %) in beans of Coffea arabica in response to N:K ratios obtained with different doses of these nutrients in nutrient solution
N:K ratio PPO TP CI TS RS
1:0.5 (N6) 63.04 * 5.18 0.462 * 3.62 0.368 *
1:1 (N6) 65.12 * 6.00 0.360 * 4.26 0.415 *
1:1.5 (N6) 62.90 * 5.74 0.255 * 3.92 0.454
1:2.5 (N6) 65.82 * 5.93 0.213 * 4.16 0.438
1:1.5 (control N3) 73.00 5.60 0.857 4.12 0.504
CV(%) 6.10 5.40 27.30 9.20 11.60
Means followed by * differ significantly from the control treatment mean, according to Dunnett’s test.
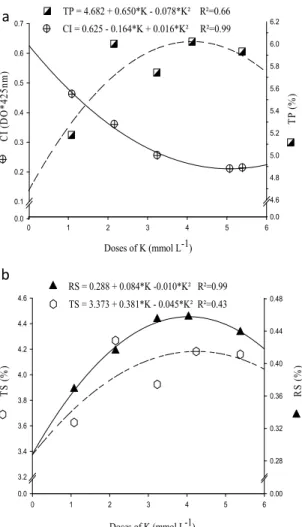
At a N dose of 6.0 mmol L-1, there was no
significant response to K rates, and the mean value of PPO activity was 64.22 U g-1 sample. The CI and TP
showed decreasing quadratic and increasing quadratic responses, respectively, to increasing K dose, the minimum and maximum values corresponding to doses of 5.06 and 4.12 mmol L-1 of K in the nutrient
solution for CI and TP, respectively (Figure 3a). The contents of TS and RS, for an N dose of 6.0 mmol L-1, increased with increasing K dose, reaching
maximum values at doses of 4.24 and 4.04 mmol L-1 of
K, respectively, in nutrient solution (Figure 3b).
TP = 4.682 + 0.650*K - 0.078*K² R²=0.66
0 1 2 3 4 5 6
TP
(%
)
0.0 4.6 4.8 5.0 5.2 5.4 5.6 5.8 6.0 6.2
CI = 0.625 - 0.164*K + 0.016*K² R²=0.99
Doses of K (mmol L-1)
C
I (
D
O
*
425n
m
)
0.0 0.1 0.2 0.3 0.4 0.5 0.6 0.7
RS = 0.288 + 0.084*K -0.010*K² R²=0.99
0 1 2 3 4 5 6
RS
(%
)
0.00 0.28 0.32 0.36 0.40 0.44 0.48
TS = 3.373 + 0.381*K - 0.045*K² R²=0.43
Doses of K (mmol L-1)
TS (
%
)
0.0 3.2 3.4 3.6 3.8 4.0 4.2 4.4 4.6
Figure 3. Effect of K dose on the coloration index (CI), total phenols (TP), total sugars (TS) and reducing sugars (RS) in coffee beans.
In general, the color indexes observed in this study were below those reported in the literature, i.e., 0.69 DO 425 nm for hard flavors and 0.870 DO 425 nm for the soft flavor (LIMA et al., 2008). However, they were consistent with the cup quality as evaluated using the cup test.
Fruits harvested at the different stages had different contents of total phenols, varying from 6.86 to 7.85% (PIMENTA; VILELA, 2003). In this study, the percentage of TP in beans of better quality was 5.97%, which is below the mean of 7% reported in the literature. The beverage standard in this study ranged from hard to softish for most of the treatments. Only the control treatment approached the standard strictly soft.
PPO acts on phenolic compounds that exist in the cytosol and form quinones that polymerize with organic molecules to produce the dark color characteristic of coffee. If phenolic compounds are in high concentration in the cytosol, the product of the enzyme reaction under the substrate is likely to inhibit the enzyme, and its activity will be low.
The results corroborate those of Silva et al. (1999), who observed high PPO activity and high CI and low concentrations of TP with increasing levels of potassium fertilization. This effect can be explained by the fact that in specialty coffees, fewer injuries (mechanical, physiological or microbial) occur; such that phenolic compounds are not released from the vacuole to the cytosol in large quantities. It can therefore be inferred that K has an essential role in maintaining the structural integrity of the membrane and its selective permeability, preventing bean deterioration.
Silva et al. (1999), studying sources and K doses, observed that coffee beans of the best quality, harvested from plants fertilized with potassium sulphate, showed higher enzymatic activity of PPO and higher levels of RS. In contrast, when potassium chloride was used, TS and enzymatic activity of PPO were reduced.
In this study, in the coffee beans of the best quality, as evaluated by the cup test, the contents of RS and TS were 0.45 and 4.15%, respectively. High-quality coffees have high contents of sugars,
a
averaging approximately 7.23% (MALTA et al., 2003) and ranging from 7.33 to 8% (BORÉM et al., 2008). In general, the values obtained in this study were below the means cited in the literature.
The effect of sugars on cup quality has been the subject of several studies because there are questions about what types and concentrations of sugars in beans would exert a positive effect on quality. In fact, it is believed that sucrose is completely degraded during roasting, producing smaller sugars, precursors of acids and aldehydes responsible for the aroma of coffee (SILVA et al., 2002). In the control treatment, PPO activity was associated with higher RS contents, leading us to believe that these are very good chemical indicators of quality.
Treatments with the same N:K ratio and different doses of these nutrients (6.0 and 3.23 mmol L-1 X 3.0 and 1.61 mmol L-1) did not differ
with respect to TTA, EC or KL. The higher means of TTA, EC and KL for the treatment with the N:K ratio 1:0.5 were most likely due to the K dose being inadequate; moreover, the lack of significant difference between the treatments with N:K ratios of 1:1, 1:1.5 and 1:2.5 and the control treatment indicates that the TTA, EC and KL remain stable with large variations in the N:K ratio. However, the pH did not show differences among the two treatment with N:K ratio 1:1.5, but the pH values of the treatment with an N:K ratio of 1:0.5 and 1:2.5 were significantly different from that of the control treatment, indicating a possible effect of the N:K ratio on this variable (Table 6).
Table 6. Total tritatable acidity (TTA- mL of NaOH 100 g-1), pH, electrical conductivity (EC - μS cm-1 g-1) and potassium leached (KL in μg g-1
) of Coffea arabica beans in response to N:K ratios obtained with different doses of these nutrients in nutrient solution
N:K ratio TTA pH CE KL
1:0.5 (N6) 160.0 * 5.98 * 449.4 * 27.19 *
1:1 (N6) 135.0 5.83 396.4 26.07
1:1.5 (N6) 131.2 5.76 327.5 22.11
1:2.5 (N6) 132.5 5.81 * 396.2 25.26
1:1.5(control N3) 90.00 5.71 267.8 20.09
CV(%) 24.04 1.18 27.44 18.01
Means followed by * differ significantly from the control treatment mean, according to Dunnett’s test.
The EC means observed were greater than those found in the literature, between 84 and 114 μS cm-1
g-1 for coffees classified as good cup quality and
between 119 and 129 μS cm-1 g-1 for coffees classified
as medium quality. The values obtained for KL are in agreement with those reported in the literature, i.e., 24.37 mg L-1 for coffee beans of high cup quality
harvested at the cherry stage (PIMENTA et al., 1997).
The differences in the variation trends of pH and TTA were most likely caused by the low precision of the pH meter. Furthermore, the occurrence of a one-point variation in the pH range requires the variation of a thousand units of protons in solution, which did not occur in this experiment. The total titratable acidity is the most reliable means of evaluating the acidity of the cup quality of coffee.
Note that the TTA remained below the index of 212.2 mL NaOH 100 g-1 sample, which is
considered a good measure, matching with high-quality coffees. The pH value of 5.77 obtained for the best cup quality is consistent with values previously reported and within the range of 5.73– 5.88 (SIQUEIRA; ABREU, 2006).
The control treatment showed high PPO activity, low TTA, high CI, low pH and low EC, correlating positively with the cup quality of the coffee.
The effect of the K dose on the EC and KL followed a decreasing quadratic trend with minimum points at doses of 3.63 and 3.67 mmol L-1
of K, respectively, in the nutrient solution (Figure 4a). TTA and pH exhibited decreasing quadratic responses with minimum points estimated as 3.96 and 3.86 mmol L-1 of K, respectively, in the nutrient
solution (Figure 4b).
The explanation for the increase in the EC and KL with the application of high doses of K seems to be that K promotes competition between cations and inhibits the absorption of calcium, which is essential for maintaining the structural integrity of the plasma membrane.
According to Carvalho et al. (1994), TTA has an inverse relationship with the PPO activity and CI. In general, in this study, TTA remained quite low and mostly for the control treatment was associated with high PPO activity, high CI, high RS and consequently coffee beans of high cup quality. KL and EC have been used as indicators of the integrity of cell membranes (NOBRE et al., 2007; PIMENTA; VILELA, 2002).
According to Prete (1995), higher KL and EC levels are directly related to the absorption of water by coffee beans. In addition, according to Gourlart et al. (2007), a high KL, with a consequent increase in EC, is a strong indicator of damage to the membrane and the cell wall.
EC = 577.5 - 131.8*K + 18.15*K² R²=0.92
Doses of K (mmol L-1)
0 1 2 3 4 5 6
EC (
µ
S
.c
m
-1.g
-1
0)
0 300 350 400 450 500 550 600
KL = 32.44 - 5.122*K + 0.698*K² R²=0.76
KL
(p
p
m
)
0 20 22 24 26 28 30 32 34 36
TTA = 186.9 - 30.0*K + 3.79*K² R²=0.95
0 1 2 3 4 5 6
T
T
A (
m
L
Na
OH 1
0
0
g
-1 of
s
am
p
le
)
0 120 130 140 150 160 170 180 190
200 pH = 6.198 - 0.232*K + 0.030*K² R²=0.99
Doses of K (mmol L-1)
p
H
0.0 5.8 6.0 6.2 6.4 6.6
Figure 4. Electrical conductivity (EC), potassium leached (KL), total titratable acidity (TTA) and pH of coffee beans as functions of the K dose in the nutrient solution.
Conclusion
Potassium has a positive effect, increasing the bean yield, caffeine content, total phenols, total and reducing sugars, and decreasing total tritatable acidity of Coffea arabica L. up to a point, beyond which its effect on these characteristics becomes deleterious. In contrast, electrical conductivity and potassium leached decrease with increasing K to a point associated with the optimal dose.
The N:K ratio influences the quality of the coffee beverage, with 1:1.56 being the optimal N:K ratio for producing quality coffee.
The best cup quality is achieved in plants with foliar concentrations of 3.01 dag kg-1 N and 2.94 dag
kg-1 of K.
Concentrations of 2.20 dag kg-1 of N and 1.82
dag kg-1 of K in beans are associated with better cup
quality.
High levels of PPO activity, caffeine, color index and sugars and lower levels of total acidity, pH, electrical conductivity and potassium leached from beans result in a high-quality coffee beverage.
Acknowledgements
The authors thank the financial aid of CNPq (Conselho Nacional de desenvolvimento Científico e Tecnológico), CAPES (Coordenação de Aperfeiçamento de Pessoal de Nível Superior) and FAPEMIG (Fundação de Amparo à Pesquisa de Minas Gerais). They also thank Dr. Paulo Mazzafera for his contribution doing the analysis of caffeine.
References
AOAC-Association of Official Analytical Chemists.
Official methods of analyses of the Association of Official Analytical Chemists. 15th ed. Washington, D.C.: AOAC, 1990.
BREMNER, J. M. Total nitrogen. In: BLACK, C. A. (Ed.). Methods of soil analysis. Madison: American Society of Agronomy, 1965. p. 1149-1178.
BORÉM, F. M.; CORADI, P. C.; SAATH, R.; OLIVEIRA, J. A. Qualidade do café natural e despolpado após secagem em terreno e com altas temperaturas. Ciência e Agrotecnologia, v. 32, n. 5, p. 1609-1615, 2008.
CARVALHO, V. D.; CHALFOUN, S. M.; CHAGAS, S. J. R.; BOTREL, N.; JUSTE JÚNIOR, E. S. G. Relações entre a composição físico-química e química do grão beneficiado e da qualidade de bebida do café. Pesquisa Agropecuária Brasileira, v. 29, n. 3, p. 449-454, 1994. CARVALHO, G. R.; MENDES, A. N. G.; CARVALHO, L. F.; BARTHOLO, G. F. Eficiênica do ethephon na uniformização e antecipação da maturação de frutos de cafeeiros (Coffea arabica L.) e qualidade da bebida. Ciênica de Agrotecnologia, v. 27, n. 1, p. 98-106, 2003.
CATANI, R. A.; MORAES, F. R. P. A composição química do cafeeiro. Revista de Agricultura, v. 1, n. 33, p. 45-57, 1958.
CONCELLÓN, A.; ANON, M. C.; CHAVES, A. R. Characterization and changes in polyphenol oxidase from eggplant fruit (Solanum melongena L.) during storage at low temperature. Food Chemistry, v. 88, n. 1, p. 17-24, 2004. EUCLYDES, R. F. Sistema para análises estatísticas -
SAEG. Viçosa: UFV, 1983.
FARAH, A.; MONTEIRO, M. C.; CALADO, V.; FRANCA, A. S.; TRUGO, L. C. Correlation between cup quality and chemical attributes of Brazilian coffee.
Food Chemistry, v. 98, n. 2, p. 373-380, 2006.
FARNEZI, M. M. M.; SILVA, E. B.; GUIMARAES, P. T. E.; PINTO, N. A. V. D. Levantamento da qualidade da bebida do café e avaliação do estado nutricional dos cafeeiros do Alto Jequitinhonha, Minas Gerais, através do DRIS. Ciência e Agrotecnologia, v. 34, n. 5, p. 1191-1198, 2010.
GOULART, P. F. P.; ALVES, J. D.; CASTRO, E. M.; FRIES, D. D.; MAGALHÃES, M. M.; MELO, H. C. Aspectos histoquímicos e morfológicos de grãos de café de diferentes qualidades. Ciência Rural, v. 37, n. 3, p. 662-666, 2007.
a
IKAN, R. Natural products: a laboratory guide. New York: Harcourt Brace Jovanovich Publishers, 1991. JOHNSON, C. M.; ULRICH, A. Analytical methods for use in plants analyses. Los Angeles: University of California, 1959.
KNOPP, S. E.; BYTOF, G.; SELMAR, D. Influence of processing on the content of sugars in green Arabica coffee beans. Food Research Technology, v. 223, n. 2, p. 195-201, 2006.
LEHNINGER, A.; NELSON, D. L.; COX, M. M.
Lehninger principles of biochemistry. New York: W H Freeman and Company, 2008.
LIMA, M. V.; VIEIRA, H. D.; MARTINS, M. L. L.; PEREIRA, S. M. F. Preparo do café despolpado, cereja descascado e natural na região sudoeste da Bahia. Revista Ceres, v. 55, n. 2, p. 124-130, 2008.
MALTA, M. R.; NOGUEIRA, F. D.; GUIMARÃES, P. T. G. G.; SILVA, F. A. M. Composição química, produção e qualidade do café fertilizado com diferentes fontes de nitrogênio. Ciência e Agrotecnologia, v. 27, n. 6, p. 1246-1252, 2003.
MARSCHNER, H. Mineral nutrition of higher plants. New York: Academic Press, 2011.
MARTINEZ, H. E. P.; MENEZES, J. F. S.; SOUZA, R. B.; VENEGAS, V. H. A; GUIMARÃES, P. T. G. Faixas críticas de concentração de nutrientes e avaliação do estado nutricional de cafeeiros em quatro regiões de Minas Gerais. Pesquisa Agropecuária Brasileira, v. 38, n. 6, p. 703-713, 2003.
MARTINEZ, H. E. P.; CLEMENTE, J. M. O uso do cultivo hidropônico de plantas em pesquisa. Viçosa: UFV, 2011.
MAZZAFERA, P. Mineral nutrition and caffeine contentin coffee leaves. Bragantia, v. 58, n. 2, p. 387-391, 1999. MENDONÇA, L. M. V. L.; PEREIRA, R. G. F. A.; MENDES, A. N. G.; BORÉM, F. M.; MARQUES, E. R. Composição química de grãos crus de cultivares de Coffea
arabica L. suscetíveis e resistentes à Hemileia vastatrix Berg et
Br. Ciência e Agrotecnologia, v. 31, n. 2, p. 413-419, 2007. MONTEIRO, M. C.; TRUGO, L. C. Determinação de compostos bioativos em amostras comerciais de cafe torrado. Química Nova, v. 28, n. 4, p. 637-641, 2005. MORAES, F. R. P.; CATANI, R. A. Absorção de elementos minerais pelo fruto cafeeiro durante sua formação. Bragantia, v. 23, n. 26, p. 331-336, 1964. MORAIS, S. A. L.; LIMA, S. R.; OLIVEIRA, G. S.; NASCIMENTO, E. A.; CHANG, R. Estudo dos constituintes macromoleculares, extrativos voláteis e compostos fenólicos da madeira de candeia Moquinia
polymorpha. Ciência Florestal, v. 17, n. 2, p. 145-155, 2007.
NOBRE, G. W.; BORÉM, F. M.; FERNANDES, S. M.; PEREIRA, R. G. F. A. Alterações químicas do café-cereja descascado químicas do café-cereja descascado durante o armazenamento. Coffee Science, v. 2, n. 1, p. 1-9, 2007. NOGUEIRA, M.; TRUGO, L. C. Distribuição de isômeros de ácido clorogênico e teores de cafeína e
trigonelina em cafés solúveis brasileiros. Ciência e Tecnologia de Alimentos, v. 23, n. 2, p. 296-299, 2003. PEREIRA, R. G. A.; MALTA, M. R. Fatores que podem promover alterações nos grãos de café. In: PEREIRA, R. G. F. A. (Ed.). Qualidade do café/ Cafés especiais. Lavras: UFLA/FAEPE, 2004. p. 25-39.
PIMENTA, C. J.; CHAGAS, S. J. R.; COSTA, L. Polifenoloxidase, lixiviação de potássio e qualidade de bebida do café colhido em quatro estádios de maturação. Pesquisa Agropecuária Brasileira, v. 32, n. 2, p. 171-177, 1997. PIMENTA, C. J.; VILELA, E. R. Qualidade do café
(Coffea arabica L.) colhido em sete épocas diferentes na
região de Lavras-MG. Ciência e Agrotecnologia, v. 26, ed. esp., p. 1481-1491, 2002.
PIMENTA, C. J.; VILELA, E. R. Efeito do tipo e época de colheita na qualidade do café (Coffea arabica L.). Acta Scientiarum, v. 25, n. 1, p. 131-136, 2003.
PRETE, C. E. C. Condutividade elétrica do exsudato de grãos de café (Coffea arabica L.). Desenvolvimento da metodologia. Ciências Agrárias, v. 21, n. 1, p. 67-70, 1995. RIBEIRO-ALVES, M. A.; TRUGO, L. C.; DONANGELO, C. M. Use of oral contraceptives blunts the calciuric effect of caffeine in young women. Journal of Nutrition, v. 2, n. 133, p. 393-398, 2003.
SILVA, E. B.; NOGUEIRA F. D.; GUIMARÃES, P. T. G.; CHAGAS, S. J. R.; COSTA, L. Fontes e doses de potássio na produção e qualidade do grão de café beneficiado. Pesquisa Agropecuária Brasileira, v. 34, n. 3, p. 335-345, 1999.
SILVA, E. B.; NOGUEIRA, F. D.; GUIMARÃES, P. T. G. Qualidade dos grãos de café em função de doses de potássio. Acta Scientiarum, v. 24, n. 5, p. 1291-1297, 2002.
SINGLETON, V. L. The total phenolic content of grape berries during the maturation of several varieties.
American Journal of Enology and Viticulture, v. 17, n. 2, p. 126-134, 1966.
SIQUEIRA, H. H.; ABREU, C. M. P. Composição físico-química e qualidade do café submetido a dois tipos de torração e com diferentes formas de processamento.
Ciência e Agrotecnologia, v. 30, n. 1, p. 112-117, 2006. STEINER, A. A. A universal method for preparing nutrient solutions of a certain desired composition. Plant and Soil, v. 15, n. 2, p. 134-154, 1961.
VITORINO, M. D.; FRANÇA, A. S.; OLIVEIRA, L. S.; BORGES, M. L. A. Metodologia de obtenção de extrato de café visando a dosagem de compostos não voláteis. Revista Brasileira de Armazenamento, v. 26, n. 3, p. 17-24, 2001.
Received on November 5, 2012. Accepted on April 10, 2013.