DIURNAL AND SPATIAL (VERTICAL) DYNAMICS
OF NUTRIENTS (N, P, Si) IN FOUR SAMPLING DAYS
(SUMMER, FALL, WINTER, AND SPRING) IN A
TROPICAL SHALLOW RESERVOIR AND THEIR
RELATIONSHIPS WITH THE
PHYTOPLANKTON COMMUNITY
RAMÍREZ, J. J.1 and BICUDO, C. E. M.2
1Instituto de Biología, Universidad de Antioquia, Apartado aereo 1226, Medellín, Colombia 2Seção de Ecologia, Instituto de Botânica, C.P. 4005, CEP 01061-970, São Paulo, SP, Brazil
Correspondence to: Carlos E. de M. Bicudo, Seção de Ecologia, Instituto de Botânica, C.P. 4005, CEP 01061-970, São Paulo, SP, Brazil, e-mail: [email protected]
Received May 21, 2003 – Accepted July 9, 2003 – Distributed February 28, 2005 (With 11 figures)
ABSTRACT
The vertical and diurnal variation of nitrogen and phosphorus forms, as well as that of soluble re-active silica (SRS), were studied in four sampling days at Garças reservoir, a shallow tropical one located in the city of São Paulo, in southeastern Brazil. Except for N-NH4, all other inorganic forms of nitrogen (N-NO2, N-NO3, and total N) demonstrated decreased concentrations toward the bottom of reservoir. Similarly, all showed significant diurnal differences on every sampling day, with increased values during the night due to absence of photosynthetic assimilation during that period. In the sampling days, these forms decreased on the spring sampling day due to the bloom of Microcystis registered
during this period of the year. All three forms of phosphorus (SRP, particulate P, and total P) showed significant vertical variation, except on the fall sampling day. On the summer sampling day there was an increase of both total P and particulate P, the latter because it constitutes more than 70% of the total P during all sampling days. Hourly phosphorus variation was significant during all sampling days, except for the summer one. The SRS vertical variation was significant during all sampling days, except for that in the spring. It was also different hourly on sampling days.
Key words: tropical shallow urban reservoir, nitrogen and phosphorus inorganic forms, soluble
re-active silica, phytoplankton ecology, Brazil.
RESUMO
Dinâmica nictemeral e espacial (vertical) de nutrientes (N, P, Si) em quatro dias de amostragem (verão, outono, inverno e primavera) em um reservatório
tropical raso e sua relação com a comunidade fitoplanctônica
Variações vertical, nictemeral e entre os dias de amostragem das formas de nitrogênio, fósforo e sílica solúvel reativa (SRS) foram estudadas no lago das Garças, reservatório tropical raso situado na cida-de cida-de São Paulo, sucida-deste do Brasil. Excetuado o N-NH4, todas as demais formas inorgânicas de nitrogênio (N-NO2, N-NO3 e N total) diminuíram de teor no sentido do fundo do reservatório. Da mesma maneira, todas as formas de nitrogênio apresentaram diferenças significativas quanto às horas de amostragem, aumentando seus valores durante a noite, em razão da ausência de fotossíntese nesse período. Essas formas diminuíram seus teores no dia de amostragem da primavera, graças à floração de Microcystis
creasing ones of CO2 are quite common during the day in eutrophic waters.
The present research is part of a much larger project being carried out at the Aquatic Ecology Laboratory of the Ecology Section of the Institu-to de Botânica, which aims at typifying, moniInstitu-toring, and recovering some water bodies of a biological reserve located in the municipality of São Paulo. This research aimed at explaining and deter-mining the causes of temporal and spatial verti-cal variation in nitrogen and phosphorus forms, and in soluble reactive silica. If the spatial-tem-poral variation of total and inorganic forms of these ions is associated to thermal and biological conditions, then changes in the height of the mixing zone and the dynamics of the phytoplankton community are the determinant factors.
STUDY AREA
Garças reservoir (Fig. 1) is located in the southeast region of the municipality of São Paulo in the Parque Estadual das Fontes do Ipiranga Biological Reserve (23o38’08”S-23°40’18”S and
46o36’48”W-46°38’00”W). During the rainy season,
its maximum depth is 4.6 m, with the surface area being approximately 97,067 m2 (Bicudo et al., 2002).
The regional climate is B3 B’3 r s2 a, a type (according to Thornthwaite & Mather (1955) climate classification system) with a 19oC mean annual
temperature, annual rainfall of 1,400 mm, and predominating SE winds. Remnants of tropical rainforest borders one of the lake margins (Struffaldi-De-Vuono, 1985). The main macrophytes in the lake are floating Eichhornia crassipes (Mort.) Solms and
Pistia sp. The area where the lake is found is of
flu-vial-lacustrine origin, probably from the Pliocene (Ab’Saber, 1956; Almeida, 1974).
e total) apresentaram variação vertical significativa, exceto no dia da amostragem de outono. No dia de amostragem de verão ocorreu aumento dos valores de P total e particulado, sendo que este último constituiu mais de 70% do P total durante todos os dias de amostragem. Considerando as horas, a va-riação dos teores de fósforo foi significativa nos dias das amostragem de primavera, de outono e de inverno. A variação vertical da sílica reativa solúvel foi significativa em todos os dias de amostragem, menos no da primavera. Essa variação também foi diferente entre as horas e os dias de amostragem.
Palavras-chave: reservatório tropical urbano raso, formas inorgânicas de nitrogênio e fósforo, sílica
reativa solúvel, ecologia de fitoplâncton, Brasil.
INTRODUCTION
Surface waters in contact with the atmospheric mixture of gases and water vapor will absorb some of its components. Nitrogen, oxygen, and carbon dioxide are especially important because of their very essential biological roles. Oxygen is one of the most abundant constituents of the atmosphere (about 21% at sea level). Despite CO2 in the air being surpassed some 28 times in abundance by argon, for example, it is at least 15 times more soluble in water than the two most abundant atmospheric gases (N2 and O2) (Wetzel, 1993; Cole, 1983).
Water mixing is very important for CO2 availability to phytoplankton, especially the non-motile forms for which a gradient of the gas is established in their immediate surroundings. The CO2 concentration just outside the cell is consi-derably smaller than that of the gas in a steady state in the water. Rapid water mixing will decrease the gas gradient in the cell vicinity and will allow continuation of the photosynthesis process even if a cell presents low CO2 equilibrium (King, 1970). Also, turbulence carries absorbed O2 to the lower levels of the water column, thus allowing maintenance of a gradient at the system’s surface film so that gas molecules continue to diffuse from the atmosphere. If molecular diffusion alone were responsible for O2 distribution, it would require years for its traces to reach 5 m below the water body surface (Cole, 1983).
de-The soil types are lathosol; all are nutrient poor, strongly acid, with toxic levels of aluminum, and characteristics making phosphorus fixation possible (Comissão de Solos, 1960; Struffaldi-De-Vuono, 1985).
METHODS
Sampling of physical, chemical, and biological variables was performed at a single station at Garças reservoir in 5 distinct depths of the water column (subsurface, 10% Io, 1% Io, 2 m from surface, and bottom) at 4-hour intervals (6, 10, 14, 18, 22, 2, and 6 h) during the summer (March 3-4), fall (June13-14), winter (August 29-30), and spring (November 29-30) of 1994.
Description of methods used to study the water physical and chemical variables and to carry out phytoplankton analyses are found in Ramírez & Bicudo (2002). Here, only methods directly related to this research are briefly mentioned.
Dissolved oxygen concentration was obtained using the Winkler method modified by sodium-azide (Sawyer & McCarthy, 1978); free CO2, HCO3, CO3, and total CO2 were estimated according to Mackereth
et al. (1978); pH values were obtained directly with an Ambriex pH-meter; and total alkalinity was measured by decreasing the pH to 4.35 with H2SO4 0.01 N.
Table 1 refers to methods used here for deter-mining nitrogen and phosphorus forms and silicate. Arithmetical average and median were used as central tendency measurements. Standard deviation was used to calculate the absolute dispersion degree of data, and Pearson’s coefficient of variation (CV) measured relative dispersion.
Degree of significance of values (among depths and hourly) was calculated for each sampling day by using ANOVA to block design, considering sampling hours as the blocking variable. Magnitu-de of hourly variations was established by the coefficient of variation. In some instances, data were normalized by elimination of the extreme values (outliers) and/or by using logarithmic transformation (log). Mean comparisons were made possible by using the Tukey Test.
Correlation and simple linear regression analyses were carried out. Pearson’s product-moment index (r) was used providing that all involved variables were standardized. Otherwise, Spearman (rs) range correlation index was used.
RESULTS AND DISCUSSION
Vertical and diurnal variations of ammonium-nitrogen (N-NH4)
Except for that in the fall, all other sampling days presented highly significant vertical N-NH4 variation (Table 2). Combined analysis of Table 2 and Fig. 2 shows two interesting facts: (1) a signi-ficant increase of N-NH4 concentration with depth for all sampling days and (2) an N-NH4 concentration decrease from summer to spring.
Increase of N-NH4 with depth was mainly due to respiration and organic matter breakdown, with subsequent dissolved oxygen and pH decrease (Ramírez, 1996). According to Esteves (1998), all these processes make ammonification easier by aerobic and anaerobic breakdown of the nitrogen in organic dissolved material and particles.
In the fall ammonification rate decreased, showing a different pattern from that detected in all other sampling days due to the higher oxygen concen-tration with depth. This was because of lesser duration of thermal stratification as well as greater mixing depths on that sampling day (Ramírez & Bicudo, 2002).
The highest N-NH4 concentrations measured during the summer sampling day (mean concentration = 1651.68 µg.L–1) were most probably due to
contami-nation of samples during the analyses. But even so, on that sampling day concentrations might really have been high. Values obtained were possibly due to an ammonifying bacteria increase in the water (Rugani, 1980) together with presence of sestonic material, which registered the highest concentration on that day: 42.5 mg.L–1, and which represented an excellent
substrate for such bacteria. Another possible explanation for the high N-NH4 concentrations during the summer is the increase of this ion usually after the end of the Microcystis bloom and the start of the circulation period (Reynolds, 1984). Both of these events occurred at Garças reservoir, i.e., on the spring sampling day there was a bloom of Microcystis
increase. This organism absorbed inorganic nitrogen forms (mainly N-NH4 and N-NO3), diminishing N-NO3 concentration to practically zero in the water at that time (spring mean value = 0.0 µgN-NO3.L–1). Microcystis also decreased nitrite (spring mean value =
0.49 µgN-NO2.L–1) and ammonium (spring mean value =
150.9 µgN-NH4.L–1) concentrations. Quick ammonium
incorporation by the blue-green alga occurred because of its need for a nitrogen supply to produce new cells and colonies, and ammonium constitutes a better energetic source because it does not have to be internally reduced as would nitrate (Brezonick, 1972; Conway, 1977; Wetzel, 1993; González, 1988; Blomqvistet al., 1994). Furthermore, as the nitrate sources decreased to very near zero, the most available nitrogen source was ammonium, which was consumed in supporting theMicrocystis bloom.
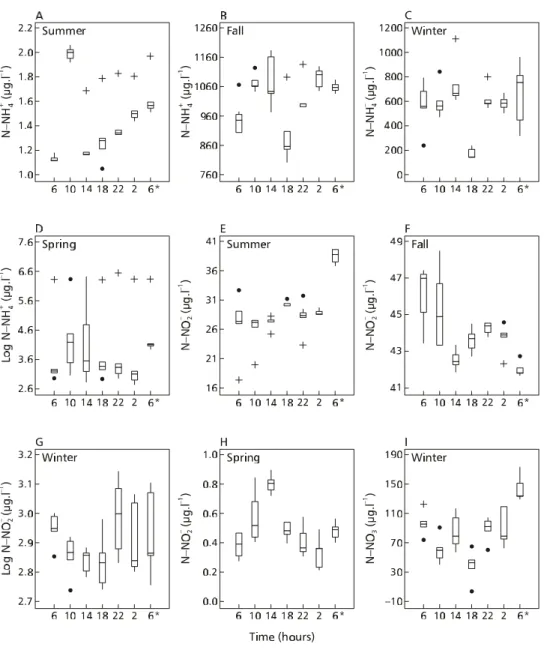
Diurnal N-NH4 variation was significant during all sampling days (summer F = 126.70, α = 0.0000;
fall F = 3.81, α = 0.0082; winter F = 12.98, α =
0.0000; spring F = 3.62, α = 0.0107). The N-NH4
concentration tended to increase during the night period because of the absence of photosynthetic assimilation (Carmouze, 1994) (Fig. 3A-D).
Vertical and diurnal variations of nitrite-nitrogen (N-NO2), nitrate-nitrogen (N-NO3), and total nitrogen (TN)
Looking at the values for N-NO2 in Table 3 one can say that differences found in the first three sampling days (fall, winter, and summer), although statistically significant, are not as evident as those in Fig. 2. The latter figure also shows that the mean values are very similar to each other. It is also apparent that the values of this ion decreased slightly towards the reservoir bottom, possibly due to: (1) bacterial reduction (denitrification) of nitrite to oxidize organic matter (Wetzel, 1993), or (2) reduction of nitrites to ammonium by facultative anaerobic bacteria (Esteves, 1998).
Highest N-NO2 concentrations in the water column during the fall sampling day (mean value = 43.49 µgN-NO2.L–1) were probably due to a decrease
in ammonification rates at that time because of the relatively high oxygen concentration. This would be conducive to higher N-NO2 values. Lowest N-NO2 concentrations were registered on the winter (mean value = 18.32 µgN-NO2.L–1, Fig. 1) and spring
sampling days (mean value = 0.49 µgN-NO2.L–1)
when thermal stratification was steady at all sampling
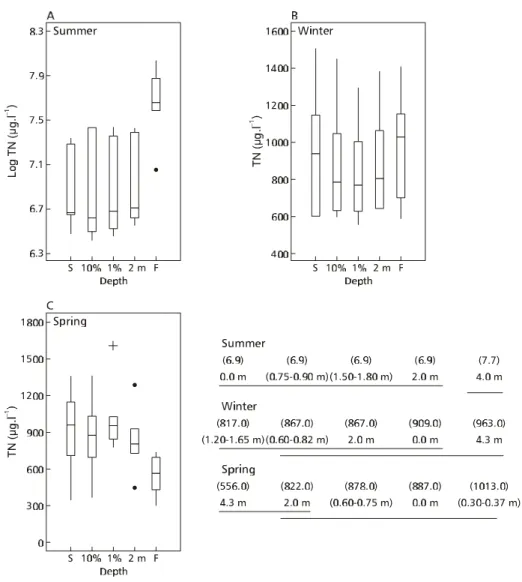
times (Ramírez & Bicudo, 2002). For N-NO3, significant variations with depth were observed during the summer and winter sampling days. Concentrations of this ion were considered homogeneous in the water column on the other two sampling days (Table 3). Higher values of N-NO3 on the winter sampling day (dry time, Fig. 2) could be due to either increasing ion concentration in the water caused by decreasing dilution resulting from diminished rainfall, or decreasing temperature, which influences ammonification and denitrification rates of speed. Increased N-NO3 concentration with depth on the summer sampling day (Fig. 2) has no logical explanation, especially in the presence of inverted thermoclines, lower oxygen concentrations, and high temperatures, which were registered during the greater part of that day (Ramírez & Bicudo, 2002). Total nitrogen showed its main vertical va-riation during the summer sampling day. By con-trast, on the winter sampling day the variation was little (Fig. 4). During both the summer and winter sampling days, highest total N concentrations were detected towards the bottom of reservoir, which was related to the N-NH4 increase at that same depth and to precipitation of particulate organic material. Conversely, on the spring sampling day total N concentration decreased towards the reservoir bottom, although that of N-NH4 increased (Fig. 2). This behavior could be explained by the decreased precipitation of particulate organic material represented mainly by Microcystis that
are prevented from easily sinking because of their aerotopes. On the fall sampling day, vertical variation was not found significant (Table 3), possibly because of the water column mixing, which was greater than it had been on the other sampling days (Ramírez & Bicudo, 2002) and so reduced possible differences.
Variable Unit Method
N-NH4 µ g.L–1 Indophenol Blue
N-NO2 µ g.L–1 Cd-Cu column
N-NO3 µ g.L–1 Cd-Cu column
Total N µ g.L–1 Cd-Cu column
PO4(= SRP) µ g.L–1 Ascorbic acid
Total dissolved P (= TDP) µ g.L–1 Ascorbic acid
Particulate P (= PP) µ g.L–1 Total P – TDP
Total P µ g.L–1 Ascorbic acid
Si(OH)4 (= SRS) mg.L–1 Goltermanet al. (1978)
Variable Statistic Summer Fall Winter Spring
F 73.80 1.08 7.85 91.4
N-NH4
á 0.0000 0.3889 0.0003 0.00000 TABLE 1
Methods and units used to evaluate measured forms of N, P, and Si at Garças reservoir.
TABLE 2
Results of ANOVA performed to establish the significance of vertical variation of NH4-N on each sampling day at Garças reservoir.
Variable Statistic Summer Fall W inter Spring
F 3.60 2.90 12.40 0.39
N-NO2
á 0.0188 0.0426 0.0000 0.8108
F 5.07 0.69 11.30 Constant
N-NO3
á 0.0042 0.6083 0.0000 Constant
F 71.13 0.98 3.55 5.50
Total N
á 0.0000 0.4364 0.0207 0.0027
TABLE 3
Results of ANOVA performed to establish the significance of vertical variation of N-NO3, N-NO2,
and total N on each sampling day at Garças reservoir.
Fig. 3 — Box Whisker plots for significant diurnal variations of ammonium-nitrogen, nitrite-nitrogen, and nitrate-nitrogen in Garças reservoir (6* means the end of diurnal sampling).
Variation among sampling days for inorganic forms of nitrogen and total N
Considering the four sampling days (Fig. 6), different nitrogen forms showed marked decreases on the spring sampling day, most possibly related to the Microcystis bloom occurring at that time. The N-NO3 concentration decrease nearing zero during
Variable Statistic Summer Fall W inter Spring
F 17.48 9.03 4.51 11.56
N-NO2
á 0.0000 0.0000 0.0034 0.0000
F 2.71 1.36 32.21 (*)
N-NO3
á 0.0371(**) 0.2675 0.0000 (*)
F 66.40 74.18 67.76 5.78
Total-N
á 0.0000 0.0000 0.0000 0.0000
(*) Constant (values of 0.0 N-NO3. L–1) during all diurnal sampling time.
(**) This probabilistic value was not considered significant by Tukey test.
TABLE 4
Results of ANOVA performed to establish the significance of diurnal variation of N-NO3, N-NO2, and total N on each
sampling day at Garças reservoir.
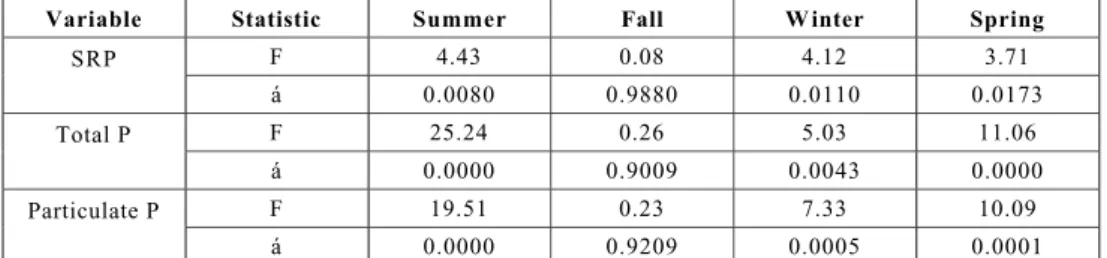
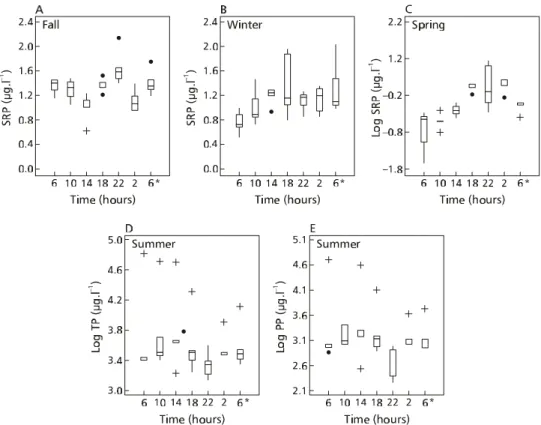
Vertical and diurnal variations of soluble reactive P (SRP), particulate P (PP), and total P (TP)
All three phosphorus forms showed significant vertical variation in three out of the four sampling days (Table 5). Absence of significant variation on the fall sampling day was due to the greater mixing depth of the water column, which brought about a low rate of dissipative energy (Ramírez & Bicudo, 2002).
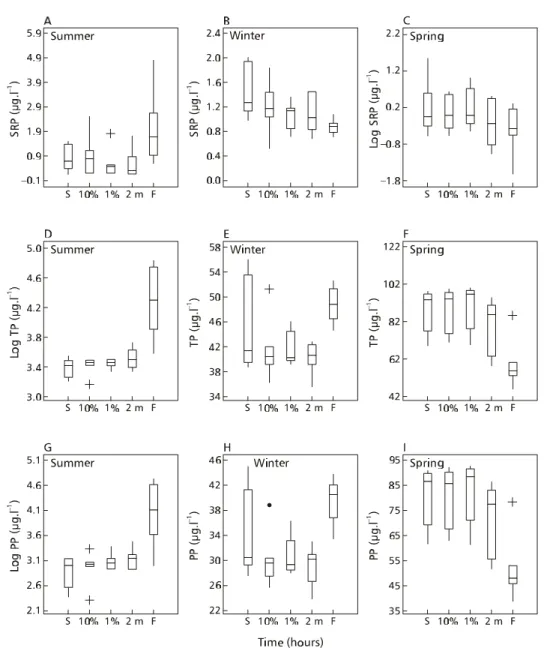
Up to 2 m deep the SRP concentration on the summer sampling day was low. It was also lower than those registered at the same depth for the winter and spring sampling days (Fig. 7A-C). This lower concen-tration on the summer sampling day could be
ex-plained by what Ruttner (1959) called “short circuit circulation” caused by high temperatures registered at that time of year, which would accelerate liberation of a great amount of phosphorus from detritus while still in the epilimnion. Increasing of this phosphorus form towards the reservoir bottom on that same day was related to the presence of clinograde oxygen profiles (Esteves, 1998; Wetzel, 1993) and to the inverted thermal profiles detected during most of the sampling period (Ramírez & Bicudo, 2002). On that day, due to anaerobiosis the bottom was completely reduced, allowing phosphorus liberation to the water column, thus increasing P concentrations in the water.
The SRP decrease towards the reservoir bottom on the winter and spring sampling days (Fig. 7B-C) has no logical explanation because during those two days thermal stability lasted longer, producing clinograde curves of oxygen, which should have resulted in an ion increase towards the bottom of the system. Regarding this, Wetzel (1993) noted two important facts: (1) SRP concentration increase occurs specially close to the sediment and in the final stages of thermal stratification (due to the long sampling interval, perhaps this stage was not included), and (2) increase of the phosphorus liberation rate from the sediment is duplicated when the latter is disturbed by turbulence, which did not happen during the winter and spring sampling days because of the relatively reduced height of the mixing zone (Ramírez & Bicudo, 2002).
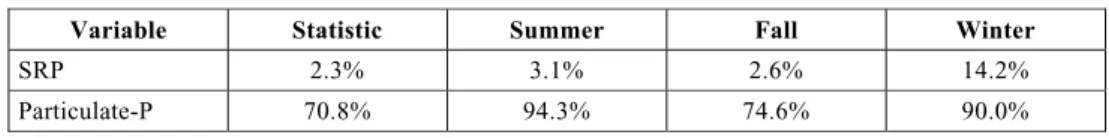
Vertical variation of total P was significant and much more evident during the summer, winter, and spring sampling days (Fig. 7D-F). But on the fall one, that variation was not significant (Table 5). Particulate P (Fig. 7G-I) showed the same tendency as did to-tal P in the system, because in all instances this phosphorus form represented more than 70% of total P (Table 6). Increases of total P and particulate P with depth on the summer and winter sampling days (Figs. 7D-E, 7G-H) could be explained by the same reasons presented for SRP, as well as by sedimentation of algal particles and fecal material of animal origin (mainly zooplankton and fish) that contribute to the sedimentary phosphorus flow.
On the spring sampling day (Figs. 7C, 7F, 7I), the mixing depth and the increase in temperature and of the Microcystis population, with consequent
nume-rical density diminution of the other algal groups, were responsible for phosphorus behavior during this portion of the year. First, Microcystis density increase caused particulate P concentration increase. That these organisms have aerotopes enhancing their floatability could well be the main factor in the total sestonic P decrease in the bottom of reservoir on that sampling day (Figs. 7F, 7I). The same Fig. 7C also shows that SRP decreased towards the reservoir bottom, probably due to a sestonic P decrease, which caused low substrate availability for decomposition.
Diurnal SRP variation was not considered significant on the summer sampling day (F = 1.85,
α = 0.1319). On all other sampling days, however,
it was significant (fall F = 4.72, α = 0.0026; winter
F = 2.97, α = 0.0259; spring F = 12.78, α =
0.0000). It was lesser on the fall and winter sampling days (Fig. 8A-B) and greater on the spring one (Fig. 7C) (average CV: fall = 19.5, winter = 24.2, spring = 46.9). According to Morris (1980) and Wetzel (1993), daily SRP changes include nocturnal increases and diurnal decreases as happened on the spring sampling day (Fig. 8C). The same tendency was not so evident for total P (Fig. 8D) and particulate P (Fig. 8E) during the summer sampling day, as shown by Fig. 8C. It is important to note that Eppley et al. (1973) did not observe changes in the diurnal nutrient behavior.
Variation of soluble reactive P (SRP), particulate P (PP), and total P (TP) among sampling days
Among sampling days, logarithm of SRP (F = 11.39,α = 0.0000), particulate P (F = 272.14, α =
0.0000), and total P (F = 138.2, α = 0.0000) presented
highly significant variation. Mean comparison for SRP (Fig. 9A) showed that the summer sampling day was different from all the others because it yielded the smallest P concentration. These small concentrations of phosphorus were due to its incorporation by algal biomass and to the high rainfall values registered during the sampling day and the preceding months (Ramírez & Bicudo, 2002). The mean concentration value for total P measured on the spring sampling days was different from the average one obtained for all other sampling days (Fig. 9B). With respect to particulate P, every sampling day was considered individually (Fig. 9C). The results are, as has already been said, connected to the enormous increase of Mycrocystis cells measured
on the spring sampling day.
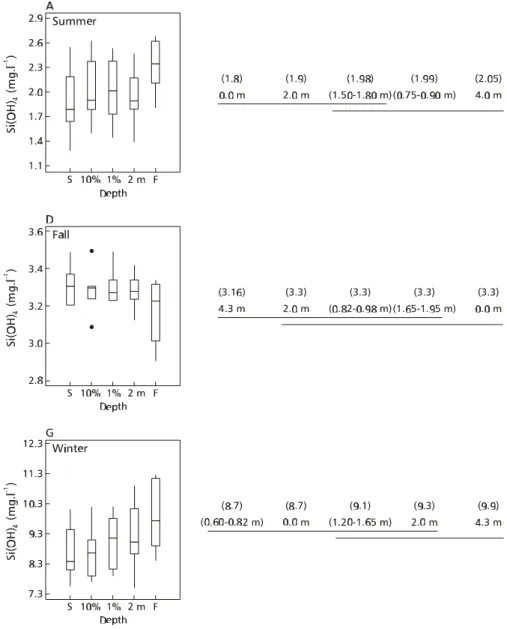
Vertical and diurnal variations of soluble reactive Si (SRS)
According to Reynolds (1984), depoly-merization of colloidal silicate leads to formation of a soluble monomer, the orthosilicic acid (Si(OH)4), which is also referred as soluble reactive silica (SRS) and is the only available form of silica for diatoms, chrysophytes, and heliozoarians.
With the exception of the spring sampling day (F = 1.50, α = 0.2364), vertical SRS variation was
significant (summer: F = 4.69, α = 0.0061, fall: F =
3.07,α = 0.0357; winter: F = 4.58, α = 0.0068). Figs.
TABLE 5
Results of ANOVA performed to establish the vertical variation of the different forms of phosphorus evaluated on each sampling day at Garças reservoir.
Variable Statistic Summer Fall W inter Spring
F 4.43 0.08 4.12 3.71
SRP
á 0.0080 0.9880 0.0110 0.0173
F 25.24 0.26 5.03 11.06
Total P
á 0.0000 0.9009 0.0043 0.0000
F 19.51 0.23 7.33 10.09
Particulate P
á 0.0000 0.9209 0.0005 0.0001
Fig. 7 –— Box Whisker plots for significant vertical variations of soluble reactive P, total P, and particulate P in Garças reservoir.
Although ANOVA considered different SRS mean values with depth on the summer and fall sampling days, these differences were too small to be considered biologically distinct, which can be proved by looking at the very small variance values (summer = 0.21; fall = 0.02) for the sediment. The very slight vertical differences observed during the latter two sampling days can be explained by the mixing-depth increase. According to Esteves (1998), in the tropical zone SRS distribution is associated
with stratification and destratification periods and not with the climatic seasons.
as happened during the winter sampling day (Fig. 10C). According to Morris (1980), the major part of silica recycling occurs at the reservoir bottom. Nevertheless, this element is believed to be associated with a short recycling time, as phosphorus or the reduced nitrogen can be detected during the period of high resolubilization of diatom frustules, which occurs within the photic or the mixing zone.
On the spring sampling day, despite a longer stratification period (Ramírez & Bicudo, 2002) SRS concentrations were small, almost homogeneous (mean value = 2.39 mgSRS.L–1), and not significant.
Because of this, diatom density decreased considerably (9,704 ind.L–1) when compared to densities calculated
for the other sampling days (Table 7).
Correlation analysis between SRS concentration and numerical density of diatoms for every sampling day showed positive associations for the summer (rs= 0.39, α = 0.00238; n = 35) and spring
sampling days (rs= 0.0, α = 0.2359; n = 35), which
is puzzling because association between these two variables is usually negative. The same tendency
was also detected on the fall (rs= 0.17,α = 0.3065;
n = 35) and winter sampling days (rs= 0.24, α =
0.1654; n = 35), but the association values were not significant. This tendency was due to the diatoms’ use of SRS in building their shells, since the relative density of these organisms increased during those sampling days (Table 7). However, due to laboratory problems with the blanks, SRS concentrations on the winter sampling day were very high (mean value = 9.16 mg.L–1, Fig. 10C).
Esteves (1998) believes that in tropical soils aluminum silicates are abundant and, consequently, may be present in high amounts in the water, especially during the period with less rainfall (winter) in which the dilution factor is small.
Diurnal SRS variation was considered significant on all sampling days (summer: F = 11.39,
α = 0.0000; fall: F = 4.90, α = 0.0021; winter: F =
7.43,α = 0.0001; spring: F = 253.62, α = 0.0000).
However, looking at Fig. 11B-E one can conclude that this variation was slight as demonstrated by the mean values in the Tukey test.
TABLE 6
Percentage of Soluble Reactive-P, and Particulate-P in relation to Total-P on each sampling day at Garças reservoir.
Variable Statistic Summer Fall Winter
SRP 2.3% 3.1% 2.6% 14.2%
Particulate-P 70.8% 94.3% 74.6% 90.0%
Such small differences were responsible for the high statistical significance that has no logical explanation, since the diurnal variation of diatoms was not significant during the summer (F = 1.49, α
= 0.2276), winter (F = 0.69, α = 0.6590), and spring
sampling days (F = 1.76, α = 0.1505). In all three
instances, differences observed had no relation with diurnal SRS variations. According to Steinberg & Meltzer (1982), SRS absorption is greater in the dark-ness. This tendency was observed only on the summer
and winter sampling days when diatom density increased during the dark hours and presented highly significant diurnal variation (F = 13.66, α = 0.000).
On the sampling days, variation was considered highly significant (F = 1413.01, α = 0.0000) and
the means calculated for the four sampling days were considered different from each other (Figs. 11A, 11F). The winter sampling day showed the greatest difference due to high concentration at each level of the water column (Fig. 10C).
TABLE 7
Mean values of variables related to SRP on each sampling day at Garças reservoir.
Variable Summer Fall W inter Spring
SRP (µg P-PO4.L–1) 0.98 1.30 1.14 1.18
Particulate-P (µg.L–1) 29.84 39.91 32.45 73.49
Cyanophyceae (ind.L–1) 98.035 230.139 206.487 433.515
Chlorophyceae (ind.L–1) 88.002 527.695 268.005 47.603
Cryptophyceae (ind.L–1) 70.409 190.964 86.578 10.405
Bacillariophyceae (ind.L–1) 53.415 114.568 101.718 9.704
Acknowledgements— The senior author is grateful for partial financial support from Rede Latinoamericana de Botánica; and to the Biology Department of the University of Antioquia. The junior author is thankful to CNPq, Conselho Nacional de Desen-volvimento Científico e Tecnológico (CEMB, grant n. 304643/ 90-4), for financial aid.
REFERENCES
AB’SABER, A., 1956, A terra paulista. Boletim Paulista de Geogr.,23: 5-38.
ALMEIDA, F. F. M., 1974, Fundamentos geológicos do relevo paulista.Inst. Geogr. Univ. S. Paulo: sér. Teses Monogr.14: 5-99.
BICUDO, C. E. M., CARMO, C. F., BICUDO, D. C., HENRY, R., PIÃO, A. C. S., SANTOS, C. M. & LOPES, M. R. M., 2002, Morfologia e morfometria de três reservatórios do PEFI.In: D. C. Bicudo, M. C. Forti & C. E. M. Bicudo (orgs.),Parque estadual das fontes do Ipiranga (PEFI): unidade de conservação ameaçada pela urbanização de São Paulo. Secretaria do Meio Ambiente do Estado de São Paulo, São Paulo, pp. 143-160.
BLOMQVIST, P., PETERSON, A. & HYENSTRAND, P., 1994, Ammonium-Nitrogen: a key regulatory factor causing dominance of non-Nitrogen-fixing Cyanobacteria in aquatic ecosystems.Arch. Hydrobiol.,132: 141-164.
BREZONICK, P. L., 1972, Nitrogen: sources and transformations in natural waters. In: I. Morris (ed.), The physiological ecology of phytoplankton. Blackwell Scientific Publications,
London, 625p.
CARMOUZE, J. P., 1994, O metabolismo dos ecossistemas aquáticos: fundamentos teóricos, métodos de estudo e análises químicas. Editora Edgar Blücher Ltda/Fundação de Amparo à Pesquisa do Estado de São Paulo, São Paulo, 253p. COLE, G. A., 1983, Textbok of Limnology. 3. ed. The C.V.
Mosby Company, Toronto, 426p.
COMISSÃO DE SOLOS, 1960, Levantamento de reconhecimento dos solos do estado de São Paulo.Boletim Serv. Nac. Pesq. Agron.,12: 1-634.
CONWAY, H. L., 1977, Interactions of organic Nitrogen in the uptake and assimilation by marine phytoplankton. Mar. Biol., 39: 221-232.
EPPLEY, R. W., RENGER, E. H., VENRICK, E. L. & MULLIN, M. M., 1973, A study of phytoplankton dynamics and nutrient cycling in the central gyre of the North Pacific Ocean.Limnol. Oceanogr.,18: 534-551.
ESTEVES, F. A., 1998, Fundamentos de Limnologia. 2. ed. Editora Interciência, Rio de Janeiro, 602p.
GOLTERMAN, H. L., CLYMO, R. S. & OHMSTAD, M. A. M., 1978, Methods for chemical analyses of freshwaters. 2. ed. Blackwell Scientific Publications, Oxford and Edinburgh, 213p
GONZÁLEZ, A., 1988, El plancton de las aguas continentales.
Secretaría General de la Organización de los Estados Americanos, Washington, 125p.
KING, D., 1970, The role of carbon in eutrophication. Journ. W. P. C. F.,42: 2035-2051.
MACKERETH, J. J. H., HERON, J. & TALLING, J. F., 1978,
Water analysis: some revised methods for limnologists. Titus Wilson & Son Ltd. (Freshwater Biological Association, Scientific Publication no 36), England, 117p.
MORRIS, I. (ed.), 1980, The physiological ecology of phytoplankton. Blackwell Scientific Publications, London, 625p.
NOGUEIRA, N. M. C., 1997,Dinâmica populacional de
Microcystis aeruginosa Kützing (Cyanophyta/Cyanobacteria) ao longo de um ano no Lago das Garças, São Paulo, SP, Brasil. Master Thesis, Universidade Estadual Paulista, Rio Claro, 109p.
RAMÍREZ, J. J., 1996, Variações espacial vertical e diurnal da estrutura da comunidade fitoplanctônica e variáveis ambientais em quatro dias de amostragem de diferentes épocas do ano no Lago das Garças, São Paulo, SP, Brasil. Doctoral Disssertation, Universidade de São Paulo, São Paulo, 284p.
RAMÍREZ, J. J. & BICUDO, C. E. M., 2002, Variation of climatic and physical co-determinants of phytoplankton community in four nictemeral sampling days in a shallow tropical reservoir, southeastern Brazil. Braz. J. Biol.,62(1): 1-14.
REYNOLDS, C. S., 1984, The Ecology of freshwater phytoplankton. Cambridge University Press, Cambridge, 384p.
RUGANI, C. A., 1980,Bactérias amonificantes e fatores ecológicos nos lagos Carioca e Dom Helvécio (Vale do Rio Doce, MG). Master Thesis, Universidade Federal de São Carlos, São Carlos, 117p.
RUTTNER, F., 1959, Fundamentals of limnology. 3. ed. Oxford University Press, London, 307p.
SAWYER, C. N. & McCARTHY, P. L. M., 1978, Chemistry for environmental engineers. 3. ed. McGraw Hill Book Company, New York, 345p.
STEINBERG, C. & MELTZER, A., 1982, Stoffkrasläufe in Binnengewassern.Bayer. Land. Wasserw.,2: 82-134. STRUFFALDI-De-VUONO, Y., 1985.Fitossociologia do estrato
arbóreo da floresta da Reserva Biológica do Instituto de Botânica (São Paulo, SP). Doctoral Dissertation,
Universidade de São Paulo, São Paulo, 210p.
THORNTHWAITE, C. W. & MATHER, J. R., 1955, The water balance.Publications in Climatology,8(1): 1-104. WETZEL, R. G., 1993, Limnologia. Fundação Calouste