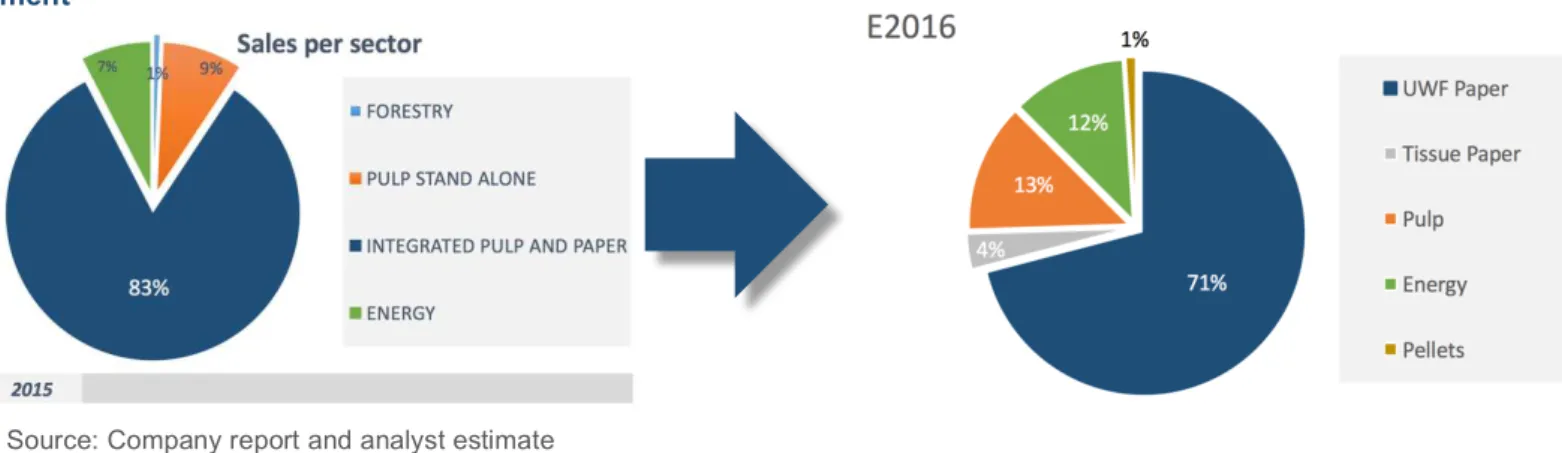
§ Although printing and writing have been affected by digitalization, and graphic paper grades have been unbalanced in the latest years, the pulp and paper Industry has room to offer high potential markets, with opportunities rising mainly in emerging regions. The Navigator Company strategic shift towards Tissue seems a positive move that may hedge against UWF market deteriorated conditions. The growth strategy is expected to boost sales in the longer term, while benefiting from both, installed industry facilities already in place and vertical integration leverage which may lead to price competitiveness.
§ Navigator’s stock price has been flat to decline with increased volatility in the latest periods. No evidence has been found from its fundamentals to justify the stock behaviour. Main reasons could be related with external factors such as market behaviour by itself as well as paper prices and the continued downward trend in demand for the UWF paper.
§ With a strong balance sheet, consistent operating margins and an appeling dividend yield the Company seems to offer a fair investment, with chances to provide positive return from market reversion and adjustment to the recent loss. Nevertheless, our belief is that long term growth will be highly dependent on its capacity to move into more profitable markets, while extracting in a cash cow fashion the added value UWF’s market still has to offer.
Company description
The Navigator Co. SA is a Pulp and Paper Portuguese company. It was re-privatized by the mid 90’s being currently owned by Semapa (holding 69.35% of share capital). Besides producing pulp and paper, the group also has activities in forestry and energy. With this vertical integration strategy Navigator has been benefiting from operational synergies and reduced production costs. Recently with the intention to diversify its current business activities and hedge against graphic paper decline, Navigator entered into Tissue and Pellets business’s.
T
HE
N
AVIGATOR
C
OMPANY
C
OMPANY
R
EPORT
P
APER AND
P
ULP
1
STD
ECEMBER2016
S
TUDENT
:
T
OMÁS
F
RANCO
[email protected]
Expanding within the Industry
Diversifying in times of market deterioration
Recommendation: BUY
Price Target FY2017: 4.40 €
Price (as of 01-Dec-2016) 2.98 €
Reuters: NVGR.LS, Bloomberg: NVP PL
52-week range (€) 2.42-3.43
Market Cap (€m) 2 083
Outstanding Shares (m) 717.5
Average Volume (m) 4.114
Source: Bloomberg
Source: Bloomberg
(Values in (m) EUR) 2015 2016E 2017F
Revenues 1628 1641 1696
EBITDA 405 389 400
Net Profit 196 185 193
EPS (in EUR) 0.274 0.257 0.269
P/E 12.5 11.3 16.3
Market Cap 2830 2083 3155
Net Debt 727 786 789
ROE 16.2% 17.3% 17.9%
ROIC 11.5% 10.3% 10.7%
NOPAT 237 211 219
Net Debt/EBITDA 1.62 2.02 1.97
Table of Contents
COMPANY OVERVIEW ... 3
STOCK PERFORMANCE ... 4
CAPITAL STRUCTURE AND DIVIDENDS POLICY ... 6
FINANCIALS ... 7
STRATEGY ... 8
⋅
PELLETS ... 8
⋅
MOZAMBIQUE ... 8
⋅
TISSUE ... 9
THE PAPER AND PULP INDUSTRY ... 10
IMPORTS/EXPORTS ... 11
GRAPHIC PAPER SHIFT TO OTHER GRADES ... 12
CONSOLIDATION ... 12
TISSUE AND PACKAGING ... 13
MARKET PULP (BHKP) ... 14
VALUATION ... 16
DCF ... 16
MULTIPLES VALUATION ... 19
SENSITIVITY ANALYSIS ... 20
SCENARIO ANALYSIS ... 21
APPENDIX ... 23
FINANCIAL STATEMENTS ... 24
RESEARCH RECOMMENDATIONS ... 25
Company Overview
The Navigator Company S.A. (ex-Portucel S.A.), is a Portuguese Company with its core business’s in the Paper and Pulp Industry. The company manages and operates pulp & paper mills and forests to produce uncoated wood free paper (office paper), a subcategory of the printing and writing paper, selling it worldwide. It is a Mid Cap company comparing with the European Industry (for instance, the Northern European company Stora Enso has a year turnover of 10bn EUR), but a leader in the European UWF paper market, and certainly a large company in the country, with a turnover of 1.6bn EUR and a market capitalization of 2.1bn EUR, the company produces near 1% of the country’s GDP.
Headquartered in Setúbal, Portugal, The Navigator Company has its origins from the mid-twenty century. It was a state owned company between 1976 and 1995, becoming completely privatized in 2006, a process that took three phases and was accomplished with a final Semapa’s purchase of the remaining 30% share capital held by the Portuguese state. The company has 717.5m total shares, from which 30.57% are free float. Semapa, the Navigator’s holding company holds 69.35% of the share capital (Figure 1). Banco BPI, Norges Bank and Zoom Lux are the three left owners with significant positions, each holding 4.24%, 2.15% and 2.14% share capital.
Navigator has a vertical strategy, integrating the pulp in the production of paper and managing 120 thousand ha of forest, which are far from being enough to supply its required quantity for the pulp production, forcing it to import wood in order to fulfil the lack of national resources1. The required wood for the production is mainly acquired in Iberian markets.
1 The group supplies, from its forestry activities, less than 20% of total fibres required for its pulp and paper production. Information
provided from Moody’s report. The company reported that 75% of total supplied wood is provided from Portugal, 11% from Spain and 14% from outside the Iberian Peninsula.
Figure 1. Holding Structure
Source: Semapa report
Figure 2. Navigator’s CFO
Source: Company report
Figure 3. Revenues per segment
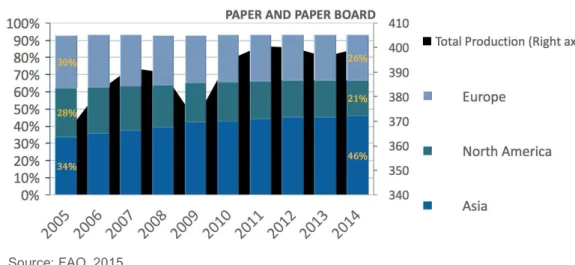
The group has a yearly capacity to produce 1.6 tonnes of paper and 1.5 million tons of pulp2, of which 300 thousand are market pulp3. It is also the largest biomass power producer in Portugal with 2.5TWh of generation capacity, yielding 5% of the energy produced in the country. The company has been growing in the midst of a market consecutively suffering from a shrinking demand and prices drop, revealing its resilience and capacity to generate a consistent stream of positive cash flows in face of an increasing challenging market. Navigator’s share capacity in Europe has increased by more than 5% with its 2010 new growth cycle launched through the opening of the new paper mill in Setubal (Figure 4 presents the FAO source), an effort that headed the company to the leading position4 in the UWF sub-sector. By November, Navigator was recognized by Opticom as the most valuable office paper Brand in Europe. Nevertheless, the matured secular graphic paper sub- sector has been declining for a long time, facing excess supply and declining demand, conditions that are not shared throughout the entire Industry.
Stock Performance
The Navigator is listed in the Euronext Lisbon Stock Exchange since October 27th 2003, and it is part of the Portuguese Index PSI20, weighting 5.06% in it. It trades under the ticker NVG which it will occasionally be used in this report as an abbreviation for the company’s name.
After the sharp rise in the beginning of 2015 which we believe it was caused mainly by the increase in paper prices, the stock has been guided by a persistent volatility with a slightly downward slope. During the last twelve months, from December 1st 2015 to December 1st 2016, NVG stock prices had an average annualized daily adjusted return of -5,56% and a total loss of -12.15%, underperforming MSCI World EUR Index5 which had an average daily annualized return of 1.68% and a
2
The company produces UWF paper grade (Uncoated bleached wood free) and BHKP – Bleached hardwood Kraft pulp
3 Pulp that is not integrated but directly sold to the market 4
Ranked by capacity/segment revenues
5
Index used in the valuation to estimate expected market excess return
Figure 4. NVG Share capacity in Europe
Source: FAO
Figure 5. Navigator stock vs selected Indexes
Source: Bloomberg
Table 1. Navigator vs selected Indexes
total return of 0.04%. On the other hand, if comparing with Eurostoxx50 and PSI20, the company over performed both indexes. PSI20 has been performing poorly, with returns below other indexes.
In general, the slow global economy growth has been putting markets on hold, specially in the developed countries. Eurozone financial system has been unstable with increased investors mistrust, regarding political capacity to conciliate economical growth and sustainability6. Particularly in Portugal, high indebtedness and a series of bank collapses have been unveiling fragilities in the country’s financial system, with special emphasis on the BANIF and BES insolvency cases (Pedro Queiroz Pereira, current Navigator’s chairman and ex-administrator of BES, was not entirely dissociated from the case7). Moreover, the poor PSI20 performance over the last years has alerted investors about Portuguese companies expected performance. Along with this increasing volatility, the company’s stock volume has also increased from 1.5m in 2014 to 4.1m in 20168 (Figure 6), an increase that is not followed by neither the industry, nor Portuguese companies in general. This, under ceteris paribus assumption, denotes a positive signal to investors, since it reduces liquidity risk, while increasing fairness in market valuation. Such increase in risk also materializes at a systematic level which we access by looking into delivered beta, a measure that will be described in more detail during the valuation chapter.
Some peers were selected for an industry market return comparison. The following table presents the total and average annualized daily returns:
6 ECB – Financial Stability Review, May 2016 7
Comissão Parlamentar de Inquérito à Gestão do BES e do GES – Relatório Final
8
Annual Daily Average Volume
Figure 6. Navigator daily Volume, annual average, in millions
Source: Bloomberg
Table 2. Navigator vs selected peers stock performance
Source: Bloomberg
Capital Structure and dividends Policy
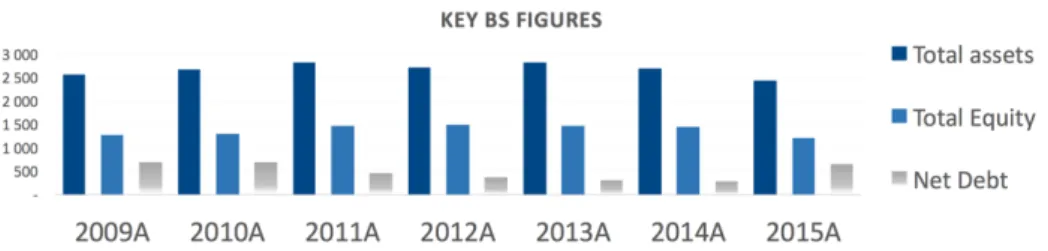
The company’s debt level has been conservative. Navigator’s debt has recently been upgraded by both, Moody’s to Ba2 stable and Standard and Poor’s to BB stable, which translates the strong financial performance perception. The credit rating companies have appreciated the company’s intention to, after a series of increasing dividend payments, turn its efforts towards expansion and diversification of its business activities9.
After initiating the expansion cycle in 2009 that allowed the company to became UWF European leader, the group has been delivering until the latest year in which the new growth cycle was launched. Although net debt increased in a year where the company distributed nearly 440 million in dividends, it decreased its short/long term debt ratio, thus releasing short-term debt pressure, balancing the high amount of “stacked” cash. Furthermore, the company also has conservative values in its short term liquidity: current ratio (current assets to current liabilities) has been near 1.7 in the latest years.
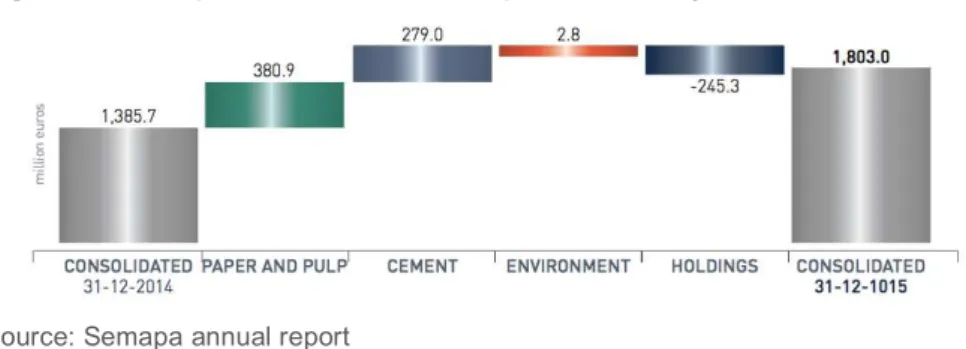
Finally, it is important to notice the debt relation between Navigator and its mother company, Semapa. The company provided 80% of Semapa EBITDA in 2015, but only 36% of Semapa’s debt was generated from Navigator10. The Navigator’s holding operates in the cement industry and has exposure to emerging markets with substantial risk from socio-political instability such as Lebanon, Tunisia, Angola and Brazil. The holding increased its leverage by 2.7 creating within it a disproportional balance. Consequently, this sets pressure on Semapa’s dividend demand. Figure 9 presents the holding’s financial debt structure by subsidiary.
9
Moody’s Report
10
Semapa’s Annual Report
Figure 7. Short vs Long term Debt evolution
Source: Company report
Figure 8. Historical Capital Structure
Financials
The group has been a historical track of consistent operating free cash flow, despite last year significantly felt which was mainly due to capital restructuring and business investment cycle. The company has been disinvesting, meaning that the invested capital in fixed assets has been largely exceeded by depreciation. Given the uncertainty in global economy, and the conditions in the industry, the company halted for the right time to reinvest its capital, beginning in 2015 a new growth cycle. Return on Invested Capital has been increasing, with a ROIC 5Yr average of 10.8%, while ROE slightly more volatile, primarily because of interest and tax expenses variations. EBITDA margin has been always above 20%, and unlevered net income, averaging 14% since 2011. This metrics are above average peers in industry, showing NVG operational advantage.
An interesting decomposition, similar to a DuPont Analysis, is factorizing ROIC, through Sales: ROIC = NOPAT/Sales x Sales/Invested Capital, where NOPAT to sales give us a measure of profit per unit in sales, while Sales to Invested Capital a measure of how efficiently the capital employed is in generating sales. The Following table shows us the historical performance of Navigator in terms of these two metrics.
Figure 9. Semapa Net Debt variation per subsidiary
Source: Semapa annual report
Source: Company Financial Statements/Analyst Estimate
Figure 11. Working Capital Components
Source: Company Financial Statements/Analyst Estimate
Figure 12. Credit Suisse model
Table 3. NOPAT & Invested Capital turnover
Source: Analyst Estimate Figure 10. Free Cash Flow
Components
It is visible the upper trend in the Sales to Investment ratio, suggesting that capital employed is becoming more efficient in generating sales, while NOPAT to Sales ratio, has been more flat to decline despite the last year recover. Following the model credit Suisse suggests to analyse these metrics, we conclude that the main reason for the company’s return on capital growth has been improved production advantage. Furthermore, assuming ROIC remains at these levels, it provides a positive spread within the cost of capital11, meaning that a positive growth will add positive economic value.
Strategy
The company has been recently developing a growth strategy in the following three main strands:
⋅
Pellets
By December 2014, the group informed its intention to advance with the construction of a Pellets factory in South Carolina, U.S. The project seems to make sense, given the intersection of the segment with the current group’s activities, enabling the company to take advantage of its industry knowledge, while entering into the bioenergy sector. Moreover it brings the opportunity to expand into an area where it is already an exporter, creating facilities in terms of storage and hedging its profits against dollar strength’s. The initial capital expenditure for this project was estimated in 116.5m USD. And its capacity is expected to achieve the 500 thousand tons annually. The Factory started to operate in the latest quarter, and it is expected to be operating in full capacity by the beginning of 2017, having the company secured 40% of the sales for a 10 years period.
⋅
Mozambique
The group investment in Mozambique forest has the intention to boost its growth, by expanding a market pulp industrial complex. The project is charged by Portucel Mozambique, which is 80% controlled by the group and 20% by the World Bank that entered with an initial investment of 30m USD. This partnership seems beneficial for the group providing confidence given the credibility, capital and knowledge World Bank can add to the project. Mozambique offers instability at the social and political level and adverse climatic conditions such as floods and droughts which have already jeopardize this endeavour. Considering the premature state of the project, still dependent on several factors and without
11
indication of any specific competitive advantage, the valuation of the project has considered a net present value of zero12.
⋅
Tissue
Navigator recently entered into tissue business through the acquisition of AMS in February 2015, duplicating its production capacity to 60 thousand jumbo reels and 65 thousand converting. The group has shown its intention to expand this capacity in order to achieve 130 thousand tons capacity through a 120m EUR investment between 2016 and 2018 (it was assumed in the projections that the group would integrate its market pulp for the tissue production, therefore having comparative advantage against non-integrated competitors).
12
The Paper and Pulp Industry
The Paper and Pulp Industry has been suffering structural changes since the global financial crisis. Having achieved a total production of 406 million tons of paper and paperboard13 in 2015, the industry is globally growing, sluggish as the overall economy14, but not homogenously in its geographic production and subsector demand. The graph illustrates the turnaround Asia prompted in global production, with China outpacing U.S in production in 2008. Together, U.S and China produced near 40% of the total paper and paperboard sector, with Japan, Germany and South Korea following the lead of largest producers. Europe, Asia and North America have been responsible for nearly 93% of total production. In the black background, it is possible to see the recover from the credit crisis, as well as the slowdown that the industry has been suffering since then, mainly caused by a sharp decrease in graphic paper grades demand and the slowdown in the overall economy15.
Taking a perspective per sub-sector grade, graphic paper has been flat to decline, while packaging and tissue grades have been growing.
The graph on the left (Figure 15) presents the production evolution in the sector, divided into these three different subsectors. Graphic Paper has been falling since 2007, accumulating a total decline of -15% since then. The major responsible for this fall has been Newspaper with a decrease of almost -30%, while Printing and
13 Food and Agriculture Organization (FAO) Survey 14
IMF – World Economic Outlook, October 2016
15
ECE Committee of the Forest Industry
Figure 13. Global Paper Production and sub-grades
Source: RISI 2015, PPPC and NVG
Figure 14. Paper and Paperboard World Production (in m tonnes)
Source: FAO, 2015 Figure 15. Global Paper
Production per sub-grade (in m tonnes)
Writing (P&W), decreased -11%. On the other hand, Packaging and Tissue segments were up in production, each by 25% since 2005, with an average YoY growth of 2.8% from 2010 to 2014 (also each one).
In 2015, production of graphic paper in North America registered a -5.7% YoY variation, and a total decrease of near -90% since 2011, while apparent consumption decreased -3.8% and -15% correspondingly. Newsprint was the most affected grade, opposed to UWF paper which was the least affected among P&W grades, decreasing near -1% in both production and consumption from 2014 to 2015.
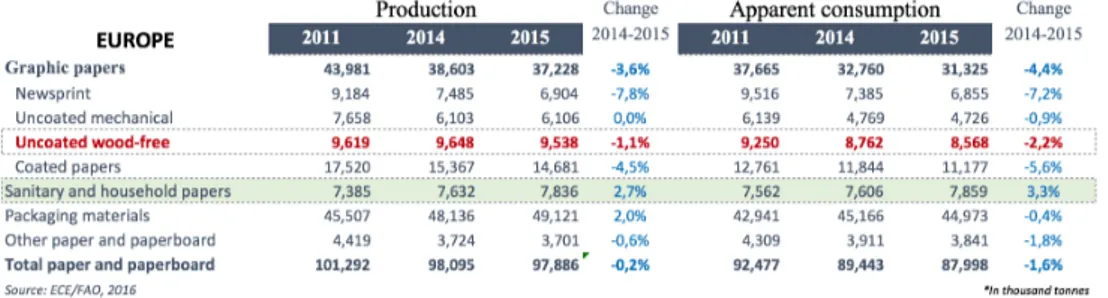
Europe has been no exception for the global declining trend in the graphic paper segment. Apparent consumption in graphic paper had a -4.4% YoY growth in 2015, and -17% since 2011, while production decreased -3.6% and -15% correspondingly. In particular UWF paper had -1.1% and -0.8% in consumption and -2.2% and -7.4% in production (still considering the same periods).
The following table summarizes the European production and apparent consumption by paper grade:
Imports/Exports
Regarding importations and exportations, North America and Europe have been paper & paperboard net exporters, contrasting with Asia which has been a net importer. Nevertheless, overcapacity in Asia caused the differential to narrow significantly in the latest years mostly due to an increase in exportations and a slowdown in importations. On the other hand, US had widened primarily due to a decrease in the imported quantity. Europe in turn, has been quite flat, with both import and export quantities decreasing slowly. Furthermore, China overcapacity, may continue to jeopardize European exports and overall prices. US Anti Dumping
Table 4. Graphic Paper Production and Consumption in Europe
Source: UNCEC Committee for the Forest Industry Figure 17. Global Paper
Import/Exports (in k tonnes)
Source: FAO Data base Figure 17. China vs US Production in m tonnes
policies has been tightening its borders against Asia and Europe16, action that amplifies overproduction impacts.
Graphic Paper Shift to Other Grades
As observed, European graphic paper demand has been declining since the global financial crisis. Seeking for cheaper and more efficient alternatives, final consumers, businesses and even governments have found attractive solutions in digital alternatives. Jeopardized by digitalization, the segment was forced to adjust17. Following this persistent decline in demand, shifts to different paper grades and closure of mills took place. Shifting to alternative and more attractive grades such as tissue and packaging, have been actions that industry players were driven to adopt given the unfavourable conditions18.
The uncoated wood free paper grade has been unbalanced, with supply exceeding demand that kept in decline, leading to a sharp decrease in capacity and expectations are that this downsizing trend will persist19. Particularly in Europe, markets have not balanced yet, however the decline in demand appears to be only in the Western Europe, while Emerging Europe has been almost flat20.
Consolidation
Economies of scale have been dominating paper and pulp markets, while its conditions demand reforms and rationalizations mainly in developed regions such as Europe and North America. Larger producers are continuously gaining market share from smaller and less efficient ones. Consequently, if excess production persist, mills closures and M&A deals are expected to continue occuring13. Europe and North America are advanced in consolidation while Asia registers a significantly more diluted market. Fisher International, a leading consulting firm in the paper and pulp industry, analysed the consolidation status by geography and subsector, applying a four stage model to the industry.
In North America, the UWF paper grade is advanced in consolidation, with top 5 companies controlling 81% of the market and only 13% distributed throughout companies with less than 1% market share. Asia is in an earlier stage of
16
BI Forest & Paper Products, Global Paper and Forest Products Industry Primer
17
ECE Committee for the Forest Industry
18 For instance, Stora Enso shifted to containerboard in 2015 and Metsa-Board to packaging in 2016 19
Bloomberg Intelligence report
20
RISI Economist – Alexandro Mata
Figure 18. Consolidation by geography in the UWF paper grade
consolidation, with top 5 companies sharing only 26% from this segment and the biggest 65% slice distributed within smaller companies.
In Europe, The Navigator Company is leading the market with 15% share, while the top five largest companies dominate 58% of the market. Nevertheless there is a significant percentage of small companies, suggesting that consolidation is expected.
Finally we can observe that, although UWF paper in Europe is expected to keep flat to decline, the industry still allows consolidation. Additionally, considering the week market conditions, beyond M&A deals, shifts and closures may keep contributing for further consolidation.
Nevertheless, even with Europe and North America adjusting capacities in face of the demand decline, Asian overcapacity still threats European exportations and global prices. In left, Figure 19 exhibit the Price Index for UWF paper in EUR/tonne. It is clear in the graphic, apart from the 2015 recover, the downward trend over the last five years.
Tissue and Packaging
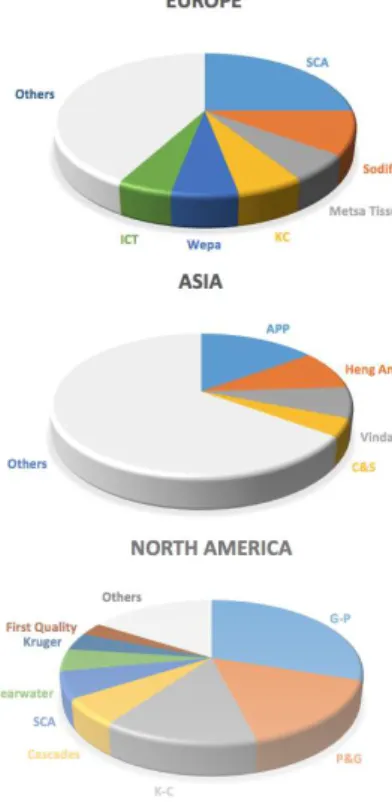
Increased e-commerce in business to consumers is a main factor for growth in packaging demand, while population growth and increasing middle class in emerging markets benefits the tissue market21. As previously mentioned, industry players have gradually been shifting to more attractive paper grades. Conversion to paperboard has slowed in 2015 and 2016 as markets started to become competitive and condensed. This achievement of an advanced consolidation state in the paperboard grade has been capturing industry players attentions to invest in tissue paper and seek for opportunities in emerging and underdeveloped markets.
In fact, by applying once again the stage model to this segment, we notice that Europe is less consolidated than North America, but more than Asia. With 42% of the market being shared by smaller companies (with less than 3%), and with the top three, SCA, Sodifel and Metsã Tissue having 41% of the European market, of which 33% have less than 1% market share.
The sector capacity has been growing fast, at a rate of 4% per year since 2010, with highest average capacities centred in Asia, North America and middle east22.
21
ECE Committee on the Forest Industry seventy fourth session
22
Source: Numera Analytics August 2016 presentation
Figure 20. Consolidation in the Tissue sector by geographic region
Figure 19. FOEXA4BC Price Index (in EUR/ton)
Source: Bloomberg
Latin America is second placed in capacity growth, right after China. Several mills expansions and conversions are foreseen for the period 2016-2018, which are estimated to have impact to bring down capacity utilization rates23.
Market Pulp (BHKP)
In contrast with Paper and Paperboard, we have analysed market pulp as a global market24. Market pulp is sold to papermakers instead of being integrated and represents nearly 30% of all paper consumed25. It is visible in figure X the downwards trend in production from North America while Europe has been flat. Asia alongside with South America have experienced an upper trend.
Globally, demand has been growing over the past five years, averaging a growth rate of 2.5% per year26. Regarding trading developments, Asia has been a net importer, with the differential increasing sharply, mainly due to its sharp growth in paper capacity but with a lack of integrated mills, while South America has been a net exporter, with the spread also increasing sharply as Figure 23 illustrates. Europe (net/Importer) and North America (net/exporter) has been near flat in terms of spread variation. Estimated wood pulp balance in Europe foresees increases in imports by 8.2%, while apparent consumption is expected to increase to 3.7%.
Bearing in mind that market pulp is sold to paper makers, it is consequently dependent on the market conditions from the several paper grades which as we seen in the overall is growing and accelerating but in a slow pace.
23
RISI Global Tissue Business Outlook, European Paper Week presentation
24 Fisher International president, characterized the industry as global, in a consolidation perspective 25
Bloomberg Senior Analyst - Joshua L Zaret – Market Pulp Industry Report
26
Kurt Schaefer, Fiber Vice President Presentation
Figure 22. Global Pulp Production (in k tonnes)
Figure 21. Consolidation in the BHKP sector
Source: Fisher International
Table 5. Market and Integrated Pulp balance Figure 23. Imports and
Exports in Asia and South America
Source: FAO Data base
New BHKP capacity is expected to flow into the market, where it is highlighted the APP OKI 1000k tonnes increase in capacity for 2017. The total net capacity increase is estimated at 770k tonnes (Figure 25).
Not surprisingly, wood prices has a central role for the overall Industry, since it is the main raw material for the production of pulp. Regarding BHKP, eucalyptus is the main hardwood species used for its production. Main factors influencing this commodity are: The overall construction and housing sector;; natural disasters mainly fires and strong winds;; regulation given the environmental value of the commodity and issues regarding forest protection;; energy costs (which typically range from 15% to 30% of total pulp production cost27);; the spread between hard and soft wood. Hardwood is cheaper than softwood, but on the other hand, softwood because of the highest length of its fibers, provides paper more strength and resistance. When the spread between both qualities of wood increase, producers try to substitute as much as possible, soft by hard ones. Recently, the spread BHK-BSK has been increasing, which should put pressure on BHKP (lower/below price) to recover. It is important to notice that increases in prices not only brings direct benefit for the market pulp revenues, but also allows low cost production advantage for Navigator comparing with unintegrated competitors.
27
Mintec report, Pulp Commodity Factsheet
Figure 25. Expected 2017 Increases in capacity (in k tonnes)
Source: Fibria Corporate Presentation
Figure 24. Market Pulp Value Chain
Source: Fibria, Corporate Presentation, December 2016
Figure 26. European Pulp and Paper (UWF) Price Indexes (in EUR/ton)
Valuation
The estimation of the company’s fair value it was based on the discounted cash flow method (DCF). This method comprises three main drivers for value: cost of capital, free cash flow and growth.
In order to provide additional insights regarding the relation between the company’s fundamentals and it market value, a comparative valuation was elaborated using some popular metrics: Earnings, Book Value of Equity, EBITDA and Sales. Furthermore we analysed the price sensitivity to key variables used in the valuation, complementing it with a scenario analysis which pretends to give a perspective of the company’s value in face of changes in the assumed market conditions.
DCF
The DCF method resulted in a target price of 4.40 EUR, yielding a total return of 56%, with 47.54% from expected capital gain and 8.4% from expected shareholders cash in. The valuation table is presented below:
Although hedged by tissue and pellets, the low percentage of sales from these activities isn’t enough to prevent the decline in the free cash flow on the short term mainly caused by the paper market conditions. The sector and in particular the UWF segment it is the main factor affecting it. The forecast assumes market will
Table 6. Valuation Table
keep unbalanced, given the excess supply expected to persist in graphic paper, pressuring paper prices to maintain it downward momentum28.
As previously stated, MSCI World EUR was the Index chosen as a diversified portfolio with the intention to represent the market. Using a ten year German Bund as a proxy for the risk free rate and the historical excess returns of the indicated Index, for the period 2006 to 2016 market excess return yielded an average of 6.77%29. Unfortunately, averaging historical data for the estimation of market premium yields a biased estimation30 since expected market return should be above the risk free which does not hold for the assets considered. Other sources such as Credit Suisse Global Investment Returns 2016 Yearbook, were considered to certify the results obtained by having additional insights about market excess returns. It was estimated a global premium against US bonds of 3.2 p.p. for the period 1900-2015. We stated as a base scenario the premium at 5%, providing a sensitivity analysis between a considerable range.
Unlevered beta, along with volatility, increased significantly in the end of 2014. This upper trend is not observed in paper and pulp industry in general, but it is also seen in Semapa and Altri, suggesting that this increase might be a consequence of worsening domestic conditions. Taking this into consideration, the estimated levered beta was 1.2, the beta simple average with a time frame ranging from one to two years.
28 See: The Paper and Pulp Industry 29
Excess return was calculated using 3Yr weekly rolling returns
30
Robert C. Merton, On estimating the expected return on the market
Figure 27. NVG and MSERWI (3Yr rolling returns) vs German Bund
Source: Bloomberg
Source: Analyst Estimate
The cost of debt were obtained from a peers yield curve using the respective market value of debt. Using the estimated yield for a 10 year maturity corporate bond it was obtained the value of 4.12%31 for the cost of debt. The cost of equity were estimated through CAPM, yielding a levered cost of equity of 5.52%32.
The Net Debt level of the company, in terms of market valuation, has been ranging from 10% to 35%. We assumed for the purpose of the valuation a Net Debt to Enterprise Value of 20% which agrees with the 1.9x coverage specified in Moody´s report. Corporate Tax Rate, was assumed to be 20%, based on historical track which average 15% in the last 5 years, (Figure 30 present the income tax), current legislation, and bearing in mind the country economic instability caused mainly by the high national indebtedness which led us to take a conservative stance. The following table summarizes the assumptions described:
31
Cost of Debt = YTM x (1-PD) + (YTM- E[LR]) x (PD) (Probability of default and Loss rate in Moody´s tables)
32
WACC = E/EV*Ke + D/EV*Kd*(1-tax)
Figure 29. Net Debt to Enterprise Value ratio
Figure 31. Historical Income Tax Expense
Source: Company report / Bloomberg
Source: Company report
Figure 30. Yield Curve from peers
Source: Bloomberg/Analyst Estimate
Source: Analyst Estimate
Multiples Valuation
Other popular approach to access a company value is to compare key price and enterprise ratios with peers within the industry. The success of this method relies on the choice of the peers to be used as proxies. The average is obtained from peers in the shaded area which were chosen as the most relevant considering geography, size, segmentation and operational metrics.
The implied prices from the four ratios average a value of 3.09 EUR, slightly above the 2.98 EUR market is evaluating but below the 4.40 EUR from our estimation. Book and Sales suggests that markets are overpricing NVG and give us a narrower interval between the lower and higher ratio. While EBITDA and Earnings imply a price above the market, but on the other hand providing less accuracy given the interval amplitude.
Table 8. Comparables multiples
Table 9. Average, high and low from multiples Source: Bloomberg / Analyst Estimate
Indeed, Navigator’s profitability margin is 12%, comparing with 9% from peers average as well as the EBITDA margin of 25% comparing with the 20% peers average. Also Altri (a Portuguese comparable operating market pulp) suffer from the same discrepancy, with a profitability margin of 18%, the highest from the list and the second lowest P/E.
Sensitivity Analysis
The following table displays the sensitivity of target price plus expected shareholders cash-in from holding the stock during the 2017 year period, to changes in the respective inputs placed in the model. As one should anticipate a higher expected market excess return decrease expected capital return since it increases the demanded cost for capital.
Changes in expected capital gain when varying tax rate and target ratio Net Debt to Enterprise Value are presented in Table 11. Estimated gain are less responsive to this variables, and it would be need unlikely tax charges and net debt level to make us suggest a “sell”.
Furthermore, we must add that this estimation does not incorporate variations in the cost of debt which aren’t fully realistic, for a debt level of 30% the company’s coverage would increase to values beyond 3x which could increase cost of debt making the values presented over estimated. Nevertheless the table provides a
Table 10.
sense over the tax benefits of debt, showing that the incremental tax shield benefit from a higher tax rate does not compensate for its burden.
Finally we can observe the price changes when varying WACC and growth in perpetuity. Given the status quo of the industry and company on it, we hardly see a growth above 1%. Thus, focusing on the interval between 0% and 1% where we believe the company will be with higher probability.
Scenario Analysis
In order to provide a sense of the company’s value in face of changes in the assumed market conditions, two cases were analysed. Firstly, we supposed a pessimistic scenario, where digitalization would affect graphic paper demand more than the already estimated, leading UWF markets to perform even poorly and with a sharpest decrease in prices. Assuming the economy to keep sluggish, the overall industry oversupplied from Asia as well as regulation and trading policies to remain tighten, markets would not balanced immediately increasing the spread production/demand leading prices to drop given the excess supply. Nevertheless, we assume Navigator would be able to keep its market share stable. Given the decrease in demand, pulp would also be affected due to the consequential
Table 11.
Table 12.
Source: Analyst Estimate
decrease in demand from non integrated papermakers, nevertheless impacts would be damped by tissue and packaging demand. For this situation, target price is estimated at 3.63 EUR, representing an expected capital gain of 21.9% and dividend yield for the year period is estimated at 8.2%.
Secondly, we considered a more optimistic scenario, where graphic paper would reverse its downward slope in demand maintaining a flat development, thus, allowing markets to balance and prices to remain stable. Considering this situation, market pulp is expected to gain momentum experiencing price increases. Furthermore, given the specified conditions, a return on invested capital of 11.5%33 where considered for the perpetuity yielding an expected growth rate of 0.88%. For this case we foresee a total return of 73.6%, with 64.99% from capital gain, obviously yielding a buy recommendation.
Risks
Finally, it was made a selection of relevant risks the company face running its activities. The investor should be aware of the existence of such risks, bearing in mind that the price suggested does not cover all.
33
Value of the return on invested capital performed in 2015, year in which UWF prices recovered.
Nature
Risk
External Operational
Paper and Pulp PricesExternal/Internal Operational
Balanced markets supply/demandExternal Operational
Increases in the Industry CapacityExternal Operational
Clients Default in ReceivablesExternal Operational
Supply Scarcity or Location ChangeExternal
Consumers Shift for AlternativesExternal/Internal Operational
Energy, Transportation and Tariffs CostsInternal/Investment
Capital Expenditure RequirementsExternal/Operational
Protective Trading PoliciesExternal/Operational/Financial
Economic and Political UncertaintyExternal/Financial
Currency RiskExternal/Financial
Increases in float ratesExternal/Internal/Financial
Debt Covenants and Financial FlexibilityExternal
Natural DisastersInternal/Operational
Accidents at WorkInternal/Operational
Equipment FailuresInternal/HR
Ability to Maintain key managers andemployees
Internal
Managers Reputation
Appendix
Financial Statements
34
From 2016E onwards, Financial Debt should be read as Net Debt
Income Statement 2012A 2013A 2014A 2015A 2016F 2017F 2018F 2019F 2020F
Revenues (Sales and Services) 1 502 1 531 1 542 1 628 1 641 1 696 1 685 1 672 1 658
COGS (609) (660) (675) (689) (673) (695) (691) (686) (680)
Gross Profit 893 871 867 939 968 1 000 994 986 978
Other operating income 29 21 34 29 30 30 30 30 30
SG&A (521) (555) (571) (564) (609) (630) (627) (623) (619)
EBITDA 400 337 330 405 389 400 397 393 389
Depreciation & Amortization (114) (103) (112) (122) (125) (126) (127) (128) (128)
EBIT (Operating results) 286 234 218 283 263 274 270 265 261
Net financial results (16) (14) (34) (50) (32) (32) (33) (33) (33)
Profit before tax 271 220 184 233 231 241 237 233 228
Income tax (59) (10) (3) (36) (46) (48) (47) (47) (46)
Net Income 211 210 181 197 185 193 190 186 183
Non-controlling interests (0) (0) (0) (0) - - - - -
Net profit for the period 211 210 181 196 185 193 190 186 183
Balance Sheet 2012A 2013A 2014A 2015A 2016F 2017F 2018F 2019F 2020F
Fixed Assets 1 930 1 839 1 768 1 872 1 876 1 882 1 891 1 898 1 904
Working Capital Assets 465 457 441 486 483 494 486 477 469
Cash and Cash Equivalents 329 524 500 73 - - - - -
Total assets 2 724 2 820 2 708 2 430 2 359 2 375 2 376 2 375 2 372
Working Capital Liabilities 334 314 306 302 322 323 311 300 288 Other non-current liabilities 216 195 176 186 186 186 186 186 186
Financial Debt34 693 831 773 727 786 789 792 795 799
Total Liabilities 1 244 1 340 1 255 1 216 1 294 1 298 1 289 1 280 1 273
Total Equity 1 481 1 480 1 454 1 214 1 065 1 078 1 087 1 094 1 099
Free Cash Flow 2012A 2013A 2014A 2015A 2016F 2017F 2018F 2019F 2020F EBIT 286 234 218 283 263 274 270 265 261
Notional Income Tax (57) (47) (44) (57) (53) (55) (54) (53) (52)
Tax adjustments (5) 34 34 11 - - - - -
Unlevered Net Income 224 221 209 237 211 219 216 212 209
+Depreciation 114 103 112 122 125 126 127 128 128
Gross Free Cash Flow 338 324 320 359 336 345 343 340 337
-△Working Capital (10) (12) 8 (48) 23 (10) (4) (3) (3)
Cash Flow from operations 328 312 329 310 359 335 339 337 334
-Capital Expenditures 24 (11) (41) (225) (130) (131) (136) (135) (134)
Free Cash Flow 352 300 288 85 229 203 203 202 200
+△Net Borrowing (100) (57) (33) 381 131 3 3 3 4
-After tax Interest expenses 13 11 27 40 26 26 26 26 26
+△Other liabilities (31) (21) (19) 10 - - - - -
Disclosures and Disclaimer
Research Recommendations
Buy Expected total return (including dividends) of more than 15% over a 12-month period.
Hold Expected total return (including dividends) between 0% and 15% over a 12-month period.
Sell Expected negative total return (including dividends) over a 12-month period.
This report was prepared by Tomás Franco, a student of the NOVA School of Business and Economics, following the Masters in Finance Equity Research – Field Lab Work Project, exclusively for academic purposes. Thus, the author, which is a Masters in Finance student, is the sole responsible for the information and estimates contained herein and for the opinions expressed, which reflect exclusively his/her own personal judgement. This report was supervised by professor Rosário André (registered with Comissão do Mercado de Valores Mobiliários as financial analyst) who revised the valuation methodology and the financial model. All opinions and estimates are subject to change without notice. NOVA SBE or its faculty accepts no responsibility whatsoever for the content of this report nor for any consequences of its use.
The information contained herein has been compiled by students from public sources believed to be reliable, but NOVA SBE or the students make no representation that it is accurate or complete, and accept no liability whatsoever for any direct or indirect loss resulting from the use of this report or its content.
The author hereby certifies that the views expressed in this report accurately reflect his/her personal opinion about the subject company and its securities. He/she has not received or been promised any direct or indirect compensation for expressing the opinions or recommendation included in this report.
The author of this report may have a position, or otherwise be interested, in transactions in securities which are directly or indirectly the subject of this report.
NOVA SBE may have received compensation from the subject company during the last 12 months related to its fund raising program. Nevertheless, no compensation eventually received by NOVA SBE is in any way related to or dependent on the opinions expressed in this report.
The Nova School of Business and Economics, though registered with Comissão do Mercado de Valores Mobiliários, does not deal for or otherwise offers any investment or intermediation services to market counterparties, private or intermediate customers.
This report may not be reproduced, distributed or published without the explicit previous consent of its author, unless when used by NOVA SBE for academic purposes only. At any time, NOVA SBE may decide to suspend this report reproduction or distribution without further notice.