Preoperative Determination of Prostate Cancer Tumor Volume:
Analysis through Biopsy Fragments
Alberto A. Antunes, Miguel Srougi, Marcos F. Dall’Oglio, Alexandre Crippa, Adriano J. Nesrallah,
Luciano J. Nesrallah, Katia R. Leite
Division of Urology, University of Sao Paulo Medical School, Sao Paulo, Brazil and Laboratory of
Surgical and Molecular Pathology, Syrian Lebanese Hospital, Sao Paulo, Brazil
ABSTRACT
Objective: Preoperative determination of prostate cancer (PCa) tumor volume (TV) is still a big challenge. We have assessed variables obtained in prostatic biopsy aiming at determining which is the best method to predict the TV in radical prostatectomy (RP) specimens.
Materials and Methods: Biopsy findings of 162 men with PCa submitted to radical prostatectomy were revised. Preoperative characteristics, such as PSA, the percentage of positive fragments (PPF), the total percentage of cancer in the biopsy (TPC), the maximum percentage of cancer in a fragment (MPC), the presence of perineural invasion (PNI) and the Gleason score were correlated with postoperative surgical findings through an univariate analysis of a linear regression model. Results: The TV correlated significantly to the PPF, TPC, MPC, PSA and to the presence of PNI (p < 0.001). However, the Pearson correlation analysis test showed an R2 of only 24%, 12%, 17% and 9% for the PPF, TPC, MPC, and PSA respectively.
The combination of the PPF with the PSA and the PNI analysis showed to be a better model to predict the TV (R2 of 32.3%).
The TV could be determined through the formula: Volume = 1.108 + 0.203 x PSA + 0.066 x PPF + 2.193 x PNI.
Conclusions: The PPF seems to be better than the TPC and the MPC to predict the TV in the surgical specimen. Due to the weak correlation between those variables and the TV, the PSA and the presence of PNI should be used together.
Key words: prostatic neoplasms; needle biopsy; volume, tumor; prognosis Int Braz J Urol. 2007; 33: 477-85
INTRODUCTION
Except for skin cancers, prostate cancer (PCa) is the most common tumor in men. In the United States, the number of new cases increased from 198,000 in 2001 to approximately 232,090 in 2005 (1). This tumor is also responsible for the second leading cause of death due to cancer and in 2005, 30,000 deaths due to this disease are expected (1).
One of the most important factors associated to the PCa tumor biology is the tumor volume (TV) in
radical prostatectomy (RP) specimens (2-5). An increased TV has been associated to high levels of preoperative prostatic specific antigen (PSA), and to many unfavorable pathological findings (6). Stamey et al. (4) demonstrated that biochemical recurrence rates after the RP are of 14%, 39%, 67% and 97% for patients with a TV of 0.5 to 2.0 cm3, 2.1 to 6.0 cm3, 6.1 to 12.0 cm3, and bigger than 12 cm3 respectively.
“clinically insignificant” tumors (inferior to 0.5 cm3 and presenting a Gleason score of less than 7) (9,10). While image exams have demonstrated limitations (11,12), data supplied by USG guided prostate biopsy have been widely studied (13,14). Some of the most frequent measures of PCa tumor extension in biopsy include the percentage of positive fragments (PPF), the total percentage of cancer (TPC) and the maximum percentage of cancer in a fragment (MPC). However, it is still not clear which ones relate better to the TV. While some believe that the PPF is the most important variable (7,13,15), others use the TPC (8,14,16) or the MPC (10).
In the present study, the authors analyze which is the best method to preoperative determination of TV in RP specimens based in tumor extension measures obtained in prostate biopsy.
MATERIALS AND METHODS
The study comprised the revision of prostate biopsy samples of 168 patients with clinically localized prostate tumor submitted to RP between 2001 and 2003. Pertinent clinical information such as age, clinical stage and initial PSA were documented. Six patients with insufficient pathological data were excluded from the study.
All the biopsy specimens were analyzed by the same pathologist (KRL). Data obtained in the biopsy were the tumor degree, the presence of perineural invasion (PNI), the PPF, TPC and the MPC. The PPF was defined by the formula number of positive fragments/total number of fragments removed X 100. The percentage of cancer in each fragment of the biopsy was obtained by the measure of tumor quantity in millimeters (mm) divided by the total length of the fragment in mm. X 100. The MPC was documented. This method helped to reduce the possibility of error caused by the variability of lengths among the fragments.
All patients were submitted to RP. To measure the TV in cubic centimeters (cm3), the RP specimens were introduced in a graded glass with water. The displacement of the liquid corresponds to the volume occupied by the gland. Mean and median
prostate volume was 47.4 cm3 and 36.3 cm3(12.8 to 32.8 cm3) respectively. Each gland was submitted to histological analysis according to previously described recommendations (17). The Gleason score was used to assess histological differentiation (18), and the TNM staging system from 1992 was used (19).
Tumor extension in the surgical specimen was defined with the use of Grid as described by Humphrey & Vollmer (20). The mean cancer percentage in the surgical specimen was of 15%, mean 11.5% (1 to 55). Finally, the TV in cm3 was obtained based on the volume of the whole gland and the tumor extension defined by Grid. The extra-prostatic disease was defined as the invasion of adipose tissue and/or of the periprostatic neurovascular plexus. It was considered as “clinically insignificant” tumors those with < 0.5 cm3 of volume and Gleason score < 7 (9,10).
Associations between the measures of tumor extensions in the biopsy and the pathological characteristics were analyzed through the Kruskal Wallis and Mann-Withney tests. A linear regression model was used to correlate the TV in the RP specimens with preoperative variables. To analyze the biopsy and the PNI Gleason score as categorical variables, the ANOVA and student’s T tests were performed. The statistical significance was defined as a p ≤ 0.05, and the statistical calculations were performed in the software SPSS 12.0 for Windows.
RESULTS
was observed in 41 (25.5%), 18 (11.2%) and 144 (89.4%) patients respectively.
The PPF, TPC and the MPC were significantly related to the pathological stage (p = 0.001, p < 0.001 and p < 0.001), extra-prostatic extension (p < 0.001, p < 0.001, p < 0.001), PNI (p = 0.001, p = 0.003, p = 0.005) and with the involvement of seminal vesicles (p = 0.013, p = 0.005, p < 0.001) respectively. The postoperative Gleason score significantly related to the TPC (p = 0.007) and the MPC (p = 0.007), but not to the PPF (p = 0.181).
The mean TV in the RP specimens was 5.6 cm3, with a mean value 4.4 cm3 (0.4 to 20). The Pearson correlation analysis showed that the age of the patients was not related to the TV (r = -3.3%; 95% CI [-18.6%; 12.2%]). The TV significantly related to the PPF, TPC, MPC and to the preoperative PSA. When we add a percentage unit (1%) to the PPF, there was a significant increase of the 0.0872 cm3in the TV (p < 0.001). The adding of one percentage unit in the TPC and in the MPC resulted
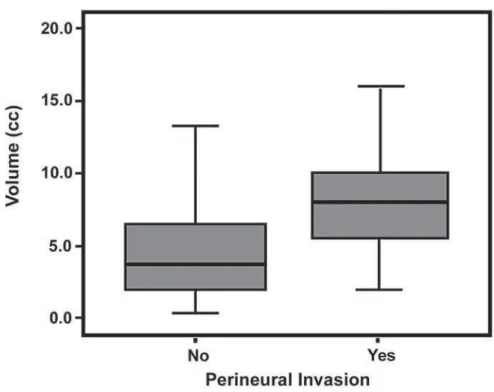
in an increase of the 0.076 cm3 and 0.054 cm3 in the TV respectively (p < 0.001). The adding of one unit to the PSA (1 ng/mL), increased 0.257 cm3 in the TV (p < 0.001). The presence of PNI, analyzed as a categorical variable showed a significant association with the TV. The mean TV between the patients with or without the PNI was 8.3 cm3 (median 8.0; 0.6 to 16.5) and 4.6 cm3 (median 3.7; 2 to 20) respectively (p < 0.001), Figure-1. The Gleason score of the biopsy also analyzed as categorical variable did not show a relation with the TV (p = 0.462).
However, despite the significant association among the majority of the preoperative variables and the TV, the linear regression model demonstrated that these variables were weak. The multiple determination coefficient (R2) for PPF was 24%, i.e., only 24% of the observations in the x-axis had a linear relation with the y-axis (Figure-2). The values of the R2for the TPC, MPC and for the PSA were yet inferior (12%, 17% and 9% respectively) (Figure-2).
After testing all the variables, the regression model that provided a better estimation of the TV in the surgical specimen included the PPF, the PSA and the PNI: Volume = 1.108 + 0.203 x PSA + 0.066 x PFP + 2.193 x PNI. The R2for this model was of 32.3% that means that together, these variables can explain 32.3% of the variables in the TV.
COMMENTS
The present study analyzed in 162 patients the predictive factors of the TV in prostatic variables recently performed (between 2001 and 2003) and with a large number of fragments (mean 12.5 per patient). Except for the lack of association between the PPF
A
B
Figure 2 – A) Tumor volume scatter plot according to the percentage of positive fragments (r = 48.9% - 95% IC [35.3% - 60.5%]).
Figure 2 – C) Tumor volume scatter plot according to the maximum percentage of cancer in a fragment (r = 41.4% - 95% IC [27.6%
- 53.6%]). D) Tumor volume scatter plot according to the prostate specific antigen (r = 30.7% - 95% IC [16.0% - 44.0%]).
C
D
and the final Gleason score, all the measures of tumor extension in the biopsy significantly related to postoperative pathological findings. The PPF, TPC and the MPC have also significantly related to the TV, but the linear regression model demonstrated only a weak relation. The PPF related better to the TV when
compared to the TPC and the MPC. The addition of the PSA and of the PNI analysis improved the sensibility of the final model to predict the postoperative TV.
multivariate model including the PSA and the Gleason score, that the PPF and the TPC are the most important predictive factors of the TV pathological stage, however, the PPF constituted a more practical and reproducible variable. Gancarczyk et al. (15) defined that the PPF, together with the PSA and the Gleason score of the biopsy were the most important variables to define the pathological stage, and based in these variables have developed a nomogram to predict the evolution of the patients after an RP.
Some authors prefer the use of the TPC to predict the TV in RP specimens. Bostwick et al. (16) showed that the combination of the PSA, Gleason score and the TPC provide the best sensibility to predict the chance of capsular penetration and invasion of seminal vesicles. Grossklaus et al. (14), stated that the TPC together with the PSA and the presence of positive fragments bilaterally are independent predictors of TV and suggest its routine use to predict the PCa pathological characteristics in the surgical specimen. However, none of these studies assessed the PPF. Cupp et al. (8), comparing the PPF, the TPC and the extension of the cancer in millimeters (total millimeters of cancer divided by the number of fragments in the biopsy), defined that the best variable to predict the TV as the TPC. The linear regression model used found r = 0.51, almost the same value found by us when we analyzed in a similar way the PPF (r = 0.49), and as in our study they have also found a great variation of TV for a given percentage of cancer in the biopsy.
Other authors have also found a weak relationship between the measures of tumor extension in the biopsy and the TV in the RP specimens. Noguchi et al. (13), determined that even though the TV is significantly related to the number of positive fragments, PPF, total length of the cancer in the biopsy and the percentage of Gleason score 4 and 5, each of those variables demonstrated an R2 inferior to 10%. A possible explanation for this weak relation is due to the fact that 84% of the biopsies have been performed with only 6 fragments. In the present study, 19 (12%) patients were submitted to biopsies with 6 fragments or less. Due to the PCa multifocality maybe if more fragments were
routinely removed, stronger correlations could have been found.
Other models, also based on TV tried to identify patients with “clinically insignificant” tumors. Epstein et al. (9), studying 157 patients treated with RP, defined that the best model to identify those tumors include patients with a PSA density inferior to 0.1 ng/mL/g, less than 3 positive fragments, absence of Gleason 4/5 and MPC of 50%. Sensitivity and specificity of this method were 56% and 95% respectively. Carter et al. (21), using the same model in 72 patients, found a sensitivity and specificity of 27% and 96% respectively. Anast et al. (10) defined that the best model would include patients with a MPC inferior to 10% and a Gleason score inferior to 7. Sensitivity and specificity of this model were 77% and 75% respectively.
However, investigation of insignificant tumors was not possible since only one patient presented this type of tumor. Some considerations can explain this fact. Firstly, identification of tumors with small volume is difficult due to the prostate biopsy imprecision, and secondly, it seems to really exist a low incidence of these tumors in patients candidates to RP. In the Cupp et al. (8) series, only 3 (2.3%) of the 130 patients studied presented such tumors. Our model needs to be applied to a population with a larger number of insignificant tumors in order for us to develop a model aiming at identifying these tumors.
Finally, with the present study we observed that for a given percentage of cancer in the biopsy, there is a great variability in the TV. These findings show that the measures of tumor extension in the biopsy are insufficient to precisely predict the TV and, thus other variables should be used jointly to try to improve the method’s sensitivity. The use of the PPF together with the PSA and the assessment of the presence of PNI has constituted the best method to predict the TV in the surgical specimen.
CONFLICT OF INTEREST
REFERENCES
1. Jemal A, Murray T, Ward E, Samuels A, Tiwari RC, Ghafoor A, et al.: Cancer statistics, 2005. CA Cancer J Clin. 2005; 55: 10-30. Erratum in: CA Cancer J Clin. 2005; 55: 259.
2. McNeal JE, Bostwick DG, Kindrachuk RA, Redwine EA, Freiha FS, Stamey TA: Patterns of progression in prostate cancer. Lancet. 1986; 1: 60-3.
3. Stamey TA, McNeal JE, Freiha FS, Redwine E: Morphometric and clinical studies on 68 consecutive radical prostatectomies. J Urol. 1988; 139: 1235-41.
4. Stamey TA, McNeal JE, Yemoto CM, Sigal BM, Johnstone IM: Biological determinants of cancer progression in men with prostate cancer. JAMA. 1999; 281: 1395-400.
5. Poulos CK, Daggy JK, Cheng L: Prostate needle biopsies: multiple variables are predictive of final tumor volume in radical prostatectomy specimens. Cancer. 2004; 101: 527-32.
6. Lewis JS Jr, Vollmer RT, Humphrey PA: Carcinoma extent in prostate needle biopsy tissue in the prediction of whole gland tumor volume in a screening population. Am J Clin Pathol. 2002; 118: 442-50.
7. Sebo TJ, Bock BJ, Cheville JC, Lohse C, Wollan P, Zincke H: The percent of cores positive for cancer in prostate needle biopsy specimens is strongly predictive of tumor stage and volume at radical prostatectomy. J Urol. 2000; 163: 174-8.
8. Cupp MR, Bostwick DG, Myers RP, Oesterling JE: The volume of prostate cancer in the biopsy specimen cannot reliably predict the quantity of cancer in the radical prostatectomy specimen on an individual basis. J Urol. 1995; 153: 1543-8.
9. Stein JI, Walsh PC, Carmichael M, Brendler CB: Pathologic and clinical findings to predict tumor extent of nonpalpable (stage T1c) prostate cancer. JAMA. 1994; 271: 368-74.
10. Anast JW, Andriole GL, Bismar TA, Yan Y, Humphrey PA: Relating biopsy and clinical variables to radical prostatectomy findings: can insignificant and advanced prostate cancer be predicted in a screening population? Urology. 2004; 64: 544-50.
11. Babaian RJ, Troncoso P, Steelhammer LC, Lloreta-Trull J, Ramirez EI: Tumor volume and prostate specific antigen: implications for early detection and defining a window of curability. J Urol. 1995; 154: 1808-12. 12. Coakley FV, Kurhanewicz J, Lu Y, Jones KD, Swanson
MG, Chang SD, et al.: Prostate cancer tumor volume:
measurement with endorectal MR and MR spectroscopic imaging. Radiology. 2002; 223: 91-7. 13. Noguchi M, Stamey TA, McNeal JE, Yemoto CM:
Relationship between systematic biopsies and histological features of 222 radical prostatectomy specimens: lack of prediction of tumor significance for men with nonpalpable prostate cancer. J Urol. 2001; 166: 104-9; discussion 109-10.
14. Grossklaus DJ, Coffey CS, Shappell SB, Jack GS, Chang SS, Cookson MS: Percent of cancer in the biopsy set predicts pathological findings after prostatectomy. J Urol. 2002; 167: 2032-5; discussion 2036.
15. Gancarczyk KJ, Wu H, McLeod DG, Kane C, Kusuda L, Lance R, et al.: Using the percentage of biopsy cores positive for cancer, pretreatment PSA, and highest biopsy Gleason sum to predict pathologic stage after radical prostatectomy: the Center for Prostate Disease Research nomograms. Urology. 2003; 61: 589-95. 16. Bostwick DG, Qian J, Bergstralh E, Dundore P, Dugan
J, Myers RP, et al.: Prediction of capsular perforation and seminal vesicle invasion in prostate cancer. J Urol. 1996; 155: 1361-7.
17. Bostwick DG, Foster CS: Examination if radical prostatectomy specimens: Therapeutic and prognostic significance. In: Foster W, Bostwick D (ed.), Pathology of Prostate. Series Major Problems in Pathology. Philadelphia, WB Saunders. 1998; vol. 34, p. 172-89. 18. Gleason DF, Mellinger GT: Prediction of prognosis for
prostatic adenocarcinoma by combined histological grading and clinical staging. J Urol. 1974; 111: 58-64. 19. AJCC CANCER: Staging Manual. Chicago, Lippincott
Raven, 6th ed., 2002.
20. Humphrey PA, Vollmer RT: Intraglandular tumor extent and prognosis in prostatic carcinoma: application of a grid method to prostatectomy specimens. Hum Pathol. 1990; 21: 799-804.
21. Carter HB, Sauvageot J, Walsh PC, Epstein JI: Prospective evaluation of men with stage T1C adenocarcinoma of the prostate. J Urol. 1997; 157: 2206-9.
Accepted after revision: April 10, 2007
Correspondence adrress:
EDITORIAL COMMENT
The amount of tumor in prostate needle cores is an extremely important pathologic parameter and a predictor of lethal phenotype of prostate cancer that must be reported in needle biopsies, as the extent of involvement of needle cores by prostatic adenocarcinoma has been shown to correlate (albeit not perfectly) with the Gleason score, tumor volume, surgical margins and pathologic stage in radical prostatectomy specimens (1-8). The extent of needle core involvement including bilateral involvement has also been shown to predict biochemical recurrence, post-prostatectomy progression and radiation therapy failure in univariate and often in multivariate analysis. It is a parameter included in some recent nomograms created to predict pathologic stage and seminal vesicle invasion after radical prostatectomy and radiation therapy failure. While the correlation for high tumor burden in needle biopsies is directly proportional to the likelihood of an adverse outcome, low tumor burden in needle biopsies is not necessarily an indicator of low volume and low-stage cancer in the prostatectomy specimen. As with the other parameters, combination of the extent of involvement of needle cores with the Gleason score, location of the tumor and serum PSA levels increases the prognostic and predictive power of this parameter.
There is lack of consensus in the literature and, hence, to some extent in clinical practice as to the best method of reporting the extent of tumor involvement. It is recommended that the report should provide the number of involved of cores. In addition, one or both of the following more detailed methods of tumor extent should be performed. One method is to report the linear length of cancer. The other method is to provide a percentage estimate of involvement of each of the cores derived by visual estimation. Typically, small foci (depending on the individual case) are reported as less than 1% or less than 5%, etc., of needle core biopsies and linear length in increments of 0.5 mm. The correlation, as alluded to before with prognosis, is with greater involvement of the cores, and studies have shown cut-offs of ≤ 33%, 34-50% and 51-100% or ≤ 20%, 21-55% and > 56%, etc., to be of significance. The method of calculation in
different studies has varied from visual estimation to linear measurement of each core calculated as a percentage length or percentage estimation for an entire case and not individual biopsies. Since literal translation of these findings to clinical cases would be difficult and not really necessary, reporting the percentage of cancer involvement in increments of 5 or 10% is appropriate. One problem encountered with this otherwise straightforward method is when there is extreme fragmentation of the needle biopsy specimen, making assessment of the number of cores and the percentage of cancer within each core difficult. This problem needs to be resolved on an individual case basis using best medical judgment. In case of highly fragmented tissue, this may be overcome by providing a composite (global) percentage of involvement of cancer in all needle biopsy tissue, and this may be a slightly more accurate correlate of the amount of cancer in the prostate gland itself. Bilateral cancer, which indicates multifocality, is indirectly partially suggestive of greater tumor volume, is most often not specified by pathologists in the report, but this parameter is directly and easily deduced from the pathology report findings of each of the cores submitted. In patients not subsequently treated by radical prostatectomy, this forms a critical factor in assigning “pathologic stage”.
REFERENCES
1. Poulos CK, Daggy JK, Cheng L: Prostate needle biopsies: multiple variables are predictive of final tumor volume in radical prostatectomy specimens. Cancer. 2004; 101: 527-32.
2. Poulos CK, Daggy JK, Cheng L: Preoperative prediction of Gleason grade in radical prostatectomy specimens: The influence of different Gleason grades from multiple positive biopsy sites. Mod Pathol. 2005; 18: 228-34.
3. Eichelberger LE, Koch MO, Daggy JK, Ulbright TM, Eble JN, Cheng L: Predicting tumor volume in radical prostatectomy specimens from patients with prostate cancer. Am J Clin Pathol. 2003; 120: 386-91.
independent predictor of prostate specific antigen recurrence in prostate cancer. Mod Pathol. 2005;18:886-90.
5. Montironi R, Vela-Navarrete R, Lopez-Beltran A, Mazzucchelli R, Bono A: 2005 update on pathology of prostate biopsies with cancer. Eur Urol. 2006; 49: 441-7. 6. Montironi R, Mazzucchelli R, Scarpelli M, Lopez-Beltran A, Mikuz G, Algaba F, et al.: Prostate carcinoma II: prognostic factors in prostate needle biopsies. BJU Int. 2006; 97: 492-7.
7. Montironi R, Mazzucchelli R, Scarpelli M, Lopez-Beltran A, Mikuz G: Prostate carcinoma I: prognostic factors in radical prostatectomy specimens and pelvic lymph nodes. BJU Int. 2006; 97: 485-91.
8. Montironi R, Vela Navarrete R, Lopez-Beltran A, Mazzucchelli R, Mikuz G, Bono AV: Histopathology reporting of prostate needle biopsies. 2005 update. Virchows Arch. 2006; 449: 1-13.
Dr. Rodolfo Montironi
Institute of Pathological Anatomy Polytechnic University Marche Region Ancona, Italy E-mail: [email protected]
![Figure 2 – A) Tumor volume scatter plot according to the percentage of positive fragments (r = 48.9% - 95% IC [35.3% - 60.5%]).](https://thumb-eu.123doks.com/thumbv2/123dok_br/15142511.518220/4.892.158.722.385.658/figure-tumor-volume-scatter-according-percentage-positive-fragments.webp)

