ISSN 1806-3713 © 2015 Sociedade Brasileira de Pneumologia e Tisiologia
http://dx.doi.org/10.1590/S1806-37562015000000314
Conidence intervals: a useful statistical tool
to estimate effect sizes in the real world
Cecilia Maria Patino,1,2 Juliana Carvalho Ferreira2,3
1. Department of Preventive Medicine, Keck School of Medicine, University of Southern California, Los Angeles, CA, USA.
2. Methods in Epidemiologic, Clinical and Operations Research–MECOR–Program, American Thoracic Society/Asociación Latinoamericana de Tórax. 3. Divisão de Pneumologia, Instituto do Coração – InCor – Hospital das Clínicas, Faculdade de Medicina, Universidade de São Paulo, São Paulo, Brasil.
PRACTICAL SCENARIO
A prospective cohort study evaluated the association between the presence of asthma and the risk of developing obstructive sleep apnea (OSA) in adults. Adults were randomly recruited from a population-based list of state employees and were followed for four years. Participants with asthma, when compared with those without, had a higher risk of developing OSA in four years (relative risk [RR] = 1.39; 95% CI: 1.06-1.82; p = 0.03)
BACKGROUND
When conducting clinical research, we usually recruit a subgroup of the population of interest in order to
increase study eficiency (fewer costs and less time). This
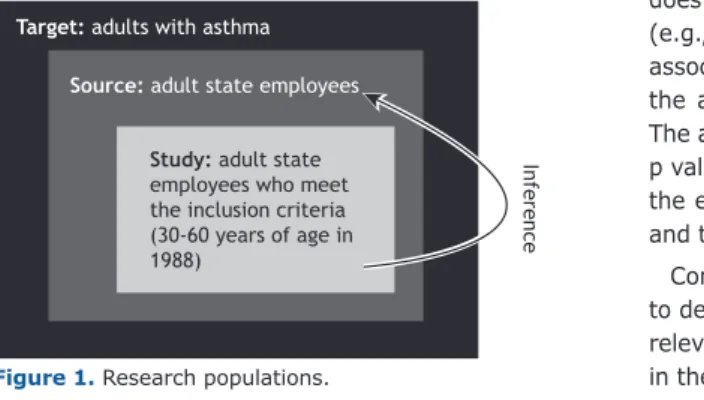
subgroup of individuals, thestudy population, are those individuals who meet the inclusion criteria and agree to participate in the study (Figure 1). We then complete the study and calculate an effect size (e.g., a mean difference
or a relative risk) to answer our research question. This
process (inference) involves using data collected from the study population to estimate the true effect size in the population of interest, i.e., the source population. In our example, investigators recruited a random sample of state employees (source population) who were eligible and agreed to participate in the study (study population) and reported that asthma increases the risk of developing
OSA in the study population (RR = 1.39). To take into
account a sampling error due to recruiting only a subgroup of the population of interest, they also calculated a 95%
conidence interval (around the estimate) of 1.06-1.82,
indicating a 95% probability that the true RR in the source population would be between 1.06 and 1.82.
DEFINITION
A conidence interval is a measure of imprecision of the
true effect size in the population of interest (e.g., difference
between two means or a relative risk) estimated in the
study population. That imprecision is due to the sampling
error caused by taking subsamples of the population of interest. However, the estimate calculated in the study population is always the best estimate of the effect size in the source population.
WHY DO WE NEED CONFIDENCE INTERVALS?
We need conidence intervals to indicate the amount of
uncertainty or imprecision around the effect size calculated, using the study sample to estimate the true effect size
in the source population. Calculating the conidence
interval is a strategy that takes into account sampling
error: the study effect size and its´ conidence interval
represent plausible values for the source population, and
the narrower the conidence interval is, the more certain
we are that the estimate from the study population represents the true effect size in the source population.
CONFIDENCE INTERVALS: INTERESTING FACTS
The most common width of conidence intervals reported in the literature is the 95% conidence interval. However, if we are interested in more or less conidence, 90% or 99% conidence intervals can be used.
The conidence interval represents the uncertainty of
the effect size in the source population, not in the study
population. When calculating a conidence interval, the
width of the interval is determined by the sample size (i.e., the individuals who agreed to be studied), the amount of measurement error of the study, and the degree of
conidence required.
There is a unique relationship between the 95% coni
-dence interval and a two-sided 5% level of signiicance. When the 95% conidence interval for differences in effect
does not include 0 for absolute measures of association (e.g., mean differences) or 1 for relative measures of association (e.g., odds ratios), it can be inferred that
the association is statistically signiicant (p < 0.05). The advantage of the 95% conidence interval over the
p value is that it provides information about the size of the effect, the uncertainty of the population estimate, and the direction of the effect.
Conidence intervals should always be used in order to describe the major indings of a research study. The relevant conidence intervals should be shown not only
in the text of the paper but also in the abstract. Target: adults with asthma
Source: adult state employees
Study: adult state employees who meet the inclusion criteria (30-60 years of age in 1988) In fe re n c e
Figure 1. Research populations. J Bras Pneumol. 2015;41(6):565-566
565
Conidence intervals: a useful statistical tool to estimate effect sizes in the real world
RECOMMENDED READING
1. Teodorescu M, Barnet JH, Hagen EW, Palta M, Young TB, Peppard PE. Association between asthma and risk of developing obstructive sleep apnea. JAMA. 2015;313(2):156-64. http://dx.doi.org/10.1001/ jama.2014.17822
2. Sedgwick P. Understanding conidence intervals. BMJ. 2014;349:g6051. http://dx.doi.org/10.1136/bmj.g6051
3. Sedgwick P. Conidence intervals: predicting uncertainty. BMJ. 2012;344:e3147. http://dx.doi.org/10.1136/bmj.e3147
4. Ferreira JC, Patino CM. What does the p value really mean? J Bras Pneumol. 2015;4195):485. doi: 10.1590/S1806-37132015000000215. 5. Gardner MJ, Altman DG. Statistics with conidence: conidence
intervals and statistical guidelines. British Medical Journal. Belfast: The Universities Press Ltd; 1989.