Dietary intake of non-dialysis chronic kidney disease
patients: the PROGREDIR study. A cross-sectional study
Alisson Diego Machado
I, Fernanda Silva Nogueira dos Anjos
II, Maria Alice Muniz Domingos
III, Maria del Carmen Bisi Molina
IV,
Dirce Maria Lobo Marchioni
V, Isabela Judith Martins Benseñor
VI, Silvia Maria de Oliveira Titan
VIIFaculdade de Medicina da Universidade de São Paulo (FMUSP), São Paulo (SP), Brazil
INTRODUCTION
Chronic kidney disease (CKD), defined as estimated glomerular filtration rate (eGFR) < 60 ml/min/1.73m2 or persistent albuminuria, affects more than 10% of the world’s
popula-tion.1,2 Early diagnosis of CKD is important for reducing the risk of progression and
cardio-vascular morbidity and mortality, which is 30 times greater among people with CKD than in the general population.3 Management of modifiable risk factors is essential, and diet has
emerged as an important but often neglected therapeutic tool for prevention and retardation of CKD progression.4
Currently, the main goals of nutritional therapy in relation to CKD are to reduce accumu-lation of byproducts from metabolism and reduce progression of renal disease.5 In addition,
diet may form a strategy for preventing or ameliorating complications of CKD, including acidosis, hyperkalemia, hyperphosphatemia, uremic symptoms, bone diseases and protein-energy wasting.6,7 However, diet is still underused as a prevention strategy.8 Furthermore,
although low-protein diets are the strategies that have been most studied in relation to CKD, there is evidence to suggest that many other nutrients may influence renal outcomes,4 such
as phosphorus, sodium, potassium, calcium and vitamin K. In addition, few studies have addressed new analytical approaches, such as dietary pattern analysis, rather than evalua-tion of individual nutrients.7
PROGREDIR is a cohort study that was designed to evaluate the determinants of CKD progression and mortality risk among CKD patients.9 The cohort essentially comprises
people with CKD classes 3 and 4 living in São Paulo, Brazil, and diet is one of the factors under investigation.
IMSc. Dietitian, Department of Nephrology,
Hospital das Clínicas (HC), Faculdade de Medicina da Universidade de São Paulo (FMUSP), São Paulo (SP), Brazil.
orcid.org/0000-0002-1564-5405
IIDietitian, Department of Nephrology, Hospital
das Clínicas (HC), Faculdade de Medicina da Universidade de São Paulo (FMUSP), São Paulo (SP), Brazil.
orcid.org/0000-0002-6148-6185
IIIMD. Nephrologist, Department of Nephrology,
Hospital das Clínicas (HC), Faculdade de Medicina da Universidade de São Paulo (FMUSP), São Paulo (SP), Brazil.
orcid.org/0000-0001-8687-5809
IVPhD. Dietitian and Associate Professor, Health
Sciences Center, Universidade Federal do Espírito Santo (UFES), Vitória (ES), Brazil.
orcid.org/0000-0002-8614-988X
VPhD. Dietitian and Associate Professor,
Department of Nutrition, Faculdade de Saúde Pública (FSP), Universidade de São Paulo (USP), São Paulo (SP), Brazil.
orcid.org/0000-0002-6810-5779
VIMD. Associate Professor, General Medicine
Unit, Hospital Universitário (HU), Faculdade de Medicina da Universidade de São Paulo (FMUSP), São Paulo (SP), Brazil.
orcid.org/0000-0002-6723-5678
VIIMD. Research Investigator, Department
of Nephrology, Hospital das Clínicas (HC), Faculdade de Medicina da Universidade de São Paulo (FMUSP), São Paulo (SP), Brazil.
orcid.org/0000-0002-6206-1111
KEY WORDS:
Renal insufficiency, chronic. Diet.
Health surveys.
ABSTRACT
BACKGROUND: Despite evidence that diet is very important in relation to chronic kidney disease (CKD) progression, studies in this field are scarce and have focused only on some specific nutrients. We evaluated the energy, macronutrient and micronutrient intakes and dietary patterns of non-dialysis CKD participants in the PROGREDIR study.
DESIGN AND SETTING: Cross-sectional study; CKD cohort, São Paulo, Brazil.
METHODS: Baseline data on 454 participants in the PROGREDIR study were analyzed. Dietary intake was evaluated through a food frequency questionnaire. Dietary patterns were derived through principal com-ponent analysis. Energy and protein intakes were compared with National Kidney Foundation recommen-dations. Linear regression analysis was performed between energy and nutrient intakes and estimated glo-merular filtration rate (eGFR), and between sociodemographic and clinical variables and dietary patterns.
RESULTS: Median energy and protein intakes were 25.0 kcal/kg and 1.1 g/kg, respectively. In linear re-gression, protein intake (β = -3.67; P = 0.07) was related to eGFR. Three dietary patterns (snack, mixed and traditional) were retained. The snack pattern was directly associated with male gender (β = 0.27; P = 0.006) and inversely with diabetes (β = -0.23; P = 0.02). The traditional pattern was directly associated with male gender (β = 0.27; P = 0.007) and schooling (β = 0.40; P < 0.001) and inversely with age (β = -0.01; P = 0.001) and hypertension (β = -0.34; P = 0.05).
OBJECTIVE
We evaluated the association between energy, macronutrient and micronutrient intakes and eGFR, along with dietary pat-terns and their associated factors among the participants of the PROGREDIR study.
METHODS
The present study consisted of an evaluation on baseline data from the PROGREDIR study. Details of the methods have been published elsewhere.9 Briefly, patients attending the
out-patient service of Hospital das Clínicas, São Paulo, a quater-nary-level care facility, were invited to participate in the study. Initially, from the outpatient records, all patients aged ≥ 30 years old who presented at least two creatinine measurements (with a minimum interval of three months) ≥ 1.6 mg/dl for men and
≥ 1.4 mg/dl for women were considered to be potential candi-dates. Patients who were attending oncology, psychiatry, urology, human immunodeficiency virus/acquired immunodeficiency syndrome (HIV/AIDS), viral hepatitis and glomerulonephri-tis services were excluded. The remaining candidates were then contacted by phone and invited to participate if none of the fol-lowing exclusion criteria were met: hospitalization or acute myo-cardial infarction in the last six months, autoimmune diseases, pregnancy, psychiatric diseases, ongoing chemo or immuno-suppressive therapy, ongoing renal replacement therapy, glo-merulonephritis, HIV/AIDS infection, hepatitis B or C, or pre-vious transplantation of any organ. Recruitment took place from March 2012 to December 2013, and 454 participants were enrolled. The study was approved by two local ethics committees, and written informed consent was obtained from all participants (protocol number 11147/11, approved on November 4, 2011, and protocol number 0798/11, approved on February 2, 2012).
Each participant visited the research center for interviews and clinical examinations in accordance with standard proto-cols. The interviews and clinical examinations were conducted by trained personal under strict quality control conditions. Data on sociodemographic variables (age, gender, schooling level and income class) and lifestyle variables (tobacco use, alcohol use and physical activity practice) were self-reported. Diabetes was defined using a five-criterion definition that included any previous medical his-tory of diabetes, use of medication to treat diabetes, fasting plasma glucose ≥ 126 mg/dl, glycated hemoglobin ≥ 6.5%, and two-hour plasma glucose ≥ 200 mg/dl (oral glucose tolerance test). eGFR was estimated by means of the Chronic Kidney Disease Epidemiology Collaboration equation.10
We used the validated food frequency questionnaire (FFQ) of the Brazilian Longitudinal Study of Adult Health (ELSA-Brasil)11
to evaluate the dietary intake. The questionnaire asked about 114 foods or preparations and evaluated the frequency (daily, weekly
or monthly) and the usual amount of intake of each food/prepa-ration (in household measurements). In addition, it also included 19 questions about the characteristics of the subjects’ dietary hab-its over the last 12 months. This FFQ was applied by staff who had been trained for this function. After data collection, the FFQ was reviewed to verify whether the portion size of the foods was in accor-dance with what is usually consumed by the Brazilian population. To evaluate energy and nutrient intakes, we used the United States Department of Agriculture (USDA) Food Composition Databases12 except when these values were outside of the range
of 80% to 120% of the values in the Brazilian Table of Food Composition,13 in which case we used the latter values. We excluded
patients whose energy intake was higher than 5,000 kcal (n = 11) from the analyses, because these are unlikely values that might have led to overestimation of nutrient intakes.14
Macronutrient and micronutrient intakes were adjusted for energy using the residual method.15 To analyze energy and protein intake
per kg, we used the current body weight, or an adjusted weight when body mass index adequacy was less than 95% or greater than 115%.16
The energy and protein intakes were compared with the National Kidney Foundation recommendations.16 Intakes of supplements and
medications were not taken into consideration in the current analyses. Dietary patterns were derived from principal component analy-sis, with orthogonal (varimax) rotation to extract factors. We con-sidered the daily frequency of intake of each food in the analyses. Subsequently, foods with similar nutritional compositions were grouped into 20 foods/food groups. An exploratory factor analy-sis was performed, and the adequacy of the data was evaluated by means of the Kaiser-Meyer-Olkin (KMO) test and the Bartlett test of sphericity (BTS). We set different numbers of factors and chose those with interpretable patterns, which were named according to the interpretation of the data. A score was determined for each pattern, which allowed each participant to have one factor score for all patterns identified.17
Energy and nutrient intakes were presented as means and stan-dard deviations or as medians and interquartile ranges, according to gender. The variables were tested for normal distribution using the Kolmogorov-Smirnov test, and then differences between the groups were tested using Student’s t test (normal distribution) or the Mann-Whitney test (non-normal distribution). Linear regres-sion analysis was performed between energy and nutrient intakes and eGFR as a dependent variable and between sociodemographic and clinical variables and dietary patterns (factor scores) as a dependent variable. All analyses were performed using the SPSS software, version 17.0.
RESULTS
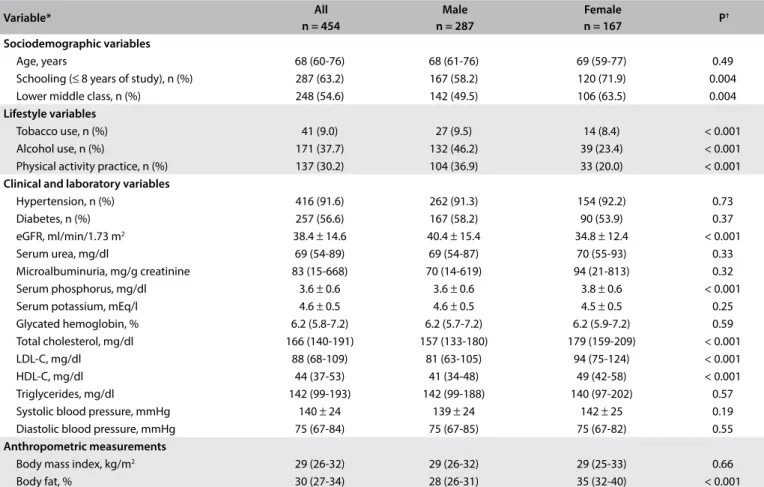
elderly, male, hypertensive and diabetic participants. The mean eGFR was 38.4 ± 14.6 (ml/min/1.73 m2).
Regarding energy and nutrient intakes, 293 (66.1%) of the participants showed an energy intake below the recommended amount, while 399 (90.1%) of them had a protein intake above the recommended amount for non-dialysis CKD patients. The male patients presented statistically higher intakes of energy (kcal) and iron than those of the females, who presented higher intake of protein (g/kg), dietary fiber, vitamin A, vitamin E, thiamine, pantothenic acid, cobalamin, vitamin C and potas-sium (Table 2).
In the univariate linear regression analysis, protein intake (g/kg) was inversely related to eGFR, while pyridoxine intake was directly associated. After adjustment for age, gender, diabe-tes, microalbuminuria and systolic blood pressure, only protein intake (g/kg) showed a trend towards remaining inversely related to eGFR (Table 3).
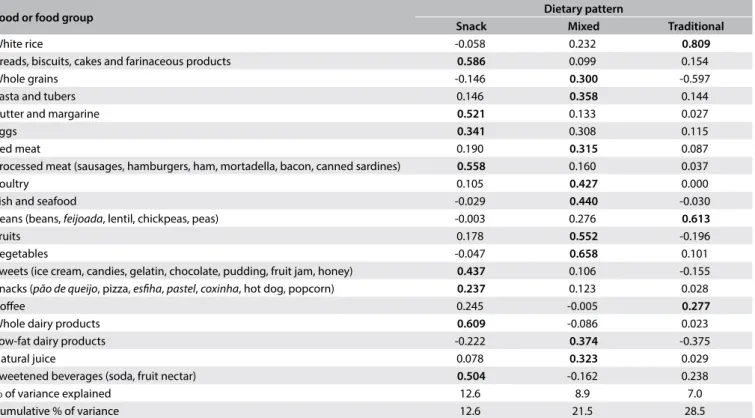
Three dietary patterns were retained for subsequent analysis. The snack pattern was composed predominantly of breads, biscuits, cakes, farinaceous products, butter, margarine, eggs, processed
meat, sweets, snacks, whole dairy products and sweetened bever-ages, which explained 12.6% of the variance. The mixed pattern was composed of whole grains, pasta, tubers, red meat, poultry, fish, seafood, fruits, vegetables, low-fat dairy products and natural juice, which explained 8.9% of the variance. The traditional pattern was composed of white rice, beans and coffee, which explained 7.0% of the variance. These patterns are shown in Table 4. The value from
the KMO test was 0.601 and the P-value of the BTS was < 0.001. The snack pattern was directly associated with male gender and inversely related to diabetes. The traditional pattern was directly associated with male gender and schooling level and inversely related to age and hypertension (Table 5). None of the patterns
was significantly related to eGFR.
DISCUSSION
In the present study, the participants reported having low energy and high protein intakes in relation to the nutritional recom-mendations for CKD patients. This is noteworthy, considering that this population was recruited from outpatient services in one of the major public hospitals in São Paulo. This finding is
Table 1. Baseline characteristics of participants in the PROGREDIR study
Variable* All
n = 454
Male n = 287
Female
n = 167 P
†
Sociodemographic variables
Age, years 68 (60-76) 68 (61-76) 69 (59-77) 0.49
Schooling (≤ 8 years of study), n (%) 287 (63.2) 167 (58.2) 120 (71.9) 0.004
Lower middle class, n (%) 248 (54.6) 142 (49.5) 106 (63.5) 0.004
Lifestyle variables
Tobacco use, n (%) 41 (9.0) 27 (9.5) 14 (8.4) < 0.001
Alcohol use, n (%) 171 (37.7) 132 (46.2) 39 (23.4) < 0.001
Physical activity practice, n (%) 137 (30.2) 104 (36.9) 33 (20.0) < 0.001 Clinical and laboratory variables
Hypertension, n (%) 416 (91.6) 262 (91.3) 154 (92.2) 0.73
Diabetes, n (%) 257 (56.6) 167 (58.2) 90 (53.9) 0.37
eGFR, ml/min/1.73 m2 38.4 ± 14.6 40.4 ± 15.4 34.8 ± 12.4 < 0.001
Serum urea, mg/dl 69 (54-89) 69 (54-87) 70 (55-93) 0.33
Microalbuminuria, mg/g creatinine 83 (15-668) 70 (14-619) 94 (21-813) 0.32
Serum phosphorus, mg/dl 3.6 ± 0.6 3.6 ± 0.6 3.8 ± 0.6 < 0.001
Serum potassium, mEq/l 4.6 ± 0.5 4.6 ± 0.5 4.5 ± 0.5 0.25
Glycated hemoglobin, % 6.2 (5.8-7.2) 6.2 (5.7-7.2) 6.2 (5.9-7.2) 0.59
Total cholesterol, mg/dl 166 (140-191) 157 (133-180) 179 (159-209) < 0.001
LDL-C, mg/dl 88 (68-109) 81 (63-105) 94 (75-124) < 0.001
HDL-C, mg/dl 44 (37-53) 41 (34-48) 49 (42-58) < 0.001
Triglycerides, mg/dl 142 (99-193) 142 (99-188) 140 (97-202) 0.57
Systolic blood pressure, mmHg 140 ± 24 139 ± 24 142 ± 25 0.19
Diastolic blood pressure, mmHg 75 (67-84) 75 (67-85) 75 (67-82) 0.55
Anthropometric measurements
Body mass index, kg/m2 29 (26-32) 29 (26-32) 29 (25-33) 0.66
Body fat, % 30 (27-34) 28 (26-31) 35 (32-40) < 0.001
*Continuous variables: mean ± standard deviation or median (with interquartile range); categorical variables: number (with percentage); †P-value for
comparison between gender groups.
concordant with data from other studies that have also reported low energy and high protein intake among non-dialysis CKD patients, and it highlights the difficulty in achieving efficacious application of nutritional guidelines in cases of chronic diseases. In a study by Avesani et al.,18 an energy intake of 22.4 kcal/kg was
identified among Brazilian patients, which was lower than what was observed in the present study. The energy and protein intake of the sample of the present study was similar to that found in the Modification of Diet in Renal Disease (MDRD) study, in an American population with CKD, but was higher than what was found in the Chronic Renal Insufficiency Cohort (CRIC) study and the National Health and Nutrition Examination Survey (NHANES III) study.19
Although a low-protein diet is currently the main therapeu-tic dietary recommendation for CKD, its actual application in clinical settings varies widely. Several factors may be contributing towards this, such as difficulty in establishing multidisciplinary approaches, lack of adoption of low-protein diets, fear of inten-sification of protein-energy wasting and low adherence to treat-ment by patients.20 Nonetheless, it was surprising to observe that
90% of the CKD population in the PROGREDIR study reported having a protein intake above the recommended value. There may have been several reasons for this, and these were not evaluated in the present study, but they possibly include the dietary habits of the Brazilian population, which are known to include high animal protein intake,21 along with low adherence to treatment and lack
of use of dietary interventions as an important tool for medical treatment. These results show that implementation of low-protein
Table 2. Energy and nutrient intakes among all participants in the PROGREDIR study and according to gender
Energy/Nutrient*
Intake†
P‡ All
n = 443
Male n = 277
Female n = 166
Energy, kcal 1923 (1491-2489) 2105 (1611-2684) 1625 (1286-2152) < 0.001
Energy, kcal/kg 25.0 (19.5-33.0) 26.3 (19.9-34.0) 24.3 (19.1-31.6) 0.10
Protein, g 83 (72-97) 83 (73-96) 83 (72-98) 0.73
Protein, g/kg 1.1 (0.9-1.4) 1.0 (0.9-1.2) 1.3 (1.0-1.5) < 0.001
Carbohydrate, g 289 ± 41 288 ± 44 290 ± 37 0.49
Total fat, g 50 ± 11 51 ± 11 49 ± 10 0.14
Dietary fiber, g 26.2 ± 8.5 25.4 ± 8.3 27.5 ± 8.6 0.01
Vitamin A, µg RAE 328 (236-505) 321 (231-480) 354 (253-587) 0.02
Vitamin E, mg 6.4 (5.2-7.9) 6.1 (5.0-7.5) 6.9 (5.7-8.5) < 0.001
Vitamin K, µg 160 (106-249) 160 (102-246) 160 (108-260) 0.44
Thiamine, mg 1.3 (1.0-1.8) 1.2 (1.0-1.6) 1.4 (1.0-2.1) 0.001
Riboflavin, mg 1.3 (0.9-1.8) 1.3 (0.9-1.8) 1.4 (0.9-1.8) 0.77
Niacin, mg 20.8 (15.0-31.1) 21.1 (15.4-30.4) 20.5 (14.7-34.1) 0.86
Pyridoxine, mg 0.7 (0.5-0.9) 0.7 (0.5-0.9) 0.7 (0.5-0.9) 0.34
Folate, µg 520 (447-608) 523 (439-611) 513 (453-603) 0.95
Cobalamin, µg 3.7 (2.8-4.8) 3.6 (2.7-4.7) 4.1 (3.0-5.3) 0.004
Vitamin C, mg 151 (74-261) 135 (65-221) 193 (104-311) < 0.001
Magnesium, mg 276 (240-329) 274 (240-318) 284 (242-342) 0.15
Manganese, mg 2.9 (2.4-3.5) 2.8 (2.4-3.4) 3.0 (2.4-3.6) 0.24
Calcium, mg 737 (539-974) 714 (533-959) 787 (549-990) 0.11
Iron, mg 10.2 ± 2.4 10.4 ± 2.4 9.9 ± 2.4 0.04
Zinc, mg 9.7 (8.4-11.8) 9.9 (8.6-11.8) 9.5 (8.0-11.8) 0.09
Selenium, µg 120 (104-139) 119 (102-136) 120 (106-142) 0.24
Phosphorus, mg 1184 ± 232 1178 ± 223 1196 ± 247 0.43
Sodium, mg 2236 (1868-2547) 2217 (1866-2613) 2241 (1875-2468) 0.57
Potassium, mg 3044 ± 700 2985 ± 681 3143 ± 720 0.02
*Nutrient intakes after adjustment for energy, by means of residual method; †mean ± standard deviation or median (with interquartile range); ‡P-value for
comparison between gender groups. RAE = retinol activity equivalent.
Table 3. Linear regression between nutrient intakes and eGFR among participants in the PROGREDIR study
Variable β 95% CI P
Model 1 - Univariate regression
Protein, g/kg -6.26 -10.10- -2.41 0.001
Pyridoxine, mg 4.52 0.18-8.86 0.04
Model 2 - Variables adjusted for age, gender, diabetes, microalbuminuria and systolic blood pressure
Protein, g/kg -3.67 -7.60-0.26 0.07
Pyridoxine, mg 2.68 -1.53-6.88 0.21
diets is not being accomplished in this CKD population, despite the fact that these individuals mostly presented CKD of classes 3 and 4 and were at high risk of CKD progression.
In addition, in the present study, protein intake showed a strong trend towards being inversely associated with eGFR in the linear regression analysis. Although we cannot address causal-ity in this cross-sectional study, this finding is concordant with data from other studies that have suggested that protein intake is
associated with CKD progression. These studies form the basis for the dietary recommendation of lowering protein intake to less than 0.8 g/kg/day.16
The low energy intake in this population may have been due to several factors, such as anorexia, nausea, anemia, restrictive diets and comorbidities. Low energy intake is one of the factors asso-ciated with the development of protein-energy wasting,22 which
is related to increased morbidity and mortality in CKD cases.23
Table 4. Distribution of factor loadings of dietary patterns identified among participants in the PROGREDIR study
Food or food group Dietary pattern
Snack Mixed Traditional
White rice -0.058 0.232 0.809
Breads, biscuits, cakes and farinaceous products 0.586 0.099 0.154
Whole grains -0.146 0.300 -0.597
Pasta and tubers 0.146 0.358 0.144
Butter and margarine 0.521 0.133 0.027
Eggs 0.341 0.308 0.115
Red meat 0.190 0.315 0.087
Processed meat (sausages, hamburgers, ham, mortadella, bacon, canned sardines) 0.558 0.160 0.037
Poultry 0.105 0.427 0.000
Fish and seafood -0.029 0.440 -0.030
Beans (beans, feijoada, lentil, chickpeas, peas) -0.003 0.276 0.613
Fruits 0.178 0.552 -0.196
Vegetables -0.047 0.658 0.101
Sweets (ice cream, candies, gelatin, chocolate, pudding, fruit jam, honey) 0.437 0.106 -0.155 Snacks (pão de queijo, pizza, esfiha, pastel, coxinha, hot dog, popcorn) 0.237 0.123 0.028
Coffee 0.245 -0.005 0.277
Whole dairy products 0.609 -0.086 0.023
Low-fat dairy products -0.222 0.374 -0.375
Natural juice 0.078 0.323 0.029
Sweetened beverages (soda, fruit nectar) 0.504 -0.162 0.238
% of variance explained 12.6 8.9 7.0
Cumulative % of variance 12.6 21.5 28.5
Table 5. Linear regression between sociodemographic and clinical variables and the dietary patterns among participants in the PROGREDIR study
Variable
Dietary pattern
Snack Mixed Traditional
β P β P β P
Model 1 - Univariate regression
Age, years 0.002 0.55 0.002 0.60 -0.01 0.001
Male gender 0.27 0.006 -0.05 0.61 0.27 0.007
Schooling level (≤ 8 years of study) 0.01 0.91 -0.11 0.25 0.23 0.02
Hypertension 0.08 0.66 -0.13 0.45 -0.40 0.03
Diabetes -0.22 0.03 0.17 0.08 -0.12 0.20
eGFR, ml/min/1.73 m2 0.003 0.29 0.001 0.73 0.006 0.08
BMI, kg/m2 -0.01 0.28 -0.02 0.06 0.002 0.86
Model 2 - Variables adjusted for age and gender
Schooling level (≤ 8 years of study) 0.02 0.83 -0.16 0.11 0.40 < 0.001
Hypertension 0.06 0.76 -0.16 0.38 -0.34 0.05
Diabetes -0.23 0.02 0.15 0.11 -0.13 0.18
eGFR, ml/min/1.73 m2 0.002 0.49 0.002 0.62 0.002 0.47
BMI, kg/m2 -0.007 0.47 -0.02 0.09 -0.002 0.81
Although it has been shown that low energy intake is related to lower eGFR and higher serum creatinine and blood urea nitro-gen,24 our study did not show any significant relationship between
eGFR and energy intake.
There is a lack of Brazilian studies evaluating the micronutrient intakes of non-dialysis CKD patients. In a study that evaluated the zinc and iron content in the diets of Brazilian non-dialysis CKD patients, low content of these minerals in comparison with those of the present study were observed.25 We were unable to identify
any other Brazilian studies evaluating the micronutrient intakes of non-dialysis CKD patients.
In a study conducted in Poland that evaluated the dietary intake of non-dialysis female CKD patients by means of a three-day food record, the intake was lower than in the present study for all micronutrients except for vitamin A, vitamin E and pyridox-ine.26 In three large American cohort studies (MDRD, CRIC and
NHANES III), high phosphorus intake was observed,19 as in the
present study, in which an amount of 1184 mg was recorded, i.e. almost 60% above the recommended amount.27 However, in the
present study, the sodium intake was lower than in those studies and the potassium intake was slightly higher.19
The dietary patterns identified in the present study were similar to those of other studies conducted among with Brazilian adults and elderly people with normal eGFR.28-30 According to the value
found in the KMO test and the P-value of the BTS, the factor anal-ysis can be considered adequate.31 In addition, the accumulated
variance was similar to that of other studies.28,32
We emphasize that the mixed pattern, composed of whole grains, meats, fruits and vegetables is generally referred to as “healthy” or “prudent” in studies on dietary patterns.28,30,33 However,
because a low-protein diet is recommended for non-dialysis CKD patients, we consider that high intake of meats, and consequently protein, may not be healthy or prudent in this population, and thus we name this pattern “mixed.”
The traditional pattern was directly associated with male gen-der and inversely associated with age, as found by Cardoso et al.34
in a population study. Male gender was also associated with the snack pattern, as verified by Ferreira et al.,32 which may indicate a
minor concern regarding feeding among men. The snack pattern was inversely associated with presence of diabetes, which may sug-gest that the diabetic subjects altered their dietary pattern because of their disease, which may explain why the diabetics consumed higher amounts of protein, vitamins and minerals than did the non-diabetic participants (data not shown).
In our study, none of the dietary patterns were associated with eGFR. In accordance with this finding, Gutiérrez et al.35
showed in a cohort study that no dietary pattern was related to CKD progression. However, a diet rich in fruits and vegetables was associated with lower risk of mortality. In addition, in a recent
meta-analysis, there was no association between a healthy pat-tern (higher in fruits, vegetables, fish, cereals and whole grains and lower in red meat and refined sugars) and the risk of end-stage renal disease, but it was found that this pattern was associ-ated with lower risk of mortality.36
In studies that included participants without baseline kidney disease, the results have been different. In a subgroup analysis from the Nurses’ Health Study, the Western pattern (rich in red and processed meats, saturated fats and sweets) was directly related to decreased eGFR and microalbuminuria, while the DASH (Dietary Approaches to Stop Hypertension) pattern was inversely associ-ated with decreased eGFR.37 In the ULSAM (Uppsala Longitudinal
Study of Adult Men) cohort, higher adherence to the Mediterranean diet was associated with lower presence of CKD and higher sur-vival rates.38
These results may indicate that dietary patterns have less influ-ence on the risk of end-stage renal disease after CKD has already become established and has reached moderate to advanced stages. However, higher intake of fruits and vegetables appears to be benefi-cial in relation to the risk of mortality among people with impaired and normal kidney function. Further studies may confirm these findings and also evaluate the association between dietary patterns and other factors, such as cardiovascular risk.
Our study had some limitations. Firstly, it was a cross-sec-tional analysis. Secondly, the PROGREDIR population is a hos-pital-derived sample, which implies that the diet reported was possibly influenced by current illnesses and their treatments. This may have reduced the extent to which the dietary assess-ment reflected the long-term previous intake. Furthermore, FFQs are limited instruments that may not include all foods consumed, which therefore may impair quantification of nutri-ent intakes. The participants who could have underreported their energy intake were not excluded from the analyses. However, we used the residual method to adjust the intake of all nutri-ents by energy, obtaining the intake data without the influence of energy.15 Despite these limitations, the study included a
rep-resentative sample and used an appropriate method of analysis. Hence, it showed interesting results regarding the dietary profile and patterns of a CKD population.
CONCLUSION
REFERENCES
1. Levey AS, Schoolwerth AC, Burrows NR, et al. Comprehensive public
health strategies for preventing the development, progression, and
complications of CKD: report of an expert panel convened by Centers
for Disease Control and Prevention. Am J Kidney Dis. 2009;53(3):522-35.
doi: 10.1053/j.ajkd.2008.11.019.
2. James MT, Hemmelgarn BR, Tonelli M. Early recognition and prevention
of chronic kidney disease. Lancet. 2010;375(9722):1296-309. doi:
10.1016/S0140-6736(09)62004-3.
3. Jha V, Garcia-Garcia G, Iseki K, et al. Chronic kidney disease: global
dimension and perspectives. Lancet. 2013;382(9888):260-72. doi:
10.1016/S0140-6736(13)60687-X.
4. Snelson M, Clarke RE, Coughlan MT. Stirring the pot: can dietary
modification alleviate the burden of CKD? Nutrients. 2017;9(3).pii:E265.
doi: 10.3390/nu9030265.
5. Beto JA, Ramirez WE, Bansal VK. Medical nutrition therapy in adults
with chronic kidney disease: integrating evidence and consensus into
practice for the generalist registered dietitian nutritionist. J Acad Nutr
Diet. 2014;114(7):1077-87. doi: 10.1016/j.jand.2013.12.009.
6. Mitch WE, Remuzzi G. Diets for patients with chronic kidney disease,
should we reconsider? BMC Nephrol. 2016;17(1):80. doi: 10.1186/
s12882-016-0283-x.
7. Chan M, Kelly J, Tapsell L. Dietary Modeling of Foods for Advanced
CKD Based on General Healthy Eating Guidelines: What Should Be
on the Plate? Am J Kidney Dis. 2017;69(3):436-50. doi: 10.1053/j.
ajkd.2016.09.025.
8. Goraya N, Wesson DE. Dietary interventions to improve outcomes in
chronic kidney disease. Curr Opin Nephrol Hypertens.
2015;24(6):505-10. doi: 2015;24(6):505-10.1097/MNH.0000000000000160.
9. Domingos MAM, Goulart AC, Lotufo PA, Benseñor IJM, Titan SMO.
Chronic kidney disease - determinants of progression and cardiovascular
risk. PROGREDIR cohort study: design and methods. São Paulo Med J.
2017;135(2):133-9. doi: 10.1590/1516-3180.2016.0272261116.
10. Levey AS, Stevens LA, Schmid CH, et al. A new equation to estimate
glomerular filtration rate. Ann Intern Med. 2009;150(9):604-12. PMID:
19414839.
11. Molina M del C, Benseñor IM, Cardoso L de O, et al. Reprodutibilidade
e validade relativa do Questionário de Frequência Alimentar
do ELSA-Brasil [Reproducibility and relative validity of the Food
Frequency Questionnaire used in the ELSA-Brasil]. Cad Saúde Pública.
2013;29(2):379-89. PMID: 23459823.
12. United States Department of Agriculture [Internet]. Agricultural Research
Service. USDA Food Composition Databases [cited 2016 May 17]. Available
from: https://ndb.nal.usda.gov/ndb/. Accessed in 2017 (Dec 15).
13. Núcleo de Estudos e Pesquisas em Alimentação, Universidade Estadual
de Campinas. Tabela Brasileira de Composição de Alimentos. 4a ed.
Campinas: NEPA-UNICAMP; 2011. Available from: http://www.cfn.org.
br/wp-content/uploads/2017/03/taco_4_edicao_ampliada_e_revisada.
pdf. Accessed in 2017 (Dec 15).
14. Willett WC. Nutritional epidemiology. New York: Oxford University Press;
1998. ISBN-13: 978-0195045017/ISBN-10: 0195045017.
15. Willett W, Stampfer MJ. Total energy intake: implications for epidemiologic
analyses. Am J Epidemiol. 1986;124(1):17-27. PMID: 3521261.
16. Clinical practice guidelines for nutrition in chronic renal failure. K/
DOQI, National Kidney Foundation. Am J Kidney Dis. 2000;35(6 Suppl
2):S1-140. PMID: 10895784.
17. Hu FB. Dietary pattern analysis: a new direction in nutritional
epidemiology. Curr Opin Lipidol. 2002;13(1):3-9. PMID: 11790957.
18. Avesani CM, Kamimura MA, Draibe AS, Cuppari L. Is energy intake
underestimated in nondialyzed chronic kidney disease patients? J Ren
Nutr. 2005;15(1):159-65. PMID: 15648027.
19. Ellam T, Fotheringham J, Kawar B. Differential scaling of glomerular
filtration rate and ingested metabolic burden: implications for gender
differences in chronic kidney disease outcomes. Nephrol Dial Transplant.
2014;29(6):1186-94. doi: 10.1093/ndt/gft466.
20. Kalantar-Zadeh K, Moore LW, Tortorici AR, et al. North American experience
with low protein diet for non-dialysis-dependent chronic kidney disease.
BMC Nephrol. 2016;17(1):90. doi: 10.1186/s12882-016-0304-9.
21. Mafra D, Leal VO. A practical approach to a low protein diet in Brazil.
BMC Nephrol. 2016;17(1):105. doi: 10.1186/s12882-016-0305-8.
22. Bellizzi V, Cupisti A, Locatelli F, et al. Low-protein diets for chronic kidney
disease patients: the Italian experience. BMC Nephrol. 2016;17(1):77.
doi: 10.1186/s12882-016-0280-0.
23. Carrero JJ, Stenvinkel P, Cuppari L, et al. Etiology of the protein-energy
wasting syndrome in chronic kidney disease: a consensus statement
from the International Society of Renal Nutrition and Metabolism
(ISRNM). J Ren Nutr. 2013;23(2):77-90. doi: 10.1053/j.jrn.2013.01.001.
24. Huang MC, Chen ME, Hung HC, et al. Inadequate energy and excess protein
intakes may be associated with worsening renal function in chronic kidney
disease. J Ren Nutr. 2008;18(2):187-94. doi: 10.1053/j.jrn.2007.08.003.
25. Fávaro DIT, Mafra D, Maihara VA, et al. Evaluation of Zn and Fe in
diets of patients with chronic renal failure. J Radioanal Nucl Chem.
2004;259(3):533-6. doi:10.1023/B:JRNC.0000020932.60770.f8.
26. Włodarek D, Głąbska D, Rojek-Trębicka J. Assessment of diet in chronic
kidney disease female predialysis patients. Ann Agric Environ Med.
2014;21(4):829-34. doi: 10.5604/12321966.1129942.
27. Kopple JD. Nutritional management of nondialyzed patients with chronic
renal failure. In: Kopple JD, Massry SG, editors. Nutritional management
of renal disease. 2nd ed. Philadelphia: Lippincott Williams & Wilkins; 2004.
p. 379-414. ISBN-13: 978-0781735940/ISBN-10: 0781735947.
28. Toledo AL, Koifman RJ, Koifman S, Marchioni DM. Dietary patterns
and risk of oral and pharyngeal cancer: a case-control study in Rio de
Janeiro, Brazil. Cad Saúde Pública. 2010;26(1):135-42. PMID: 20209217.
29. Moreira PL, Corrente JE, Villas Boas PJF, Ferreira ALA. Padrões alimentares
associados com obesidade geral e central em idosos residentes em
uma cidade brasileira [Dietary patterns are associated with general
and central obesity in elderly living in a Brazilian city]. Rev Assoc Med
30. Vilela AA, Sichieri R, Pereira RA, et al. Dietary patterns associated with
anthropometric indicators of abdominal fat in adults. Cad Saúde Pública.
2014;30(3):502-10. PMID: 24714940.
31. Olinto MTA. Padrões alimentares: análise de componentes principais. In:
Kac G, Sichieri R, Gigante DP, organizers. Epidemiologia nutricional. Rio
de Janeiro: FIOCRUZ/Atheneu; 2007. p. 213-25. ISBN 978-85-7541-320-3.
32. Ferreira PM, Papini SJ, Corrente JE. Diversity of eating patterns in older
adults: A new scenario? Rev Nutr. 2014;27(1):67-79.
doi:10.1590/1415-52732014000100007.
33. Marchioni DM, Latorre M do R, Eluf-Neto J, Wünsch-Filho V, Fisberg
RM. Identification of dietary patterns using factor analysis in an
epidemiological study in São Paulo. São Paulo Med J. 2005;123(3):124-7.
doi: /S1516-31802005000300007.
34. Cardoso L de O, Carvalho MS, Cruz OG, et al. Eating patterns in the
Brazilian Longitudinal Study of Adult Health (ELSA-Brasil): an exploratory
analysis. Cad Saúde Pública. 2016;32(5):e00066215. doi:
10.1590/0102-311X00066215.
35. Gutiérrez OM, Muntner P, Rizk DV, et al. Dietary patterns and risk of
death and progression to ESRD in individuals with CKD: a cohort study.
Am J Kidney Dis. 2014;64(2):204-13. doi: 10.1053/j.ajkd.2014.02.013.
36. Kelly JT, Palmer SC, Wai SN, et al. Healthy Dietary Patterns and Risk of
Mortality and ESRD in CKD: A Meta-Analysis of Cohort Studies. Clin J
Am Soc Nephrol. 2017;12(2):272-9. doi: 10.2215/CJN.06190616.
37. Lin J, Fung TT, Hu FB, Curhan GC. Association of dietary patterns with
albuminuria and kidney function decline in older white women: a
subgroup analysis from the Nurses’ Health Study. Am J Kidney Dis.
2011;57(2):245-54. doi: 10.1053/j.ajkd.2010.09.027.
38. Huang X, Jiménez-Moleón JJ, Lindholm B, et al. Mediterranean diet,
kidney function, and mortality in men with CKD. Clin J Am Soc Nephrol.
2013;8(9):1548-55. doi: 10.2215/CJN.01780213.
Sources of funding: The study received funding from the Fundação
de Apoio à Pesquisa do Estado de São Paulo (FAPESP) (procedural no.
11/17341-0). The corresponding author receives financial support from
Coordenação de Aperfeiçoamento de Pessoal de Nível Superior (CAPES)
(procedural no. 1524617). The PROGREDIR study used the structure
of the research center for the Brazilian Longitudinal Study of Adult
Health (ELSA-Brasil), in São Paulo, which was supported by the Brazilian
Ministry of Health (Science and Technology Department) and the
Brazilian Ministry of Science and Technology (Financiadora de Estudos e
Projetos, FINEP; and Conselho Nacional de Desenvolvimento Científico e
Tecnológico, CNPq) (procedural no. 01 06 0115.00 SP)
Conflict of interest: None
Date of first submission: June 7, 2017
Last received: November 21, 2017
Accepted: December 14, 2017
Address for correspondence:
Alisson Diego Machado
Hospital das Clínicas, Faculdade de Medicina, Universidade de São Paulo
Av. Doutor Enéas de Carvalho Aguiar, 255 - sala 7.115
Cerqueira César — São Paulo (SP) — Brasil
CEP 05403-000
Tel. (+55 11) 2661-7629
E-mail: alissondiegomachado@hotmail.com