IntroductIon
Obstructive sleep apnea (OSA) is a major disease, affecting at least 2% of women and 4% of men, worldwide. (1) It is a sleep-related breathing disorder, characterized by recurrent upper-airway obstruction during sleep, resulting in a cycle of hypoxemia, increased respiratory effort, and frequent arousals, obesity being the most common known risk factor.(2) Recent data show that in the 2011-2012 period, the prevalence of obesity in the United States was 16.9% in juveniles and 34.9% in adults.(3) Obesity is a chronic disease that has become epidemic in the United States and worldwide; it is also a major risk factor for various disorders, including OSA. (4) In addition, over the last several decades, the criteria used in order to determine the prevalence of OSA have been redeined,(5) primarily because the prevalence of obesity continues to increase,(3) which in turn increases that of OSA.
In most cases, bariatric surgery results in dramatic weight loss and signiicant improvement in the indices of sleep-disordered breathing.(4) In addition, OSA is underdiagnosed in a signiicant proportion of obese patients
undergoing bariatric surgery.(6-10) Most bariatric surgery programs now employ routine screening for OSA in all patients, regardless of whether or not they have sleep complaints, because most cases of OSA were previously not being diagnosed before the surgical procedure.(11) Bariatric surgery lowers body weight markedly and reduces the severity of comorbidities associated with obesity, as well as reducing that of OSA.(12,13) Worldwide, the accepted criteria for bariatric surgery include the following(14,15): being 18-65 years of age and having a BMI ≥ 40 kg/m2 or ≥ 35 kg/m2 and having any obesity-related comorbidity (resistant hypertension, established heart disease, severe degenerative osteoarthritis, or respiratory failure). Although the exact pathophysiology of OSA in obese patients remains poorly understood, it is thought that the deposition of fatty tissue in the neck narrows the lumen of the upper airway, thereby inducing its collapse.(4,15)
The population of Brazil comprises a number of different ethnic, racial, and socioeconomic groups. Because of the considerable degree of miscegenation in the country, it is useful to identify the main clinical variables evaluated AbstrAct
Objective: To identify the main predictive factors for obtaining a diagnosis of obstructive sleep apnea (OSA) in patients awaiting bariatric surgery. Methods: Retrospective study of consecutive patients undergoing pre-operative evaluation for bariatric surgery and referred for in-laboratory polysomnography. Eight variables were evaluated: sex, age, neck circumference (NC), BMI, Epworth Sleepiness Scale (ESS) score, snoring, observed apnea, and hypertension. We employed ROC curve analysis to determine the best cut-off value for each variable and multiple linear regression to identify independent predictors of OSA severity. Results: We evaluated 1,089 patients, of whom 781 (71.7%) were female. The overall prevalence of OSA—deined as an apnea/hypopnea index (AHI) ≥ 5.0 events/h—was 74.8%. The best cut-off values for NC, BMI, age, and ESS score were 42 cm, 42 kg/m2, 37 years, and 10 points, respectively. All eight variables were found to be independent predictors of a diagnosis of OSA in general, and all but one were found to be independent predictors of a diagnosis of moderate/severe OSA (AHI ≥ 15.0 events/h), the exception being hypertension. We devised a 6-item model, designated the NO-OSAS model (NC, Obesity, Observed apnea, Snoring, Age, and Sex), with a cut-off value of ≥ 3 for identifying high-risk patients. For a diagnosis of moderate/severe OSA, the model showed 70.8% accuracy, 82.8% sensitivity, and 57.9% speciicity. Conclusions: In our sample of patients awaiting bariatric surgery, there was a high prevalence of OSA. At a cut-off value of ≥ 3, the proposed 6-item model showed good accuracy for a diagnosis of moderate/severe OSA.
Keywords: Polysomnography; Sleep apnea, obstructive; Bariatric surgery.
Factors predictive of obstructive sleep
apnea in patients undergoing pre-operative
evaluation for bariatric surgery and referred
to a sleep laboratory for polysomnography
Ricardo Luiz de Menezes Duarte1,2, Flavio José Magalhães-da-Silveira1
Correspondence to:
Ricardo L. M. Duarte. Sleep – Laboratório de Estudo dos Distúrbios do Sono, Centro Médico BarraShopping, Avenida das Américas, 4666, sala 309, Barra da Tijuca, CEP 22649-900. Rio de Janeiro, RJ, Brasil.
Tel.: 55 21 2430-9222. Fax: 55 21 2430-9220. E-mail: [email protected] Financial support: None.
1. Sleep – Laboratório de Estudo dos Distúrbios do Sono, Centro Médico
BarraShopping, Rio de Janeiro, Brasil. 2. Instituto de Doenças do Tórax,
Universidade Federal do Rio de Janeiro, Rio de Janeiro, Brasil.
Submitted: 12 February 2015. Accepted: 18 May 2015.
in making a diagnosis of OSA in patients belonging to those various groups. Although various studies have shown that OSA is quite prevalent among bariatric surgery patients, there is still a lack of data regarding the main clinical predictors of OSA in such patients, especially for those in Brazil.
Methods
This was a retrospective analysis of a prospectively maintained database. We analyzed data related to consecutive outpatients undergoing pre-operative evaluation for bariatric surgery between January of 2010 and October of 2014, all of whom were referred to our sleep laboratory for polysomnography, regardless of whether or not they had complained of sleep-related respiratory disturbances. Patients were referred by their respective attending physicians. All demographic and polysomnographic data were collected at our sleep laboratory. The inclusion criteria were being 18-65 years of age, being obese (BMI ≥ 35.0 kg/m2), and not having been previously diagnosed with OSA. Patients for whom clinical data were missing were excluded, as were those with a total sleep time (TST) of < 3 h and those in whom portable sleep studies had been used for the diagnosis of OSA. Additional informed consent was not obtained for this study, because there was no intervention. The study was approved by the Research Ethics Committee of the Federal University of Rio de Janeiro (Protocol no. 666.608/2014).
Data collection
All studies were conducted in the Sleep Laboratory of the BarraShopping Medical Center, located in the city of Rio de Janeiro, Brazil, a relatively large sleep laboratory with 18 beds, sleep technicians, and two board-certiied sleep physicians. The variables evaluated included sex, age, BMI, neck circumference (NC), snoring, observed apnea, hypertension, and degree of daytime sleepiness, as determined by the Epworth Sleepiness Scale (ESS).(16,17) On the evening of the polysomnography, all demographic variables were collected by qualiied skilled sleep laboratory technicians. The BMI was calculated as weight in kilograms divided by height in meters squared, and NC measurements were taken at the level of the cricoid membrane with the patients in the supine position. The study population was stratiied into four categories, by BMI: 35.0-39.9 kg/m2; 40.0-49.9 kg/m2; 50.0-59.9 kg/m2; and ≥ 60.0 kg/m2. Subjects with an arterial blood pressure ≥ 140/90 mmHg were classiied as having systemic arterial hypertension, as were those being treated with antihypertensive medication. Self-reported snoring and observed apnea were evaluated as dichotomous (yes/no) variables.
All patients underwent one-night, in-laboratory polysomnography, performed with a digital system (EMBLA® S7000; Embla Systems, Inc., Broomield, CO, USA), consisting of continuous polygraphic recording from surface leads (for electroencephalography, electrooculography, electromyography of the chin/
legs, and electrocardiography), thermistors (for nasal/ oral airlow), thoracic/abdominal impedance belts (for respiratory effort), and position sensors (for sleep position), together with pulse oximetry (for SpO2) and audio recording via a tracheal microphone (for snoring). Polysomnographic recordings were scored manually and were interpreted by an experienced sleep physician in accordance with established guidelines.(18-20) The data interpreted included TST, sleep eficiency, sleep stages, rapid eye movement (REM) latency, sleep latency, arousals, apnea/hypopnea index (AHI), and SpO2.
Sleep stages were scored based on established criteria. (18) Arousals were deined as episodes lasting ≥ 3 s in which there was a return of alpha activity associated with an increase in electromyographic activity. An apnea event was deined as a ≥ 10 s cessation of oronasal airlow. A hypopnea event was deined as a ≥ 30% reduction in the nasal pressure signal accompanied by ≥ 4% desaturation that lasted for > 10 s.(18) The AHI was deined as the sum of the apnea and hypopnea events per hour of sleep. The diagnosis of OSA was based on an AHI ≥ 5.0 events/h, and OSA severity was categorized on the basis of the AHI(18): mild (5.0-14.9 events/h); moderate (15.0-29.9 events/h); or severe (≥ 30.0 events/h).
Statistical analysis
Statistical analysis was performed with the Statistical Package for the Social Sciences, version 17.0 for Windows (SPSS Inc., Chicago, IL, USA). Continuous data are reported as mean ± standard deviation, whereas categorical data are reported as percentages of the total population. Comparisons between groups were performed with the chi-square test for dichotomous variables, Student’s t-test for normally distributed continuous variables, and the Mann-Whitney U-test for non-normally distributed continuous variables. Correlations between continuous variables were evaluated by Spearman’s rank correlation coeficient (rs). For each continuous variable, we used a ROC curve, calculating the area under the curve (AUC) to obtain the cut-off value for use in the univariate and multivariate analyses. Univariate and multivariate tests were used in order to calculate the odds ratios and the corresponding 95% conidence intervals. Using 2 × 2 contingency tables, we calculated the following parameters for all variables: sensitivity, speciicity, positive predictive value, negative predictive value, and accuracy. We constructed predictive models using the main independent variables obtained for an AHI ≥ 15.0 events/h, aiming to optimize the screening for moderate/severe OSA in bariatric surgery patients. The best predictive model was selected according to the ROC curves. All tests were two-sided, and values of p < 0.05 were considered statistically signiicant.
results
1,480 patients, 391 were subsequently excluded: 308 because of missing data; 30 because they had been the subjects of home sleep studies; 28 because they had a TST of < 3 h; and 25 because they had previously been diagnosed with OSA. Therefore, 1,089 patients, of whom 781 (71.7%) were female and 308 (28.3%) were male, were considered eligible for further analysis. Demographic and polysomnographic characteristics of those 1,089 subjects are listed in Table 1. The overall prevalence of OSA was 74.8%, and the prevalence of moderate/severe OSA was 52.0%. In comparison with the females, the males were younger (p = 0.080), had higher BMIs (p < 0.001), and had larger NCs (p < 0.001). In terms of the prevalence of excessive daytime sleepiness (ESS score ≥ 10), the difference between males and females did not reach statistical signiicance (p = 0.122). The severity of OSA was greater in males than in females, as was the prevalence of moderate/severe OSA (84.7% vs. 39.1%) and severe OSA (68.5% vs. 18.6%), the last two being statistically signiicant differences (p < 0.001 for both). The continuous variables (NC, BMI, age, and ESS score) were correlated with the AHI (rs = 0.500, rs = 0.308, rs = 0.247, and rs = 0.156, respectively; p < 0.001 for all).
Table 2 shows the differences among the various BMI categories, in relation to demographic, clinical, and polysomnographic variables. As BMI increased, there were statistically signiicant increases in the proportion of males, as well as in the proportions of subjects with hypertension, snoring, and observed apnea. In addition, NC and the ESS score increased in parallel with increases in BMI, although no such association was observed between age and BMI category (p = 0.607). Arousals and the AHI also increased progressively in parallel with increases in BMI, as did the numbers of apnea and hypopnea events per hour when calculated separately (p < 0.001 for all). Similarly, SpO2 values worsened in parallel with increases in BMI (p < 0.001 for baseline, mean, and lowest SpO2). As expected, there were linear increases in the prevalence of OSA, especially that of the severe form of the disease, corresponding to increases in the BMI: 253 (66.4%) of the 381 patients with a BMI 35.0-39.9 kg/m2 were diagnosed with OSA, 81 (21.3%) of those patients being diagnosed with severe OSA; 460 (77.0%) of the 597 patients with a BMI 40.0-49.9 kg/m2 were diagnosed with OSA, 200 (33.5%) of those patients being diagnosed with severe OSA; 88 (33,7%) of the 98 patients with a BMI 50.0-59.9 kg/m2 were diagnosed with OSA, 65 (66.3%) of those patients being diagnosed with severe OSA; and all 13 of the patients with a BMI ≥ 60.0 kg/m2 were diagnosed with OSA, 10 (76.9%) of those patients being diagnosed with severe OSA.
The ROC curve analyses of the relevant continuous variables yielded the following AUCs: 0.711 (95% CI: 0.679-0.744) for NC; 0.657 (95% CI: 0.620-0.694) for age; 0.625 (95% CI: 0.588-0.662) for BMI; and 0.557 (95% CI: 0.519-0.595) for ESS score. In addition, the
ROC curves showed that the best cut-off values for NC, BMI, age, and ESS score (as diagnostic markers of OSA) were 42 cm, 42 kg/m2, 37 years, and 10 points, respectively.
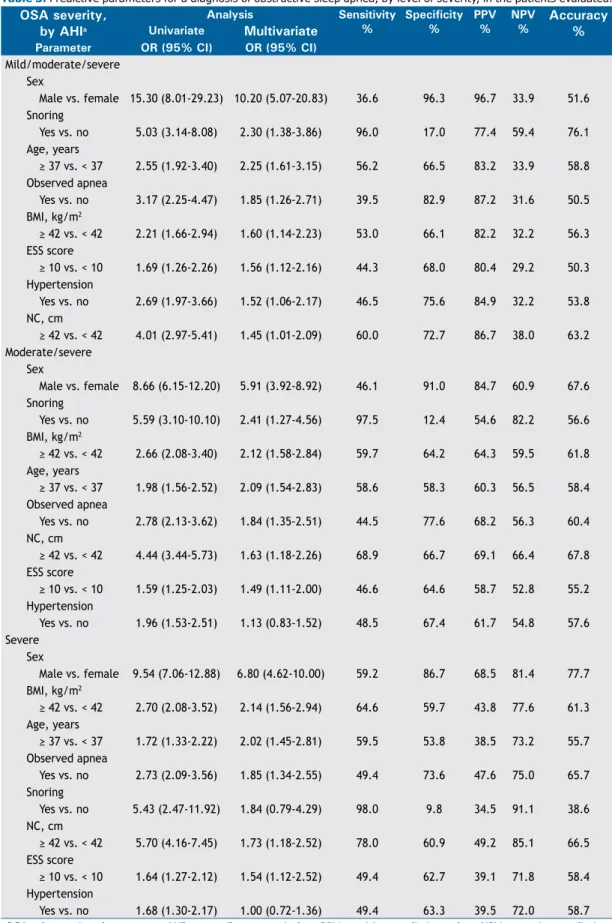
Table 3 shows the univariate and multivariate analyses of the eight variables evaluated in relation to three different AHI cut-off values (5.0 events/h, 15.0 events/h, and 30.0 events/h). All of those variables were thus found to be independent predictors of a diagnosis of OSA in general (AHI ≥ 5.0 events/h). All but one were found to be independent predictors of a diagnosis of moderate/severe OSA (AHI ≥ 15.0 events/h), the exception being hypertension (p = 0.421). All but two were found to be independent predictors of a diagnosis of severe OSA (AHI ≥ 30.0 events/h), the exceptions being hypertension (p = 0.963) and snoring (p = 0.153). The main predictor of a diagnosis of OSA in general was male sex, with an adjusted OR of 10.20 (95% CI: 5.07-20.83), followed by snoring, age ≥ 37 years, observed apnea, BMI ≥ 42 kg/m2, ESS score ≥ 10, hypertension, and NC ≥ 42 cm. The main predictor of a diagnosis of moderate/ severe OSA was also male sex, with an adjusted OR of 5.91 (95% CI: 3.92-8.92), followed by snoring, BMI ≥ 42 kg/m2, age ≥ 37 years, observed apnea, NC ≥ 42 cm, ESS score ≥ 10, and hypertension. The main predictor of a diagnosis of severe OSA was again male sex, with an adjusted OR of 6.80 (95% CI: 4.62-10.00), followed by BMI ≥ 42 kg/m2, age ≥ 37 years, observed apnea, snoring, NC ≥ 42 cm, ESS score ≥ 10, and hypertension.
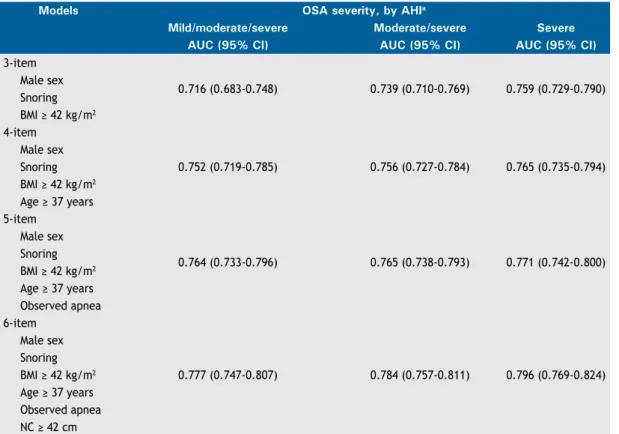
As can be seen in Table 3, there were seven independ-ent variables associated with a diagnosis of moderate/ severe OSA: sex, snoring, BMI, age, observed apnea, NC, and ESS score. Among those variables, ESS score was seventh (i.e., last) in importance. That, together with the fact that the ESS comprises eight questions, prompted us to exclude ESS scores, thus simplifying the models. Therefore, we tested four models (Table 4): a 3-item model including male sex, snoring, and BMI ≥ 42 kg/m2; a 4-item model encompassing the 3-item model plus age ≥ 37 years; a 5-item model encompassing the 4-item model plus observed apnea; and a 6-item model encompassing the 5-item model plus NC ≥ 42 cm. Of the four predictive models evaluated, the one found to be best at predicting OSA in general, moderate/severe OSA, and severe OSA was the 6-item model, which had AUCs of 0.777 (95% CI: 0.747-0.807), 0.784 (95% CI: 0.757-0.811), and 0.796 (95% CI: 0.769-0.824), respectively.
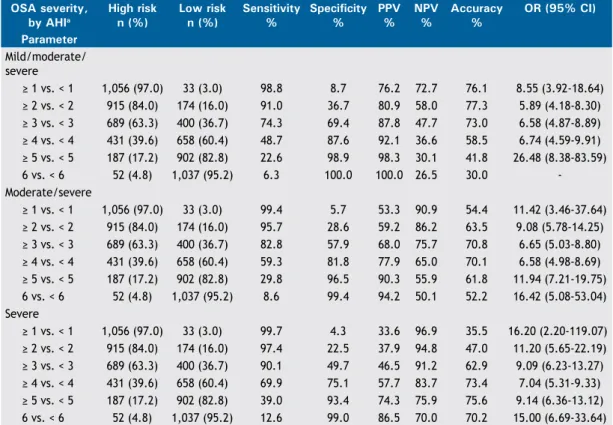
sensitivity and speciicity. For moderate/severe OSA, the best diagnostic performance was obtained at the cut-off value of ≥ 3, which had an accuracy of 70.8%, a sensitivity of 82.8%, and a speciicity of 57.9%. The use of the ≥ 3 cut-off value in the 6-item model showed an accuracy, sensitivity, and speciicity, respectively, of 73.0%, 74.3%, and 69.4% for a diagnosis of OSA in general; 70.8%, 82.8%, and 57.9% for a diagnosis of moderate/severe OSA; and 62.9%, 90.1%, and 49.7% for a diagnosis of severe OSA. After choosing the 6-item model as the best model, we created a mnemonic device for it, designating it the nC ≥ 42
cm, obesity (BMI ≥ 42 kg/m2), observed apnea, snoring, Age ≥ 37 years, and male sex (NO-OSAS)
model. Therefore, this model consists of six yes/no questions (maximum possible total score, 6 points).
dIscussIon
In this study, which involved a large sample of consecutive bariatric surgery patients, we showed that all of the variables evaluated (sex, NC, BMI, age, ESS score, snoring, observed apnea, and hypertension) were independent predictors of the AHI, regardless of the cut-off value used, the only exceptions being hypertension at two of the AHI cut-off values (≥ 15.0 events/h and ≥ 30.0 events/h), and snoring at the AHI cut-off value of ≥ 30.0 events/h. At three different cut-off values (AHI ≥ 5.0 events/h, ≥ 15.0 events/h, table 1. Demographic, clinical, and polysomnographic characteristics of the patients evaluated.a
Characteristic total Females Males p
(N = 1,089) (n = 781) (n = 308) Demographic variable
Age, years 38.1 ± 10.0 38.4 ± 10.1 37.2 ± 9.7 0.080
Clinical variables
BMI, kg/m2 42.8 ± 5.4 42.1 ± 5.0 44.6 ± 5.8 < 0.001
BMI 35.0-39.9 kg/m2, n (%) 381 (35.0) 310 (39.6) 71 (23.0) < 0.001
BMI 40.0-49.9 kg/m2, n (%) 597 (54.8) 416 (53.3) 181 (58.8) < 0.001
BMI 50.0-59.9 kg/m2, n (%) 98 (9.0) 49 (6.3) 49 (15.9) < 0.001
BMI ≥ 60.0 kg/m2, n (%) 13 (1.2) 6 (0.8) 7 (2.3) < 0.001
NC, cm 42.3 ± 4.7 40.3 ± 3.3 47.5 ± 3.6 < 0.001
ESS score, points 8.9 ± 4.5 8.8 ± 4.5 9.2 ± 4.6 0.306
ESS score ≥ 10, n (%) 449 (41.2) 313 (40.1) 136 (44.2) 0.122
Hypertension, n (%) 445 (40.9) 296 (37.9) 149 (48.4) < 0.001
Snoring, n (%) 1,010 (92.7) 704 (90.1) 306 (99.4) < 0.001
Observed apnea, n (%) 369 (33.9) 228 (29.2) 141 (45.8) < 0.001 Polysomnographic variables
Total sleep time, min 337.7 ± 70.0 340.9 ± 69.3 329.5 ± 71.2 0.019
Sleep eficiency, % 77.4 ± 14.9 77.7 ± 14.8 76.6 ± 15.1 0.250
Sleep stage N1, % 4.8 ± 5.9 4.3 ± 4.7 6.3 ± 7.9 < 0.001 Sleep stage N2, % 66.3 ± 12.0 64.8 ± 11.6 70.2 ± 12.2 < 0.001 Sleep stage N3, % 12.7 ± 9.1 14.1 ± 9.0 9.2 ± 8.6 < 0.001 Sleep stage R, % 15.5 ± 7.8 16.1 ± 7.6 14.0 ± 8.0 < 0.001 Arousals, events/h 29.9 ± 27.7 21.8 ± 21.5 50.5 ± 30.9 < 0.001 Sleep latency, min 41.8 ± 40.4 43.0 ± 39.9 38.7 ± 41.4 0.112 REM latency, min 150.3 ± 81.3 147.7 ± 80.0 157.3 ± 84.5 0.095 AHI, events/h 27.2 ± 29.5 18.1 ± 22.6 50.4 ± 32.2 < 0.001 AI, events/h 12.1 ± 23.4 5.6 ± 14.9 28.6 ± 31.6 < 0.001 HI, events/h 15.1 ± 15.3 12.5 ± 14.1 21.8 ± 16.1 < 0.001 Baseline SpO2, % 95.7 ± 2.1 96.1 ± 2.1 95.0 ± 2.0 < 0.001 Mean SpO2, % 93.7 ± 3.1 94.2 ± 3.0 92.5 ± 3.2 < 0.001 Lowest SpO2, % 81.8 ± 9.1 83.6 ± 8.3 77.3 ± 9.6 < 0.001 Prevalence of OSAb
No OSA, n (%) 275 (25.2) 265 (33.9) 10 (3.3) < 0.001
Mild OSA, n (%) 248 (22.8) 211 (27.0) 37 (12.0) < 0.001
Moderate OSA, n (%) 210 (19.3) 160 (20.5) 50 (16.2) < 0.001
Severe OSA, n (%) 356 (32.7) 145 (18.6) 211 (68.5) < 0.001
NC: neck circumference; ESS: Epworth Sleepiness Scale; REM: rapid eye movement; AHI: apnea/hypopnea index; AI: apnea index; HI: hypopnea index; and OSA: obstructive sleep apnea. aValues expressed as mean ± SD, except
and ≥ 30.0 events/h), the main predictor of a diagnosis of OSA was male sex. The prevalence of moderate/ severe and severe OSA was higher among the males than among the females (p < 0.001). The 6-item NO-OSAS model, at a cut-off value of ≥ 3, showed good diagnostic performance for distinguishing between high-risk patients and low-risk patients, in relation to a diagnosis of OSA, regardless of the degree of severity. In our sample of patients awaiting bariatric surgery, with or without clinical features of suspicion of OSA, the overall prevalence of OSA was high (74.8%), as was the prevalence of severe OSA (32.7%). Our results are consistent with those of previous studies involving bariatric surgery patients, all of which have reported a high (69.9-93.6%) prevalence of OSA(10,11,15,21-27) and a high (21.0-48.0%) proportion of subjects classiied as having the severe form of the disease.(9-11,15,21-25) Our indings indicate that this population differs from the general population of patients with OSA.(1,5) We found that, in comparison with the general population of OSA patients, that of bariatric surgery patients had a greater proportion of females and comprised younger patients. In addition, the prevalence of OSA was much higher in our sample of bariatric surgery patients than in the general population.
In accordance with the indings of previous stud-ies,(11,24) we observed linear increases in the prevalence and severity of OSA in parallel with increases in BMI. In one previous study,(28) the authors identiied 10 variables that were predictive of OSA in bariatric surgery patients: NC, systolic blood pressure, waist/ hip ratio, waist, loud snoring, frequent snoring, weight, BMI, hypertension, and male sex. Using ive or more of these variables it was possible to obtain a model with a sensitivity of 77% and a speciicity of 77% in predicting an AHI ≥ 15.0 events/h.(28)
Using ROC curve analysis, we found the main cut-off values of the continuous variables in our sample to be age ≥ 37 years, BMI ≥ 42 kg/m2, NC ≥ 42 cm, and ESS score ≥ 10. Dixon et al. showed that advanced age, male sex, observed apnea, and severe obesity (especially central obesity) increase the risk of a higher AHI.(29) Those authors also used ROC curve analysis for determining the appropriate cut-off values for continuous variables, which they found to be NC ≥ 43 cm, age ≥ 38 years, and BMI ≥ 45 kg/m2, which are quite similar to the cut-off values identiied in our study. However, those authors included only patients with clinical suspicion of OSA, whereas our sample table 2. Demographic, clinical, and polysomnographic parameters, by BMI category, for the 1,089 patients evaluated.a
Parameter BMi p
35.0-39.9 kg/m2 40.0-49.9 kg/m2 50.0-59.9 kg/m2 ≥ 60.0 kg/m2
(n = 381) (n = 597) (n = 98) (n = 13)
Demographic variables
Male sex, n (%) 71 (18.6) 181 (30.3) 49 (50.0) 7 (53.8) < 0.001 Age, years 38.2 ± 9.9 38.0 ± 10.0 38.4 ± 10.5 34.5 ± 7.9 0.607 Clinical variables
NC, cm 40.2 ± 3.7 42.9 ± 4.4 46.7 ± 5.0 47.6 ± 4.2 < 0.001 BMI, kg/m2 37.8 ± 1.3 43.9 ± 2.7 53.0 ± 2.4 63.4 ± 3.1 < 0.001
ESS score, points 8.7 ± 4.3 8.8 ± 4.6 10.4 ± 4.4 11.0 ± 5.5 0.004
ESS score ≥ 10, n (%) 149 (39.1) 236 (39.5) 57 (58.2) 7 (53.8) 0.003
Hypertension, n (%) 125 (32.8) 263 (44.1) 49 (50.0) 8 (61.5) < 0.001
Snoring, n (%) 340 (89.2) 562 (94.1) 95 (96.9) 13 (100.0) 0.007
Observed apnea, n (%) 108 (28.3) 213 (35.7) 39 (39.8) 9 (69.2) 0.002 Polysomnographic variables
Arousals, events/h 21.8 ± 20.1 30.8 ± 27.8 51.6 ± 33.8 66.3 ± 41.7 < 0.001 AHI, events/h 18.4 ± 21.5 28.1 ± 29.6 51.3 ± 35.6 67.1 ± 43.4 < 0.001 AI, events/h 6.5 ± 14.8 12.6 ± 24.3 27.4 ± 32.3 34.8 ± 39.6 < 0.001 HI, events/h 11.8 ± 12.6 15.4 ± 14.8 22.7 ± 20.2 32.2 ± 25.3 < 0.001 Baseline SpO2, % 96.2 ± 1.7 95.6 ± 2.3 95.1 ± 2.0 94.9 ± 2.5 < 0.001 Mean SpO2, % 94.5 ± 2.5 93.5 ± 3.2 91.9 ± 3.6 90.5 ± 5.1 < 0.001 Lowest SpO2, % 84.6 ± 7.8 81.2 ± 8.9 76.1 ± 10.6 71.7 ± 13.0 < 0.001 Prevalence of OSAb
No OSA, n (%) 128 (33.6) 137 (23.0) 10 (10.2) - < 0.001
Mild OSA, n (%) 111 (29.1) 125 (20.9) 10 (10.2) 2 (15.4) < 0.001 Moderate OSA, n (%) 61 (16.0) 135 (22.6) 13 (13.3) 1 (7.7) < 0.001 Severe OSA, n (%) 81 (21.3) 200 (33.5) 65 (66.3) 10 (76.9) < 0.001
NC: neck circumference; ESS: Epworth Sleepiness Scale; AHI: apnea/hypopnea index; AI: apnea index; HI:
hypopnea index; and OSA: obstructive sleep apnea. aValues expressed as mean ± SD, except where otherwise
table 3. Predictive parameters for a diagnosis of obstructive sleep apnea, by level of severity, in the patients evaluated.
OSA severity, by AHia
Analysis Sensitivity %
Specificity %
PPV %
NPV %
Accuracy % Univariate Multivariate
Parameter OR (95% Ci) OR (95% Ci) Mild/moderate/severe
Sex
Male vs. female 15.30 (8.01-29.23) 10.20 (5.07-20.83) 36.6 96.3 96.7 33.9 51.6 Snoring
Yes vs. no 5.03 (3.14-8.08) 2.30 (1.38-3.86) 96.0 17.0 77.4 59.4 76.1 Age, years
≥ 37 vs. < 37 2.55 (1.92-3.40) 2.25 (1.61-3.15) 56.2 66.5 83.2 33.9 58.8
Observed apnea
Yes vs. no 3.17 (2.25-4.47) 1.85 (1.26-2.71) 39.5 82.9 87.2 31.6 50.5 BMI, kg/m2
≥ 42 vs. < 42 2.21 (1.66-2.94) 1.60 (1.14-2.23) 53.0 66.1 82.2 32.2 56.3
ESS score
≥ 10 vs. < 10 1.69 (1.26-2.26) 1.56 (1.12-2.16) 44.3 68.0 80.4 29.2 50.3
Hypertension
Yes vs. no 2.69 (1.97-3.66) 1.52 (1.06-2.17) 46.5 75.6 84.9 32.2 53.8 NC, cm
≥ 42 vs. < 42 4.01 (2.97-5.41) 1.45 (1.01-2.09) 60.0 72.7 86.7 38.0 63.2
Moderate/severe Sex
Male vs. female 8.66 (6.15-12.20) 5.91 (3.92-8.92) 46.1 91.0 84.7 60.9 67.6 Snoring
Yes vs. no 5.59 (3.10-10.10) 2.41 (1.27-4.56) 97.5 12.4 54.6 82.2 56.6 BMI, kg/m2
≥ 42 vs. < 42 2.66 (2.08-3.40) 2.12 (1.58-2.84) 59.7 64.2 64.3 59.5 61.8
Age, years
≥ 37 vs. < 37 1.98 (1.56-2.52) 2.09 (1.54-2.83) 58.6 58.3 60.3 56.5 58.4
Observed apnea
Yes vs. no 2.78 (2.13-3.62) 1.84 (1.35-2.51) 44.5 77.6 68.2 56.3 60.4 NC, cm
≥ 42 vs. < 42 4.44 (3.44-5.73) 1.63 (1.18-2.26) 68.9 66.7 69.1 66.4 67.8
ESS score
≥ 10 vs. < 10 1.59 (1.25-2.03) 1.49 (1.11-2.00) 46.6 64.6 58.7 52.8 55.2
Hypertension
Yes vs. no 1.96 (1.53-2.51) 1.13 (0.83-1.52) 48.5 67.4 61.7 54.8 57.6 Severe
Sex
Male vs. female 9.54 (7.06-12.88) 6.80 (4.62-10.00) 59.2 86.7 68.5 81.4 77.7 BMI, kg/m2
≥ 42 vs. < 42 2.70 (2.08-3.52) 2.14 (1.56-2.94) 64.6 59.7 43.8 77.6 61.3
Age, years
≥ 37 vs. < 37 1.72 (1.33-2.22) 2.02 (1.45-2.81) 59.5 53.8 38.5 73.2 55.7
Observed apnea
Yes vs. no 2.73 (2.09-3.56) 1.85 (1.34-2.55) 49.4 73.6 47.6 75.0 65.7 Snoring
Yes vs. no 5.43 (2.47-11.92) 1.84 (0.79-4.29) 98.0 9.8 34.5 91.1 38.6 NC, cm
≥ 42 vs. < 42 5.70 (4.16-7.45) 1.73 (1.18-2.52) 78.0 60.9 49.2 85.1 66.5
ESS score
≥ 10 vs. < 10 1.64 (1.27-2.12) 1.54 (1.12-2.52) 49.4 62.7 39.1 71.8 58.4
Hypertension
Yes vs. no 1.68 (1.30-2.17) 1.00 (0.72-1.36) 49.4 63.3 39.5 72.0 58.7
OSA: obstructive sleep apnea; AHI: apnea/hypopnea index; PPV: positive predictive value; NPV: negative predictive
included all patients awaiting bariatric surgery, with or without symptoms of OSA.
In the present study, there were signiicant differences between males and females: males had higher BMIs and higher NCs, as well as a higher prevalence of hypertension, snoring, and observed apnea. In addition, males had higher AHIs, lower nadir SpO2 values, higher arousal indices, together with a higher prevalence of moderate/severe and severe OSA. These differences between sexes have also been reported in some other studies of bariatric surgery patients.(9-11,13,15,21-23,25,30)
Patients awaiting bariatric surgery should be screened for OSA to decrease the occurrence of peri-and post-op-erative complications. Bariatric surgery is the most effective weight loss therapy for morbidly obese patients; it improves OSA in most patients and has a relatively low mortality rate.(4) Due to the high prevalence of OSA, especially of the severe forms, previous studies(6,11,23,26) have underscored the need for polysomnography in all patients awaiting bariatric surgery, regardless of the presence or absence of symptoms of OSA.
Our study has some limitations. Patient selection occurred retrospectively in a sleep laboratory, which increased the possibility of selection bias. In addition, this was a single-center study, and the implications of our indings for the general population might therefore be limited. Furthermore, we did not evaluate
comorbidities (other than hypertension) or other sleep complaints such as nocturia, nasal symptoms, morning headaches, and nocturnal choking or gasping. Moreover, data regarding regional obesity (waist circumference, hip circumference, neck-to-waist ratio, or waist-to-hip ratio) were not available. Conversely, our study has certain strengths. First, it involved a large sample of consecutive patients, all of whom were evaluated with full polysomnography at a sleep center, regardless of whether or not they had sleep complaints. In addition, the medical charts of the patients included in our inal sample contained complete information about all eight of the variables of interest. Furthermore, the possibility of confounding was reduced in the analysis by the use of a multivariate logistic model including all variables with a p-value < 0.05. Therefore, we believe that the limitations of the study were outweighed by its strengths and did not affect the interpretation of the results.
In conclusion, our indings suggest that, among patients awaiting bariatric surgery, there is a high prevalence of OSA in general and of moderate/severe OSA. Our data also indicate that the variables sex, age, NC, BMI, ESS score, snoring, observed apnea, and hypertension can be used in order to conirm the suspicion of OSA and to assess its severity. The 6-item NO-OSAS model, at a cut-off value ≥ 3 to identify high-risk patients, showed good diagnostic accuracy for OSA in general, as well as for moderate/ table 4. ROC curves for the models evaluated, by the level of severity of obstructive sleep apnea.
Models OSA severity, by AHia
Mild/moderate/severe Moderate/severe Severe
AUC (95% Ci) AUC (95% Ci) AUC (95% Ci)
3-item
0.716 (0.683-0.748) 0.739 (0.710-0.769) 0.759 (0.729-0.790) Male sex
Snoring
BMI ≥ 42 kg/m2
4-item
0.752 (0.719-0.785) 0.756 (0.727-0.784) 0.765 (0.735-0.794) Male sex
Snoring
BMI ≥ 42 kg/m2
Age ≥ 37 years
5-item
0.764 (0.733-0.796) 0.765 (0.738-0.793) 0.771 (0.742-0.800) Male sex
Snoring
BMI ≥ 42 kg/m2
Age ≥ 37 years
Observed apnea 6-item
0.777 (0.747-0.807) 0.784 (0.757-0.811) 0.796 (0.769-0.824) Male sex
Snoring
BMI ≥ 42 kg/m2
Age ≥ 37 years
Observed apnea
NC ≥ 42 cm
severe and severe OSA. Further studies, especially prospective ones, are necessary to validate the use
of the NO-OSAS model as a means of screening for OSA in bariatric surgery patients.
table 5. Predictive parameters of the 6-item model in relation to the level of severity of obstructive sleep apnea.
OSA severity, by AHia
High risk n (%)
low risk n (%)
Sensitivity %
Specificity %
PPV %
NPV %
Accuracy %
OR (95% Ci)
Parameter Mild/moderate/ severe
≥ 1 vs. < 1 1,056 (97.0) 33 (3.0) 98.8 8.7 76.2 72.7 76.1 8.55 (3.92-18.64)
≥ 2 vs. < 2 915 (84.0) 174 (16.0) 91.0 36.7 80.9 58.0 77.3 5.89 (4.18-8.30)
≥ 3 vs. < 3 689 (63.3) 400 (36.7) 74.3 69.4 87.8 47.7 73.0 6.58 (4.87-8.89)
≥ 4 vs. < 4 431 (39.6) 658 (60.4) 48.7 87.6 92.1 36.6 58.5 6.74 (4.59-9.91)
≥ 5 vs. < 5 187 (17.2) 902 (82.8) 22.6 98.9 98.3 30.1 41.8 26.48 (8.38-83.59)
6 vs. < 6 52 (4.8) 1,037 (95.2) 6.3 100.0 100.0 26.5 30.0 -Moderate/severe
≥ 1 vs. < 1 1,056 (97.0) 33 (3.0) 99.4 5.7 53.3 90.9 54.4 11.42 (3.46-37.64)
≥ 2 vs. < 2 915 (84.0) 174 (16.0) 95.7 28.6 59.2 86.2 63.5 9.08 (5.78-14.25)
≥ 3 vs. < 3 689 (63.3) 400 (36.7) 82.8 57.9 68.0 75.7 70.8 6.65 (5.03-8.80)
≥ 4 vs. < 4 431 (39.6) 658 (60.4) 59.3 81.8 77.9 65.0 70.1 6.58 (4.98-8.69)
≥ 5 vs. < 5 187 (17.2) 902 (82.8) 29.8 96.5 90.3 55.9 61.8 11.94 (7.21-19.75)
6 vs. < 6 52 (4.8) 1,037 (95.2) 8.6 99.4 94.2 50.1 52.2 16.42 (5.08-53.04) Severe
≥ 1 vs. < 1 1,056 (97.0) 33 (3.0) 99.7 4.3 33.6 96.9 35.5 16.20 (2.20-119.07)
≥ 2 vs. < 2 915 (84.0) 174 (16.0) 97.4 22.5 37.9 94.8 47.0 11.20 (5.65-22.19)
≥ 3 vs. < 3 689 (63.3) 400 (36.7) 90.1 49.7 46.5 91.2 62.9 9.09 (6.23-13.27)
≥ 4 vs. < 4 431 (39.6) 658 (60.4) 69.9 75.1 57.7 83.7 73.4 7.04 (5.31-9.33)
≥ 5 vs. < 5 187 (17.2) 902 (82.8) 39.0 93.4 74.3 75.9 75.6 9.14 (6.36-13.12)
6 vs. < 6 52 (4.8) 1,037 (95.2) 12.6 99.0 86.5 70.0 70.2 15.00 (6.69-33.64)
OSA: obstructive sleep apnea; AHI: apnea/hypopnea index; PPV: positive predictive value; and NPV: negative
predictive value. aMild/moderate/severe = AHI ≥ 5.0 events/h; moderate/severe = AHI ≥ 15.0 events/h; and severe = AHI ≥ 30.0 events/h.
references
1. Young T, Peppard PE, Gottlieb DJ. Epidemiology of obstructive sleep
apnea: a population health perspective. Am J Respir Crit Care Med. 2002;165(9):1217-39. http://dx.doi.org/10.1164/rccm.2109080
2. Peppard PE, Young T, Palta M, Dempsey J, Skatrud J. Longitudinal study of moderate weight change and sleep-disordered breathing.
JAMA. 2000;284(23):3015-21. http://dx.doi.org/10.1001/ jama.284.23.3015
3. Ogden CL, Carroll MD, Kit BK, Flegal KM. Prevalence of childhood
and adult obesity in the United States, 2011-2012. JAMA. 2014;311(8):806-14. http://dx.doi.org/10.1001/jama.2014.732 4. Shah N, Roux F. The relationship of obesity and obstructive
sleep apnea. Clin Chest Med. 2009;30(3):455-65. http://dx.doi. org/10.1016/j.ccm.2009.05.012
5. Tuik S, Santos-Silva R, Taddei JA, Bittencourt LR. Obstructive
sleep apnea syndrome in the Sao Paulo Epidemiologic Sleep
Study. Sleep Med. 2010;11(5):441-6. http://dx.doi.org/10.1016/j.
sleep.2009.10.005
6. Rasmussen JJ, Fuller WD, Ali MR. Sleep apnea syndrome is signiicantly underdiagnosed in bariatric surgical patients. Surg Obes Relat Dis. 2012;8(5):569-73. http://dx.doi.org/10.1016/j.
soard.2011.06.021
7. Carneiro G, Flório RT, Zanella MT, Pradella-Hallinan M, Ribeiro-Filho FF, Tuik S, et al. Is mandatory screening for obstructive sleep apnea
with polysomnography in all severely obese patients indicated?
Sleep Breath. 2012;16(1):163-8. http://dx.doi.org/10.1007/s11325-010-0468-7
8. Nepomnayshy D, Hesham W, Erikson B, MacDonald J, Iorio R, Brams D. Sleep apnea: is routine preoperative screening necessary?
Obes Surg. 2013;23(3):287-91.
http://dx.doi.org/10.1007/s11695-012-0806-x
9. Yeh PS, Lee YC, Lee WJ, Chen SB, Ho SJ, Peng WB, et al. Clinical predictors of obstructive sleep apnea in Asian bariatric patients. Obes
Surg. 2010;20(1):30-5. http://dx.doi.org/10.1007/s11695-009-9854-2
10. Farinholt GN, Carr AD, Chang EJ, Ali MR. A call to arms: obese men with more severe comorbid disease and underutilization of
bariatric operations. Surg Endosc. 2013:27(12):4556-63. http://dx.doi. org/10.1007/s00464-013-3122-1
11. O’Keeffe T, Patterson EJ. Evidence supporting routine polysomnography before bariatric surgery. Obes Surg. 2004;14(1):23-6. http://dx.doi.org/10.1381/096089204772787248
12. Buchwald H, Avidor Y, Braunwald E, Jensen MD, Pories W, Fahrbach K, et al. Bariatric surgery: a systematic review and meta-analysis. JAMA. 2004;292(14):1724-37. http://dx.doi.org/10.1001/ jama.292.14.1724
13. Mostaedi R, Lackey DE, Adams SH, Dada SA, Hoda ZA, Ali MR.
Prevalence of undiagnosed and inadequately treated type 2 diabetes mellitus, hypertension, and dyslipidemia in morbidly obese patients
who present for bariatric surgery. Obes Surg. 2014;24(6):927-35. http://dx.doi.org/10.1007/s11695-014-1196-z
14. Gasa M, Salord N, Fortuna AM, Mayos M, Vilarrasa N, Dorca J, et al. Obstructive sleep apnoea and metabolic impairment in severe obesity. Eur Respir J. 2011:38(5):1089-97. http://dx.doi. org/10.1183/09031936.00198810
15. Ravesloot MJ, van Maanen JP, Hilgevoord AA, van Wagensveld
BA, de Vries N. Obstructive sleep apnea is underrecognized and
underdiagnosed in patients undergoing bariatric surgery. Eur Arch
Otorhinolaryngol. 2012;269(7):1865-71. http://dx.doi.org/10.1007/ s00405-012-1948-0
17. Bertolazi AN, Fagondes SC, Hoff LS, Pedro VD, Menna Barreto SS, Johns MW. Portuguese-language version of the Epworth sleepiness scale: validation for use in Brazil. J Bras Pneumol. 2009;35(9):877-83. http://dx.doi.org/10.1590/S1806-37132009000900009
18. Iber C, Ancoli-Israel S, Chesson Jr AL, Quan SF. The AASM manual for the scoring of sleep and associated events: rules, terminology
and technical speciications. Westchester, IL: American Academy of
Sleep Medicine; 2007.
19. Silber MH, Ancoli-Israel S, Bonnet MH, Chokroverty S, Grigg-Damberger MM, Hirshkowitz M, et al. The visual scoring of sleep in adults. J Clin Sleep Med. 2007;3(2):121-31.
20. Kushida CA, Littner MR, Morgenthaler T, Alessi CA, Bailey D,
Coleman J Jr, et al. Practice parameters for the indications for
polysomnography and related procedures: an update for 2005.
Sleep. 2005;28(4):499-521.
21. Frey WC, Pilcher J. Obstructive sleep-related breathing disorders in
patients evaluated for bariatric surgery. Obes Surg.
2003:13(5):676-83. http://dx.doi.org/10.1381/096089203322509228
22. Daltro C, Gregorio PB, Alves E, Abreu M, Bomim D, Chicourel MH, et al. Prevalence and severity of sleep apnea in a group of morbidly
obese patients. Obes Surg. 2007;17(6):809-14. Erratum in: Obes Surg. 2007 Jul;17(7):996. http://dx.doi.org/10.1007/s11695-007-9147-6
23. Sareli AE, Cantor CR, Williams NN, Korus G, Raper SE, Pien G, et al. Obstructive sleep apnea in patients undergoing bariatric
surgery--a tertiary center experience. Obes Surg. 2011;21(3):316-27. http:// dx.doi.org/10.1007/s11695-009-9928-1
24. Lopez PP, Stefan B, Schulman CI, Byers PM. Prevalence of sleep
apnea in morbidly obese patients who presented for weight loss surgery evaluation: more evidence for routine screening for obstructive sleep apnea before weight loss surgery. Am Surg.
2008;74(9):834-8.
25. Lee YH, Johan A, Wong KK, Edwards N, Sullivan C. Prevalence and
risk factors for obstructive sleep apnea in a multiethnic population of patients presenting for bariatric surgery in Singapore. Sleep Med.
2009;10(2):226-32. http://dx.doi.org/10.1016/j.sleep.2008.01.005
26. Hallowell PT, Stellato TA, Schuster M, Graf K, Robinson A, Crouse C,
et al. Potentially life-threatening sleep apnea is unrecognized without
aggressive evaluation. Am J Surg. 2007;193(3):364-7; discussion 367. http://dx.doi.org/10.1016/j.amjsurg.2006.09.022
27. Jakobsen GS, Hofsø D, Røislien J, Sandbu R, Hjelmesaeth J.
Morbidly obese patients--who undergoes bariatric surgery? Obes
Surg. 2010;20(8):1142-8.
http://dx.doi.org/10.1007/s11695-009-0053-y
28. Kolotkin RL, LaMonte MJ, Walker JM, Cloward TV, Davidson LE, Crosby RD. Predicting sleep apnea in bariatric surgery patients.
Surg Obes Relat Dis. 2011;7(5):605-10. http://dx.doi.org/10.1016/j. soard.2011.04.226
29. Dixon JB, Schachter LM, O’Brien PE. Predicting sleep apnea and excessive day sleepiness in the severely obese: indicators for
polysomnography. Chest. 2003;123(4):1134-41. http://dx.doi. org/10.1378/chest.123.4.1134
30. Gasa M, Salord N, Fortuna AM, Mayos M, Embid C, Vilarrasa N, et al.
Optimizing screening of severe obstructive sleep apnea in patients