Prevalence and Risk Factors for Urinary and Fecal Incontinence
in Brazilian Women
Joao L. Amaro, Carlos A. Macharelli, Hamilto Yamamoto, Paulo R. Kawano, Carlos R. Padovani,
Aparecido D. Agostinho
Department of Urology (JLA, HY, PRK, ADA), Department of Public Health (CAM), and Department
of Statistics (CRP), School of Medicine, UNESP, Botucatu, Brazil
ABSTRACT
Objective: To evaluate prevalence and risk factors of fecal and urinary incontinence (UI) in Brazilian women.
Materials and Methods: 685 women older than 20 years of age answered a questionnaire about urinary and fecal symptoms, clinical and obstetric antecedents. They were grouped according to presence or absence of UI.
Results: Urinary and fecal incontinence was reported in 27% and 2% of cases, respectively. Mean age of incontinent
women was signiicantly higher than continent ones. Incontinent women had a mean number of micturitions signiicantly
higher than the continent ones. On average, incontinent women had higher rate of pregnancies and vaginal delivery when
compared to the continent ones. Body mass index (BMI) was signiicantly higher in incontinent participants and in women
with no UI complaints (27.35 vs. 24.95, p < 0.05). Fecal incontinence prevalence was 2% and occurred exclusively in patients with UI.
Conclusions: Vaginal delivery and high BMI have been identiied as risk factors for UI development while aging and number of pregnancies may be correlated factors.
Key words: urinary incontinence; fecal incontinence; female; prevalence Int Braz J Urol. 2009; 35: 592-8
INTRODUCTION
The study of prevalence and risk factors of urinary and fecal incontinence in women is very important to establish preventive strategies. There are different epidemiological studies showing wide variability in the results, probably related to the lack of uniform methodological criteria to evaluate urinary incontinence (UI).
UI is a worldwide public health problem that affects thousands of women, and causes seri-ous socio-economic impact. It can also influence quality of life (1,2) or lead to isolation and depres-sion (3).
Aging, menopause, pregnancy and delivery (2) as well as obesity (5,6) are considered important risk factors to develop stress urinary incontinence (SUI).
Fecal incontinence (FI) is characterized by liquid or solid feces loss, and can originate from
neuromuscular lesions of the pelvic loor muscle. A
recent study showed a 19.7% incidence in women with gynecological problems (7).
To our knowledge no study showing UI prevalence in Brazilian women has to date been reported. How-ever, Guarisi et al. observed SUI prevalence in 35% of cases in a population of exclusively climacteric women (9).
Therefore, there are few reported studies, in Brazil, with an appropriate design to detect this pa-thology. This study aimed to determine fecal and UI prevalence and risk factors to develop UI in women who lived in Botucatu, an averaged-size Brazilian town, whose population represents a Brazilian ethnic composition.
MATERIALS AND METHODS
The study evaluated 685 women older than 20 years-old living in Botucatu. For the sample calcula-tion, the data bank of SEADE Foundation (10) was used to obtain the number of those women who were
within the age limit proposed in the study. A stratiied
simple random sampling of 685 women, representa-tive and proportional to the studied age limit, was obtained out of 34,066 women.
All women, randomly selected, answered a clinical evaluation questionnaire. All participants were visited and informed about the research, and, if they agreed to participate, they signed the free informed consent approved by the Ethical Research Board of the Botucatu Medical School. This question-naire was previously tested (11) and used for question
evaluation, the veriication and women’s acceptance,
as well as for interviewer training.
The selected women participated in two
different phases, irstly they were previously sent
a sealed envelope and a clinical questionnaire by mail that had to be completed and sent back to the researchers. In the second phase, 30 days later, all selected women were interviewed in their homes by previously trained interviewers. No patient refused to answer the questionnaire, which was divided into
three different parts: 1- Identiication; 2- Speciic
evaluation of symptoms such as the relationship be-tween strength, urinary and fecal loss, circumstances of urine loss, obstetric history, problems regarding
urine storage and surgical history; 3- Psycho-social
effects of disease.
Body mass index (BMI), obtained through the
questionnaire, was calculated and classiied according
to Garrow et al. (12).
Any urine loss was considered urinary in-continence, and fecal loss was considered any loss, either solid or liquid, in the previous year. Urinary incontinence intensity was evaluated considering the circumstances of loss, that is, mild at extreme stress (cough, carrying weight), moderate at medium stress (running, going up and down stairs) and severe at minimum stress (walking, change in a lying posi-tion).
The women were divided into two groups according to the presence or absence of urine loss: group G1 (n = 500) with women without urine loss and group G2 (n = 185) with urine loss.
Considering the quantitative variables of groups (age, micturition number, pregnancies and
BMI), the Student’s t-test was used for independent
samples (13). As for group associations with qualita-tive variables (categorized), the Goodman test was used for contrasts in the multinomial population (14). The multivariable logistic regression analysis of uri-nary incontinence was performed as regards variables: vaginal delivery, aging, number of pregnancy and
BMI (15). Differences were considered signiicant
when the p value was < 0.05.
RESULTS
The clinical evaluation questionnaire was answered and sent back to the researcher in 18% (121/685) of cases, which prevented the comparative analysis with the individuals interviewed at home.
UI prevalence was 27%, and 15% of the
in-continent women had urine loss at minimum stress;
urgency was associated with 58% of cases. Among the women with UI, 36% reported the use of 2.7 pads per day, on average. Urine loss was related to childbirth in 30% of cases (56/185), to pregnancy in 9% (16/185) and without apparent cause in 61% (113/185).
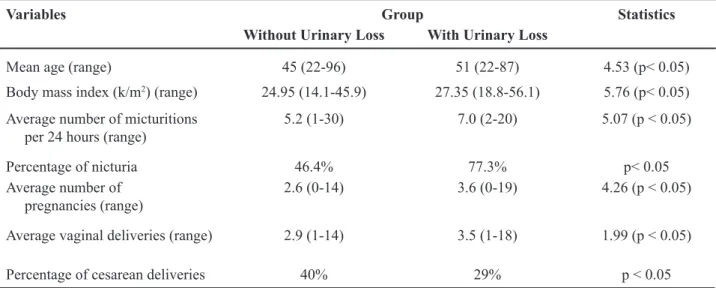
Mean age was signiicantly higher in G2
than in the continent group (Table-1). UI prevalence increased with aging (Figure-1).
inconti-nent women than in the contiinconti-nent ones (Table-1). Nocturia was significantly higher in incontinent women than in continent women (77% - vs. 46%), p < 0.05).
The number of pregnancies was, on average,
signiicantly higher in women with UI when compared
to continent women (Table-1). Vaginal delivery was
signiicantly higher in the incontinent group than in
the continent group (76% vs. 54%, p < 0.05).
There was signiicantly higher predominance
of cesarean section among the continent patients (Table-1).
Table 1 – Demographic characteristics of 685 subjects interviewed.
Variables Group Statistics
Without Urinary Loss With Urinary Loss
Mean age (range) 45 (22-96) 51 (22-87) 4.53 (p< 0.05)
Body mass index (k/m2) (range) 24.95 (14.1-45.9) 27.35 (18.8-56.1) 5.76 (p< 0.05)
Average number of micturitions per 24 hours (range)
5.2 (1-30) 7.0 (2-20) 5.07 (p < 0.05)
Percentage of nicturia 46.4% 77.3% p< 0.05
Average number of pregnancies (range)
2.6 (0-14) 3.6 (0-19) 4.26 (p < 0.05)
Average vaginal deliveries (range) 2.9 (1-14) 3.5 (1-18) 1.99 (p < 0.05)
Percentage of cesarean deliveries 40% 29% p < 0.05
There were 80% (402/500) of women with at least one pregnancy in the continent group, and 91% (168/185) in the incontinent group (Table-2).
BMI was on average signiicantly higher in
the group with urinary loss as regards the continent women (Table-1).
In the incontinent group, 70% of women reported discomfort and 1.2% sought medical care due to urine loss. Among the incontinent group, there were social consequences for 4.8%, 3.6% reported isolation of friends and 1.2% of the family.
In 2% of cases, UI was associated with fecal incontinence , no fecal loss was observed in continent women.
The multivariable logistic regression analysis of vaginal delivery and BMI showed that they are risk factors of urinary incontinence and no statistical dif-ference was observed regarding aging and the number of pregnancies (Table-3).
COMMENTS
UI prevalence was observed in 27% of women ranging from 20 to 59 years of age and 60
years or older who lived in the town of Botucatu, SP.
Other studies showed that UI prevalence varied from 4.6% to 46% depending on age and the methodology adopted (15-18). This shows wide discrepancies in
world prevalence rates as well as the likely inluence
of different ethnicities (19). It would be inappropriate to extrapolate these data to our population since racial
characteristics could inluence UI rates. In Brazil, it is dificult to distinguish among different races due
to the high miscegenation rate (20), regional studies
could provide speciic strategies for prophylaxis and
adequate treatment of UI.
Higher incidence of mixed UI (58% of cases) was observed concerning stress urinary incontinence. This rate was corroborated by Nieto Blanco et al. (21). However, it is higher than the rate described in the
Norwegian EPICONT study (22). These facts may be explained by the different sensitivity and speciicity of
the clinical questionnaire in diagnosing SUI, urgency UI and mixed UI or even by the characteristics and age of the women studied (23).
This study observed higher UI incidence regarding aging in the women studied. These aspects are found in other studies (11,24), showing a probable
increase of risk factors in women’s aging.
In the incontinent group, a higher number of micturitions were found not only in 24 hours but also
in nocturia; this fact can be related to higher incidence
of urgency observed in this study when compared to the literature (22).
Despite controversy, some authors have re-ported higher SUI incidence in women who had vaginal delivery, suggesting a likely protective action of
cesar-ean section in UI (3,18). This study observed signiicant
higher incidence of vaginal delivery than cesarean in
women with urinary loss; however, despite the prob -able protective role of cesarean section in UI develop-ment, maternal-fetal risk and better performance in post-partum UI prophylaxis must be considered before recommending this delivery procedure.
Considering BMI, there was a signiicant body weight increase regarding UI; this correlation
was also observed by other authors (16).
The fact that UI is not a lethal disease and its minor social consequences (4.8%) may explain the very low percentage (1.2%) of patients who sought medical care, although 70% in our study reported discomfort.
Incontinent women presented 2% of fecal incontinence. Anal sphincter incompetence as well
Table 2 – Inluence of delivery as a determinant factor of urinary incontinence.
Groups (N) Delivery Statistics
Vaginal Delivery Alone At least One Non Vaginal Delivery
Continent (402) 152 (37.81%) 250 (62.19%)
as UI can be related to pelvic loor dysfunction (25),
and both should be treated concomitantly by surgical
or non-surgical treatment, improving the patients’
quality of life.
In our patient population, the questionnaire sent by mail has not shown to be adequate for UI
evaluation; however, other authors recommend their
use to study UI prevalence in women (8).
CONCLUSIONS
UI and fecal incontinence prevalence in Brazilian adult women older than 20 years was 27% and 2%, respectively. Vaginal delivery and high BMI
have been identiied as risk factors for UI develop -ment while aging and number of pregnancies may be correlated factors. Mixed UI was the most prevalent followed by stress UI.
ACKNOWLEDGEMENTS
This study was supported by FAPESP grant, proc. 2000 ⁄ 11335-3.
CONFLICT OF INTEREST
None declared.
REFERENCES
1. Capellini MV, Riccetto CL, Dambros
M,Tama-nini JT, Hermann V, Muller V: Pelvic loor exercises
Table 3 – Model of logistic regression of urinary incontinence.
Variable Coeficient ± SD p Value OR* (CI ** 95%)
Constant -4.2880 ± 0.5510 -
-Age 0.0106 ± 0.0063 p > 0.05 1.011 (0.998;1.023)
Vaginal delivery 0.7360 ± 0.2210 p < 0.05 2.087 (1.354;3.219) Number of pregnancies 0.0284 ± 0.0383 p > 0.05 1.029 (0.954;1.109)
BMI 0.0848 ± 0.0188 p < 0.05 1.088 (1.049;1.129)
SD = standard deviation; * odds ratio; ** conidence interval; BMI = body mass index.
with biofeedback for stress urinary incontinence. Int
Braz J Urol, 2006; 32: 462-9.
2. Amaro JL, Yamamoto H, Kawano PR, Barros G,
Gameiro MOO, Agostinho AD: Clinical and quality-of-life outcomes after autologous fascial sling and tension-free vaginal tape: A prospective randomized
Trial. Int Braz J Urol, 2009; 35: 60-7.
3. Hampel C, Artibani W, Espuña Pons M, Haab F,
Jackson S, Romero J, et al.: Understanding the burden of stress urinary incontinence in Europe: a
qualitative review of the literature. Eur Urol. 2004;
46: 15-27.
4. Mason L, Glenn S, Walton I, Appleton C: The expe-rience of stress incontinence after childbirth. Birth.
1999; 26: 164-71.
5. Mydlo JH: The impact of obesity in urology. Urol Clin
North Am. 2004; 31: 275-87.
6. Lara MD, Kothari SN, Sugerman HJ: Surgical manage-ment of obesity: a review of the evidence relating to
the health beneits and risks. Treat Endocrinol. 2005;
4: 55-64.
7. Boreham MK, Richter HE, Kenton KS, Nager CW,
Gregory WT, Aronson MP, et al.: Anal incontinence in
women presenting for gynecologic care: prevalence, risk factors, and impact upon quality of life. Am J
Obstet Gynecol. 2005; 192: 1637-42.
8. Hunskaar S, Arnold EP, Burgio K, Diokno AC, Herzog
AR, Mallett VT: Epidemiology and natural history of
urinary incontinence. Int Urogynecol J Pelvic Floor Dysfunct. 2000; 11: 301-19.
9. Guarisi T, Pinto Neto AM, Osis MJ, Pedro AO, Paiva
LHC, Faúndes A: Incontinência urinária entre mul-heres climatéricas brasileiras: inquérito domiciliar.
Rev Saúde Pública. 2001; 35: 428-35.
10. Instituto Brasileiro de Geograia e Estatística [homep
-age on the internet]. Censo Demográico do Estado de São Paulo de 1966. São Paulo: O Instituto; 1996. [cited
11. Agostinho AD, Amaro JL, Trindade JCS: Epidemiolo-gia da incontinência urinária feminina. In: Amaro JL, Haddad JM, Trindade JCS, Ribeiro RM (ed.), Reabili-tação do assoalho pélvico nas disfunções urinárias e
anorretais. 1ªed. São Paulo/SP, SegmentoFarma. 2005;
pp. 47-54.
12. Garrow JS: Treatment of obesity. Lancet. 1992; 340:
409-13.
13. Norman GR, Streiner DL: Biostatistics the Bare Es-sentials. St. Louis, Mosby Year Book. 1994.
14. Goodman LA: Simultaneous conidence intervals for multinomial proportions. Thecnometrics. 1965; 7:
247-54.
15. Hosmer DW, Lemeshow S: Applied Survival Analysis: Regression Modeling of Ttime to Event Data. New
York, John Willey & Sons. Inc. 1999; pp. 299. 16. Van Oyen H, Van Oyen P: Urinary incontinence in
Belgium; prevalence, correlates and psychosocial consequences. Acta Clin Belg. 2002; 57: 207-18. 17. Blanco Nieto E, Camacho Pérez J, Garpenholt O,
Nilsson K: Urinary incontinence. Prevalence, impact
no daily living and desire for treatment. Scand J Urol
Nephrol. 2003; 38:125-30.
18. Melville JL, Katon W, Delaney K, Newton K: Urinary incontinence in US women: a population-based study.
Arch Intern Med. 2005; 165: 537-42.
19. Hunskaar S, Burgio K, Diokno AC, Herzog AR, Hjä-mas K, Lapitan: Epidemiology and natural History
of urinary incontinence (UI). In: Abrams P, Cardozo L, Khoury S, Wein A (ed.), Paris, 2nd International Consultation on Incontinence. 2001; pp. 165-201.
20. Brasil – Ministério da Saúde – CEBRAP – Centro Brasileiro de Análise e Planejamento – SPS-CNDs/
HIV/AIDS: Comportamento sexual da população brasileira e percepção sobre o HIV/AIDS: relatório
inal de pesquisa. São Paulo. 1999; 18: 567-77. 21. Nieto Blanco E, Camacho Pérez J, Dávila Alvarez V,
Ledo García MP, Moriano Bejar P, Pérez Lorente M:
Epidemiology and impact of urinary incontinence in women between 40 and 65 in a health area of Madrid.
Aten Primaria. 2003; 32: 410-4.
22. Hannestad YS, Rortveit G, Sandvik H, Hunskaar
S; Norwegian EPINCONT study. Epidemiology of
Incontinence in the County of Nord-Trøndelag: A community-based epidemiological survey of female
urinary incontinence: the Norwegian EPINCONT
study. Epidemiology of Incontinence in the County of
Nord-Trøndelag. J Clin Epidemiol. 2000; 53:
1150-7.
23. Sandvik H, Hunskaar S, Vanvik A, Bratt H, Seim
A, Hermstad R: Diagnostic classiication of female
urinary incontinence: an epidemiological survey
corrected for validity. J Clin Epidemiol. 1995; 48:
339-43.
24. Peyrat L, Haillot O, Bruyere F, Boutin JM, Bertrand P, Lanson Y: Prevalence and risk factors of urinary
incontinence in young and middle-aged women. BJU
Int. 2002; 89: 61-6.
25. Chatoor DR, Taylor SJ, Cohen CR, Emmanuel AV:
Faecal incontinence. Br J Surg. 2007; 94: 134-44.
Accepted after revision: March 6, 2009
Correspondence address:
Dr. João Luiz Amaro Departamento de Urologia
Faculdade de Medicina de Botucatu
Botucatu, SP, 18618-970, Brasil
EDITORIAL COMMENT
This is an article regarding an interesting
topic; the prevalence and the risk factors of urinary
and fecal incontinence in Brazilian women, a
popula-tion with speciic racial characteristics. There are fewracial characteristics. There are few. There are few data on this issue available in the literature. However, only with a multivariable logistic regression analysis,
in the presence of different variables statistically
signiicant, it could be possible to understand the real
impact of different risk factors. Moreover, there are many certain and uncertain obstetrics risk factors for urinary incontinence that should have been considered or commented.
Dr. M. Serati
Department of Obstetrics & Gynecology University of Insubria Del Ponte Hospital Varese, Italy E-mail: [email protected]
EDITORIAL COMMENT
Dr. Amaro and colleagues performed a cross-sectional study in order to describe the rates of urinary and fecal incontinence in a Brazilian community. Through mailed questionnaires and home interviews, the authors found that 27% of respondents had urinary incontinence and only 2% had fecal incontinence. In contrast, Fritel and colleagues found a fecal incon-tinence rate of 9.5% in a cohort of French women (1). Although discrepancies on rates of incontinence between the studies may be related to research design, we must not forget that some studies have suggested that cesarean delivery is protective against pelvic
loor damage. Indeed, the rates of cesarean section
are less than 20% of all deliveries in France compared to approximately 50% of deliveries in Brazil (2). Furthermore, the authors found that vaginal delivery was associated with increased odds of urinary
incon-tinence and that fecal inconincon-tinence was only reported in women who also had urinary incontinence. Finally, the authors note that only 1.2% of respondents with incontinence sought medical care. Further research is needed to identify barriers to care so that steps may be taken to resolve obstacles to continence.
REFERENCES
1. Fritel X, Ringa V, Varnoux N, Zins M, Bréart G: Mode of delivery and fecal incontinence at midlife: a study of 2,640 women in the Gazel cohort. Obstet Gynecol.
2007; 110: 31-8.
2. Ribeiro VS, Figueiredo FP, Silva AA, Bettiol H, Batista
RF, Coimbra LC, et al.: Why are the rates of cesarean section in Brazil higher in more developed cities than
in less developed ones? Braz J Med Biol Res. 2007;
40: 1211-20.
Dr. Kyle J. Wohlrab
Division of Urogynecology and Female Pelvic Reconstructive Surgery
Women & Infants’ Hospital Alpert Medical School at Brown University