Original Article
Artigo Original
Correspondence address: Renata Filippini
Rua Cipotânea, 51, Cidade Universitária, São Paulo (SP), Brasil, CEP: 05360-000. E-mail: [email protected]
Received: 10/22/2013
Study carried out at the Department of Physical Therapy, Speech-Language Pathology and Audiology, and Occupational Therapy, School of Medicine, Universidade de São Paulo – USP, São Paulo (SP), Brazil. (1) Graduate Program in Rehabilitation Sciences, Department of Physical Therapy, Speech-Language Pa-thology and Audiology, and Occupational Therapy, School of Medicine, Universidade de São Paulo – USP– São Paulo (SP), Brazil.
(2) Speech-Language Pathology and Audiology Program, School of Medicine, Universidade de São Paulo – USP – São Paulo (SP), Brazil.
Financial support: Fundação de Amparo à Pesquisa do Estado de São Paulo (FAPESP), process number 2012/20086-4. Renata Filippini1
Eliane Schochat2
Descritores
Percepção Auditiva Mascaramento Perceptivo Projetos Piloto Testes Auditivos Adulto
Keywords
Auditory Perception Perceptual Masking Pilot Projects Hearing Tests Adult
A new paradigm for temporal masking assessment:
pilot study
Um novo paradigma para a avaliação do mascaramento
temporal auditivo: estudo piloto
ABSTRACT
Purpose: To determine the feasibility and applicability of a clinical backward masking test, focusing on the analysis of inter-stimuli interval, and not on the intensity thresholds as it has been traditionally done, thus proposing a new paradigm for temporal masking assessment. Method: The test consisted of the presentation of a target tone of 1.000 Hz followed by a broadband masking noise (950–1.050 Hz), with inter-stimuli interval of 0, 10, 20, 50 and 100 ms. The stimuli were presented monaurally to both ears, with intensity ratio between masker and target tone varying between -10, -20, -30 and -40 dB. Twenty undergraduate students, without hearing or auditory processing complaints, participated in this study. Results: Regardless of the signal-to-noise ratio, we observed decrease of average performance according to the decrease of the interval between stimuli. We also observed the indication that little or no masking occurs at the 100 ms interval, suggesting this interval is unsuitable for temporal masking assessment. The average interval threshold was below 27 ms for all investigated intensities, and increased 9 ms with every increase of 10 dB at signal-to-noise ratio. The signal-to-noise ratios of -20 and -30 were the best ratios for the test application. Conclusion: The paradigm proposed in this pilot study proved to be feasible, easy to apply, and trustworthy, being compatible with other researches which are the foundation for the study of temporal masking. This theme deserves further studies, continuing the analysis initiated here.
RESUMO
INTRODUCTION
Auditory temporal processing can be didactically divided in four categories: temporal ordering, temporal resolution, temporal integration, and temporal masking(1). Nowadays,
there are available and well-documented clinical measures to assess temporal ordering and resolution(2,3), but not temporal
integration and masking(4).
Masking is the phenomenon in which detection threshold of a sound stimulus is modiied by another sound stimulus presented simultaneously (simultaneous or clinical masking), before (forward temporal masking – FTM), or after (backward temporal masking – BTM)(1,5).
To recognize a target stimulus during a task of simultane-ous masking, an individual depends on good spectral resolu-tion, that is, on his/her capability to perceive and isolate the target frequency in the midst of the frequency of the masking stimulus. In tasks of temporal masking (BTM and FTM), an individual depends on temporal resolution, that is, on the ability to perceive the interval between the presentation of the target stimulus and masking stimulus, identifying them as two separate stimuli(6).
The mechanisms involved in temporal masking are not well deined. However, it seems that researchers agree that FTM has different mechanisms in comparison to BTM. It is proposed that, in BTM, cortical and nonsensory regions of the nervous system participate more markedly(4,7,8). Moreover,
when compared to the other conditions (simultaneous and FTM), BTM has more varied inter- and intrapersonal re-sponses, and is prone to greater inluence of memory, atten-tion, and practice(9,10).
In classical studies on temporal masking, Elliot(11-13) showed
some temporal masking principles, among them: (1) that mask-ing is more effective when stimuli are presented monaurally; (2) that the duration of the masking stimulus does not inlu-ence BTM; and (3) that a greater similarity between tones and masking noises makes masking more eficient.
Furthermore, contrary to what happens in simultaneous masking and FTM, the intensity of the masking stimulus does not inluence the occurrence of BTM to a large degree. In other words, higher intensities do not necessarily cause greater masking(8). A factor of extreme inluence in temporal masking,
however, is the silent interval between both stimuli, inversely proportional to the eficiency of masking(4). It has been
sug-gested that FTM can occur in an inter stimulus interval (ISI) between 75 and 200 ms, whereas BTM is effective in intervals between 0 and 100 ms but with considerable decreases in effect from 25 ms onward(8,14).
BTM has been the topic of several studies(15-19) because
of its relation with language alterations. However, the au-thors have analyzed the threshold of intensity in which the target signal is perceived and relied on tests elaborated in software applications that require the use of interfaces among pieces of equipment, previous training of the individual to be assessed, and signiicant time expenditure(4). Therefore,
this pilot study initiated the development of a test that can be quickly applied in clinical environments with no need
for other equipment. For this purpose, we propose a new paradigm to assess BTM through analyzing each threshold interval, believing that, as mentioned earlier, the duration of the interval between stimuli is considered one of the main inluencing factors of the masking effect in BTM. In addi-tion, assessing BTM by intensity threshold would make this clinical test very complex and protracted.
The purpose of this study was, therefore, to determine the feasibility and applicability of the paradigm in question, observing the characteristics and procedures that were more adequate for a later validation of a speciic test to assess BTM by analyzing ISIs in a more encompassing study.
METHOD
This study was approved by the ethics committee of Universidade de São Paulo’s School of Medicine (proto-col number 392/12). It was conducted at the Laboratory for Investigation on Auditory Processing of the Speech-Language Pathology and Audiology Program of the same institution. All the participants signed the informed consent form.
The soundtrack of this pilot study was produced digitally (WAV* format) with the software Sound Forge® Pro 10.0 (Sony
Creative Software Inc.) at 44,100 Hz and 16-bit resolution. The soundtrack had 30 items presented randomly. Each item was composed of one 25-ms pure tone (1,000 Hz, 10 ms of rise/fall) followed by a narrow-band (950–1,050 Hz) 200-ms masking noise, with ISIs of 100, 50, 20, 10, or 0 ms duration. Each one of the ISIs was presented ive times. In addition to these, ive other items that presented only a masking noise (without pure tones) were also included.
The test was applied with a CD player or a digital player (e.g., iPod) attached to a Grason–Stadler audiometer (model GSI-61). The soundtrack was presented through supra-aural headphones (model TDH-50), monsupra-aurally in both ears. The masking sound was set at a ixed intensity of 60 dB, and the tone was presented at the intensities of 50, 40, 30, and 20 dB. Therefore, in each application of the test, the signal-to-noise (S/N) ratio between the tone and the masking noise varied between -10 and -40. We requested the participants to press the response button whenever they perceived the presence of the target signal (pure tone). The assessment of each ear lasted about 5 minutes (1’10’’ per S/N ratio), totalizing about 10 minutes of evaluation.
Twenty university students, aged between 18 and 38 years, agreed to participate in the study and were as-sessed. All presented normal hearing (≤20 dB; 0.25–8 kHz) and absence of complaints about auditory processing alterations. They also stated that they had never received any musical training.
To analyze the data, we used descriptive statistics, Student’s
t-test and analysis of variance, with a level of signiicance of 5%.
RESULTS
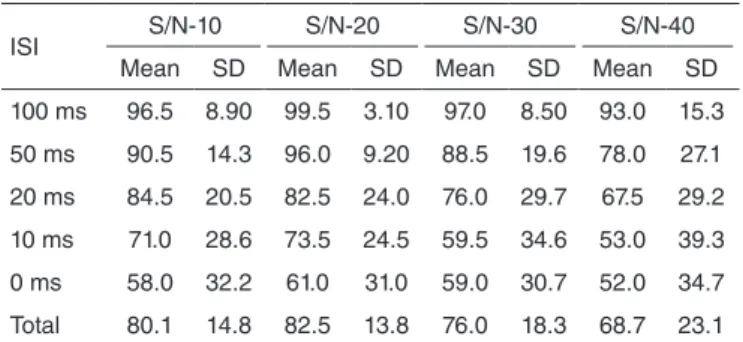
In regard to the ISIs, there was no difference in the individu-als’ performance from one ear to the other. For this reason, the results obtained in each ear were uniied, totalizing a sample of 40 ears assessed with the purpose of increasing the power of the statistical analyses carried out. The highest averages of correct answers were achieved at the intervals of 100, 50, and 20 ms, and for the S/N -10 and -20 ratios. We also observed consider-able standard deviations (SD), the most substantial related to the lowest averages of correct answers (Table 1).
In regard to the thresholds obtained, we observed three or more correct answers in a consistent manner in the ISI of 0 ms in about 50% of the ears assessed in the S/N -10, -20, and -30 ratios; concerning the S/N -40 ratio, this number decreased considerably (Table 2). Statistically, we veriied signiicant differences only between the average thresholds of the S/N -40 ratio and those of the easier ratios (S/N -10: p=0.022; S/N -20: p=0.005).
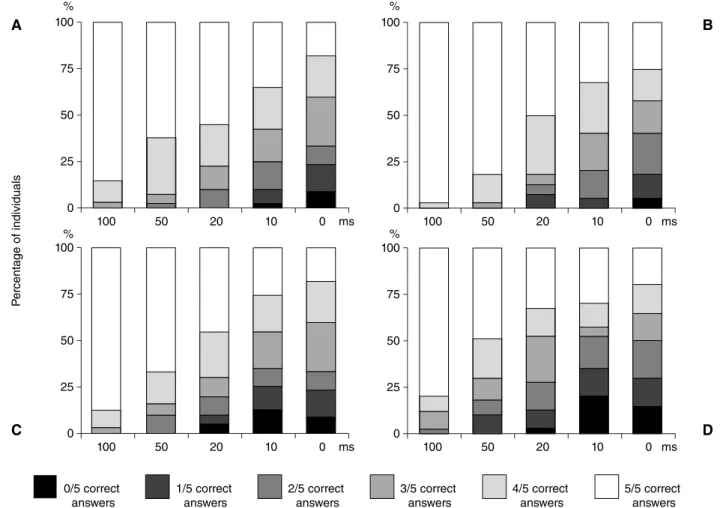
On analyzing the number of correct answers per interval, we observed that in the ISIs of 100 and 50 ms, in all S/N ratios, the majority of the ears evaluated (more than 70%) obtained four or ive correct answers, therefore achieving scores ≥80%. Starting at the ISI of 20 ms, the proportion of ears with four or ive correct answers decreased slightly but was not lower than 70%, except in the S/N -40 ratio, in which only about 45% of the ears assessed presented such performance. Concerning the intervals of 10 and 0 ms, the proportion of individuals with four or ive correct answers per ISI decreased considerably, as it was below 60.0% for 10 ms, and 42.5% for 0 ms in all S/N ratios (Figure 2).
Figure 1. Average, trust interval, and polynomial trend lines of the
perfor-mances (%) per interstimulus interval, according to the signal-to-noise ratio. It is possible to observe that the most marked differences in performance occur between the intervals of 100 and 0 ms, and that this difference is almost constant in all S/N ratios. Regarding the other intervals, a gradual and nonlinear decrease in the averages, and in the difference between the averages of each ISI, can be observed as the S/N ratio increases. The aver-age of the 10-ms ISI matches that of the 0-ms ISI in the S/N -30 ratio, and this similarity is maintained in S/N -40
100
-10 db -20 db -30 db -40 db 100 ms 50 ms 20 ms 10 ms 0 ms
90 80 70 60 50
P
erf
or
mance (%)
40 30
ISI S/N-10 S/N-20 S/N-30 S/N-40
Mean SD Mean SD Mean SD Mean SD
100 ms 96.5 8.90 99.5 3.10 97.0 8.50 93.0 15.3
50 ms 90.5 14.3 96.0 9.20 88.5 19.6 78.0 27.1
20 ms 84.5 20.5 82.5 24.0 76.0 29.7 67.5 29.2
10 ms 71.0 28.6 73.5 24.5 59.5 34.6 53.0 39.3
0 ms 58.0 32.2 61.0 31.0 59.0 30.7 52.0 34.7
Total 80.1 14.8 82.5 13.8 76.0 18.3 68.7 23.1
Table 1. Average of correct answers (%) and standard deviation for each
signal-to-noise ratio, according to the interstimulus interval
Caption: ISI = interstimulus interval; S/N = signal-to-noise ratio; SD = standard deviation
S/N 100 ms 50 ms 20 ms 10 ms 0 ms Média
(ms) SD
n % n % n % n % n %
-10 dB 1 2.5 4 10.0 8 20.0 6 15.0 21 52.5 11.5 20.07
-20 dB 0 - 5 12.5 4 10.0 9 22.5 22 55.0 9.5 15.18
-30 dB 3 7.5 5 12.5 7 17.5 5 12.5 20 50.0 18.5 28.69
-40 dB 6 15.0 5 12.5 11 27.5 3 7.5 15 37.5 27.5 34.70
Table 2. Distribution and average of the threshold intervals of all ears assessed, according to the signal-to-noise ratio
Caption: S/N = signal-to-noise ratio; n = number of individuals; SD = standard deviation
DISCUSSION
In this pilot study, we observed very interesting initial results pertaining to the application of this new paradigm to assess BTM. These results strengthen the possibility of devel-oping and applying a speciic clinical test to assess this aspect of temporal auditory processing.
The absence of ear effects in the application of the test de-veloped here was expected, as monotonic tasks, such as the task assessed in this study, and contrary to dichotic tasks, activate both ipsi- and contralateral auditory pathways, resulting in a similar performance between both ears(20,21).
We observed a decrease in the average performance as the ISI decreased, regardless of the S/N ratio. This result conirms, once again, the strong inluence of the interval between stimuli on the masking effect that the noise causes in the target signal(7,8,14).
However, we observed signiicant SDs, which were larger for the shortest intervals. These deviations may be associated with the variability of the BTM, already shown in other studies(10,15,16,18).
This allows us to infer that this is not a deiciency of the test but a characteristic inherent to the task involved in it. This inter- and
intrasubject variability has been associated with nonauditory aspects (e.g., memory, attention, and learning) involved in the auditory processing of acoustic stimuli(6,19). Although, in this study,
the test under development did not present as great a dependence on memory skills as the aforementioned studies — in which the individuals had to choose, out of two or three options, the one that presented the target sound — we believe that attention greatly inluenced the participants’ performance.
Considering that the evaluation items were presented with-out any warning that alerted the individual that the stimulus was about to be presented (e.g., “number one,” “pay attention”) in the sound track produced for this study, therefore requiring the participant’s complete attention, we believe that an attention deicit was observed during the test. The participants reported dificulties to complete the test and to sustain their attention for its entire duration. Moreover, the observation that the largest SDs are associated with the shortest intervals and the greatest S/N ratios suggests that the more intricate the presentation of the stimuli, the larger its dependence on attention. In this sense, an introduction to each item may be fundamental to decrease the SDs and the variability.
Figure 2. Distribution of the individuals (%) according to the number of correct answers per interstimulus interval in each signal-to-noise ratio assessed;
(a) S/N -10 dB; (b) S/N -20 dB; (c) S/N -30 dB; (d) S/N -40 dB. The figure shows a decrease in the proportion of ears with four or more correct answers (white and lighter gray) per ISI in all S/N ratios. It is observable in (b) that the highest percentage of ears with four or more correct answers in all ISIs is in S/N -20
P
er
cent
age of individuals
0/5 correct answers
1/5 correct answers
2/5 correct answers
3/5 correct answers
4/5 correct answers
5/5 correct answers
A
C
B
D
100
100 50 20 10 0
75
50
25
0 100
100 50 20 10 0
75
50
25
0
100
100 50 20 10 0
75
50
25
0 100
100 50 20 10 0
75
50
25
0
% %
% %
ms ms
The 0-ms ISI presented the greatest variability of responses among the individuals, with almost constant worse averages from one S/N to the other, and a small proportion of individu-als with performances that surpassed 80%. This indicates that, regardless of the intensity of the masking sound, the absence of an interval between stimuli caused the highest levels of masking of the target signal among the ive ISIs tested.
However, regarding the 100-ms interval, almost all individu-als presented performances that surpassed the 80% mark in all S/N ratios, which indicates that in this interval they were able to perceive the presence of the target sound almost every time it was presented, that is, without considering the intensity at which it occurred, the masking was weak or null.
These results are corroborated by previous studies that report significant BTM effects at an ISI between 0 and 25 ms, when the effect decreases and inally ceases around 100 ms(8,13,14). Therefore, we suggest that the 100-ms interval
is not adequate to assess BTM, whereas the 0-ms ISI must be analyzed with caution because of its strong masking effect, even in normal populations.
Regarding the other intervals, we observed different perfor-mances according to the S/N ratio, with averages worsening as the masking sound intensity increased, but not in similar manner in all ISIs. For instance, concerning the 10-ms ISI in S/N -30, we observed a signiicant decline in the average performance, an increase in its difference in relation to longer ISIs, and equal results to the 0-ms ISI. This performance was maintained in S/N -40. This observation allows us to hypothesize that, for each ISI, there is a critical S/N ratio in which the intensity of the masking noise no longer inluences performance. Therefore, although the intensity of the masking sound is not considered inluential in BTM(7,9), the intensity level at which the test is
conducted must be investigated further.
Concerning the S/N -10 ratio, the majority of the individu-als presented very good results in all ISIs, which is a sign that the test was very easy in regard to this ratio. Conversely, in the S/N -40 ratio, in which a large proportion of the individuals had poor performances, the test seemed very dificult. Considering that any evaluation must have some level of dificulty, neither so easy that the alerted individuals have good performances nor so dificult that normal individuals present altered results(22),
we conclude that the S/N -20 and -30 ratios are the most reliable ones when conducting this test.
The average threshold interval found in this pilot study was below 27.5 ms (Table 2) and varied according to the S/N ratio. We also observed a possible pattern in the increase of average threshold intervals with an increase in intensity ratios. After S/N -20 (similar to S/N -10, with a difference of only 2 ms), the average threshold interval was about 9 ms longer at every 10-dB increment to the intensity ratio between the signal and the masking sound.
In studies on BTM carried out following the traditional paradigm of intensity thresholds, a nonlinear pattern of the ef-fect of the intensity of the masking noise can also be observed: for each 10-dB increment to the intensity of the masking sound, an increase of 3 dB in the threshold of detection of the target sound was observed(13,14).
In addition to the signiicant response variability discussed above, another aspect of this study that can raise doubts is the intensity at which the test was conducted. We did not consider each individual’s audiometric thresholds when conducting the test; in other words, an application intensity was deined and ixed beforehand. Although all participants presented thresholds below 20 dB, in practice the individuals with lower thresholds might have experienced more dificulty to perceive the target signal in the lower S/N ratios, as this signal had an intensity that was very close to their perception threshold during silence, and not because they were unable to solve such acoustic situations.
Therefore, in future studies with the purpose of validat-ing this test, attention must be paid to the aspects, such as conducting the test considering each individual’s audiometric thresholds to determine the intensities of the masking noise and the target signal, as well as including an introductory signal for each new item with the purpose of testing the hypothesis of the inluence of a participant’s attention in response variability.
Shorter ISIs must be tested (between 50 and 0 ms, for in-stance) — they cause a more marked temporal masking effect and favor the observation of clearer response patterns — by applying this test in the S/N ratios considered more reliable in this study (S/N -20 and -30). Another possibility is using higher ratios than the ones assessed here, with the purpose of continuing to observe the response pattern of each ISI ac-cording to S/N ratios. Furthermore, the test must be applied to individuals with conirmed alterations (e.g., cortical lesions) in addition to normal individuals, so as to determine its levels of sensitivity and speciicity.
CONCLUSION
In this study, we proposed to assess BTM by investigating threshold intervals instead of intensity threshold, as it has been traditionally done. The test developed was easy to produce and quick to apply, and its results proved to be compatible with those of previous studies that are considered the foundation of temporal masking theories. We conclude, therefore, that this new paradigm is feasible, easy to apply, and reliable. This topic needs future studies that will further the analysis initiated here.
ACKNOWLEDGMENTS
The authors thank Dr. Frank Musiek for his immense sup-port in devising the idea behind this study and its methodology.
*RF was responsible for the methodology, material production, data collection and analysis, literature review, and for writing the article; ES proposed the initial idea and was responsible for the methodology, supervision, and article revision.
REFERENCES
1. Shinn JB. Temporal processing: the basics. Hear J. 2003;56(7):52 2. Musiek FE. Frequency (pitch) and duration pattern tests. J Am Acad
3. Musiek FE, Shinn JB, Jirsa R, Bamiou DE, Baran JA, Zaida E. GIN (Gaps-In-Noise) test performance in subjects with conirmed central auditory nervous system involvement. Ear Hear. 2005;26(6):608-18. 4. Shinn JB. Temporal processing and temporal patterning tests. In.: Musiek FE,
Chermak GD. Handbook of (central) auditory processing disorder: auditory neuroscience and diagnosis. Vol 1. San Diego: Plural Publishing; 2007. p.231-56. 5. Moore BCJ. An introduction to the psychology of hearing. 5a ed. San
Diego: Academic Press; 2003. 373p.
6. Hartley DE, Wright BA, Hogan SC, Moore DR. Age-related improvements in auditory backward and simultaneous masking in 6- to 10-year-old children. J Speech Lang Hear Res. 2000;43(6):1402-15. 7. MacDonald JA. Using the ideal observer to predict performance in
perceptual tasks: an example from the auditory temporal masking domain. Atten Percept Psychophys. 2011;73(8):2639-48.
8. Rishiq DA, Harkrider AW, Hedrick MS. Acceptable noise level and psychophysical masking. Am J Audiol. 2012;21(2):199-205.
9. Hartley DE, Moore DR. Auditory processing efficiency deficits in children with developmental language impairments. J Acoust Soc Am. 2002;112(6):2962-6.
10. Roth DA, Kishon-Rabin L, Hildesheimer M. Auditory backward masking and the effect of training in normal hearing adults. J Basic ClinPhysiol Pharmacol. 2001;12(2 Suppl):145-59.
11. Elliott LL. Backward masking: monotic and dichotic conditions. J Acoust Soc Am. 1962;34:1108-15.
12. Elliott LL. Backward and forward masking of probe tones of different frequencies. J Acoust Soc Amer. 1962;34:1116-7.
13. Elliott LL. Development of auditory narrow-band frequency contours. J Acoust Soc Am. 1967;42(1):143-53.
14. Gelfand SA. Hearing: an introduction to psychological and physiological acoustics. New York: Marcel Dekker; 2004. p.243-431.
15. Wright BA, Lombardino LJ, King WM, Puranik CS, Leonard CM, Merzenich MM. Deficits in auditory temporal and spectral resolution in language-impaired children. Nature. 1997;387(6629):176-8. 16. Marler JA, Champlin CA, Gillam RB. Auditory memory for
backward masking signals in children with language impairment. Psychophysiology. 2002;39(6):767-80.
17. Montgomery CR, Morris RD, Sevcik RA, Clarkson MG. Auditory backward masking deicits in children with reading disabilities. Brain Lang. 2005;95(3):450-6.
18. Howell P, Rosen S, Hannigan G, Rustin L. Auditory backward-masking performance by children who stutter and its relation to dysluency rate. Percept Mot Skills. 2000;90(2):355-63.
19. Rosen S, Adlard A, van der Lely HKJ. Backward and simultaneous masking in children with grammatical speciic language impairment: no simple link between auditory and language abilities. J Speech Lang Hear Res. 2009;52:396-411.
20. Baran JA, Musiek FE. Avaliação comportamental do sistema nervoso auditivo central. In: Musiek, FE, Rintelmann WF. Perspectivas atuais em avaliação auditiva. Barueri: Manole; 2001; p.371-409.
21. Kimura D. From ear to brain. Brain Cogn. 2011;76(2):214-7.