MANAGEMENT ACCOUNTING AND CONTROL SYSTEMS IN HEALTHCARE: A SYSTEMATIC LITERATURE REVIEW
Paulo André Pereira Clemente – 30597
A Project carried out on the Master’s in Management Program, under the supervision of: Associate Professor Maria João Major
2
Abstract
The healthcare sector is facing major environmental changes and increasing costs. These are creating new challenges and requiring new methodologies to assure quality performance and financial sustainability for medical institutions.
Therefore, this study aims at systematically reviewing literature on management accounting and control (MA&C), in particular activity-based costing (ABC), balanced scorecard (BSC), time-driven activity-based costing (TDABC) and total quality management (TQM) in healthcare.
Results show considerable research conducted on these topics, mostly originating in Europe and North America, despite a lot of TQM articles originating from Asia. The majority of the articles included are research articles, mostly collecting data from secondary data, interviews and surveys.
Keywords: Activity-based costing, Total quality management, Balanced scorecard, Time-driven activity-based costing, Healthcare, Systematic literature review.
Glossary (Journals list):
AMJ: Academy of Management Journal AH: Accounting Horizons
AMA: Advances in Management Accounting BIJ: Benchmarking: An International Journal BPMJ: Business Process Management Journal FAM: Financial Accountability and Management HCMR: Health Care Management Review HCMS: Health Care Management Science HE: Health Economics
HSMR: Health Services Management Research HSR: Health Services Research
HP: Health Policy
IJAIM: International Journal of Accounting and Information Management IJOPM: International Journal of Operations and Production Management IJPPM: International Journal of Productivity and Performance Management IJPSM: International Journal of Public Sector Management
JAOC: Journal of Accounting and Organizational Change JHOM: Journal of Health, Organization and Management JMAR: Journal of Management Accounting Research MBE: Measuring Business Excellence
QRAM: Qualitative Research in Accounting and Management SIJ: Service Industries Journal
TTJ: The TQM Journal
3
Table of Contents
1.) Introduction ... 4
2) Literature Review ... 5
2.1) Activity-Based Costing (ABC) ... 5
2.2) Time-Driven Activity-Based Costing (TDABC) ... 7
2.3) Balanced Scorecard (BSC) ... 8
2.4) Total Quality Management (TQM) ... 11
3) Methodology ... 12
3.1) Planning the Review... 12
3.2) Conducting the Review ... 13
3.3) Reporting and Dissemination ... 14
4) Empirical Study ... 15
4.1) Studied Sample ... 15
4.2) Variables Analysed ... 17
4.2.1) Subject ... 17
4.2.2) Origin of the Data ... 17
4.2.3) Type of Article ... 19
4.2.4) Data Collection Method ... 19
4.3) Variable Association Analysis ... 19
4.3.1) Origin of the Data and Subject ... 19
4.3.2) Type of Article and Subject ... 21
4.3.3) Subject and Data Collection Method ... 22
4.3.4) Data Origin and Type of Article ... 23
4.3.5) Data Origin and Data Collection Method ... 24
5) Conclusions, Limitations and Suggestions for Further Research... 25
4
1.) Introduction
Healthcare organizations have been facing a changing environment for decades, as a consequence of changes in the public health legal framework, private market imperatives and improvements in technology (Bazzoli et al., 2004). Also, demographic developments, especially in Western countries, show evidence that in the long run, hospitals won’t be able to accommodate and attend to all patients, creating a rising competitive pressure and need for management and efficiency improvements (Lachmann et al., 2013).
Furthermore, costs are also increasing in healthcare. The extending of life expectancy, the increasing expectations for healthcare and the application of new technologies are accountable for some of that increase (Kaplan & Porter, 2011). Inefficiencies such as unnecessary care, waste of resources, unwarranted clinical practice variation, administrative burdens, fraud and abuse also contribute for this rise in costs (Stadhouders et al., 2018). However, the fundamental reason behind increasing costs is the lack of ability to measure them correctly (Kaplan & Porter, 2011). Health care organizations have nearly no idea of how much it costs to treat a patient, much less how those costs relate to the outcomes achieved. Instead of analysing the full cycle of care of individual patients with specific medical conditions, these organizations focus on analysing costs at the specialty or service department level (Kaplan & Porter, 2011).
This contextual setting has forced hospitals and clinics to adopt strategic management, in order to better adapt to these changes and to remain sustainable. Therefore, consequences for the management accounting and control (MA&C) systems implemented in these organisations should be expected (Eldenburg & Krishnan, 2006). These systems allow medical institutions to assure the quality of the treatments and services, efficient and competent performance and accurate costing for financial sustainability (Lachmann et al., 2013).
The American accounting association defines accounting as “the process of identifying,
5
decisions by users of the information” (Sterling, 1967, p. 97). Management accounting and
control is a branch of accounting which focuses on the internal processes of an organization with the aim of improving performance, quality and cost efficiency by contributing for control and decision making. Among other tools, this branch of accounting embraces a collection of control mechanisms, focused on internal processes, with the aim of influencing employee behaviour in desirable ways, to reach the organization’s objectives (Drury, 2012).
This literature review was developed according to the methodology proposed by Tranfield et al. (2003) aiming at providing a systematic analysis of the subject MA&C systems in healthcare (Tranfield et al., 2003).
The systems activity-based costing (ABC), time-driven activity-based costing (TDABC), balanced scorecard (BSC) and total quality management (TQM) will have their literature in the field of healthcare systematically reviewed, in order to provide a thorough and rigorous state of the art analysis. These were selected due to their rising popularity in the sector (Keel et al., 2017; Gurd & Gao, 2007; Cannavacciuolo et al., 2015; Withanachchi et al., 2007) and due to the impact they can have to improve efficiency and reduce costs in healthcare institutions.
2) Literature Review
2.1) Activity-Based Costing (ABC)
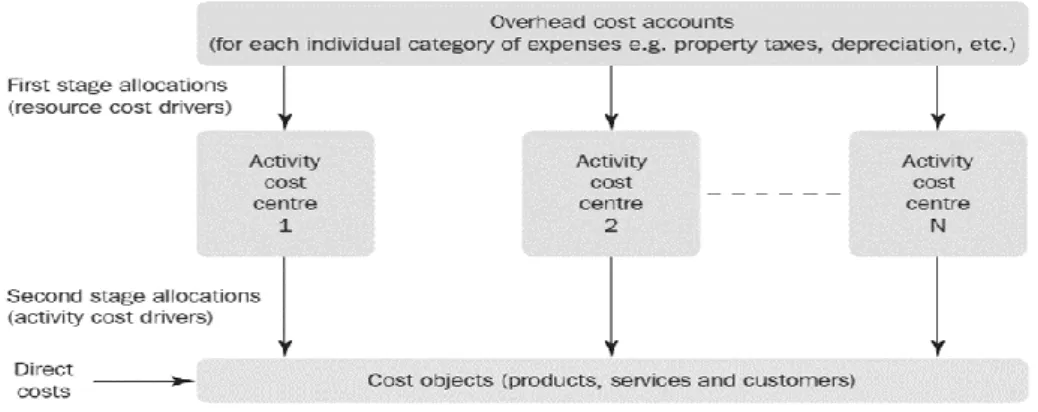
Activity Based Costing is a MA&C system with the purpose of computing costs of a given product or service. It emerged in the late 1980s with the aim of using cause and effect cost allocations and avoiding arbitrary allocations (Jones & Dugdale, 2002). This system defines activities and focuses on those activities, rather than departments, as the fundamental cost objects (Wouters, 1994). The costs are assigned according to the cause and effect relationship between activities and cost objects. It is used to allocate indirect costs (i.e. costs that cannot be assigned to specific cost objects) and assumes that activities are the real cause of those costs. After assigning costs to the activities it assigns the cost of those activities to the products or
6 services that required them. This is done by attributing cost drivers to each activity in order to compute a cost driver rate using the cost of a particular activity and then multiplying that cost driver rate by the volume of cost driver used by each product or service. Activities’ cost information is acquired by interviewing and surveying employees in order to understand the time spent by each employee in each activity (Drury, 2012).
The main reasons to use a system like ABC are the fact that it is necessary to trace overhead costs, which are relevant for decision making, there is the need to identify which products or services are profitable or unprofitable and product decisions are not independent, i.e. the decisions made for one product might have consequences for another, especially in complex environments (Cagwin & Bouwman, 2002). ABC systems arose from the increase in
complexity of companies, as organizations started to produce and selling multiple products or services, cost distortions started to occur. This made traditional costing methods obsolete and created the need for costing systems that could account for the complexity of productions and services delivery (Cooper & Kaplan, 1988).
Facing an increasing complexity, given that hospitals are often settings with many indirect costs, and facing rising costs, the healthcare sector is faced with the need of becoming more cost efficient, in order to remain sustainable in this changing environment (Cardinaels et al., 2004). Hence, a more developed cost system like ABC, may improve that efficiency by
Figure 1 - Activity Based Costing System
(Drury,2012)
7 providing more detailed cost information on the activities of an hospital or clinic, that could lead to better cost management and decision making.
2.2) Time-Driven Activity-Based Costing (TDABC)
TDABC was first presented by Kaplan and Anderson in 2004, as a an elegant and more accurate approach to costing, that filled the flaws of ABC (Balakrishnan et al., 2012). TDABC simplifies the process of costing by eliminating the need to interview and survey employees in order to allocate resources to each activity before assigning them to cost objects (Kaplan & Anderson, 2007). This method uses time equations to directly and automatically assign resource costs to the activities performed and transactions processed (Balakrishnan et al., 2017). For this only two estimates are required to be estimated, the capacity cost rate for the department and the capacity used by each transaction processed in the department (Kaplan & Porter, 2011). The first parameter, the capacity cost rate, can be obtained by computing the total cost of a process or department (for example, personnel, supervision, occupancy or equipment) and dividing that cost by the total capacity time available from the employees or machines performing the work of that process or department (Kaplan & Porter, 2011). After getting the capacity cost rate of each indirect resource, it is used to allocate departmental or process costs to cost objects by estimating the resource capacity demanded (typically in time units in this method) by each cost object (Kaplan & Anderson, 2007).
Besides presenting an easier method for estimating costs, TDABC also allows to compute unused capacity, i.e. the capacity of resources that was not used for production and therefore cannot be allocated to any cost object. Unused capacity provides a sign of inefficiency and shows organization’s resources that are not being used to its full potential (Kaplan & Anderson, 2007).
Another benefit of TDABC is its flexibility, as it allows managers to update the TDABC models to account for changes in operating conditions, such as the addition of new activities
8 or in the cost driver rates. For this they don’t need to reinterview personnel, they just have to estimate the new time unit required (in the case of a new activity) or to input the changes in costs in the cost driver rate computation (Kaplan & Anderson, 2004).
Thus, TDABC can capture the complexity of organizations, providing a simple and low resource demanding costing system (Demeere et al., 2009).
Given the increasing complexity in hospital settings and the increasing costs, also considering the challenges of correctly costing medical procedures, TDABC presents itself as a potentially formidable tool for the healthcare sector (Kaplan & Porter, 2011). Kaplan and Porter present a detailed framework to implement TDABC in healthcare (Kaplan & Porter, 2011) and in 2013 Kaplan, Witkouski and Hohman tested it in two pilot projects on two different departments of the Boston Children’s hospital (Kaplan et al., 2012).
2.3) Balanced Scorecard (BSC)
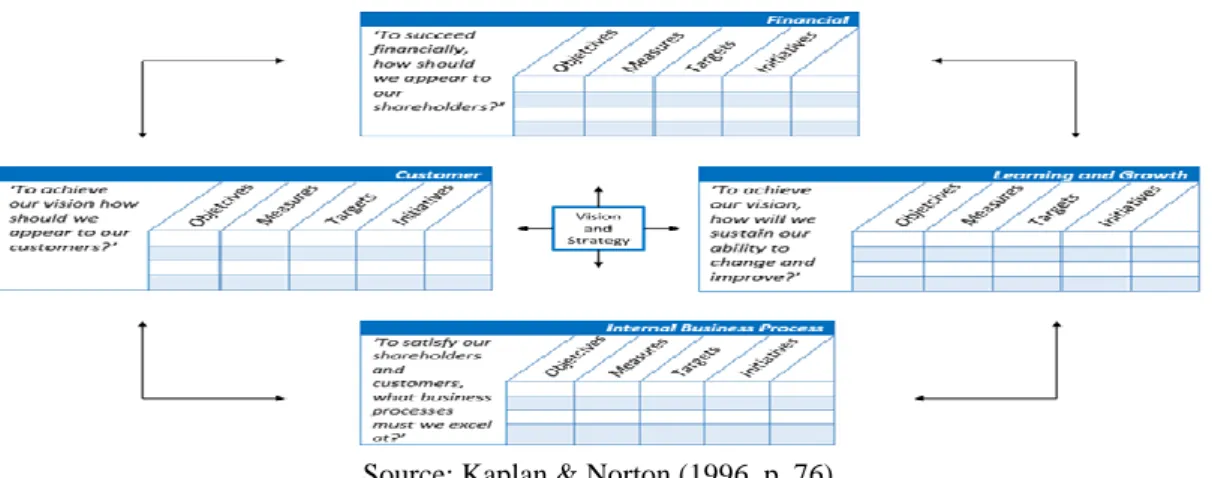
The BSC was first developed by Kaplan and Norton (in 1992) with the aim of balancing financial and non-financial measures of performance and to identify key performance measures that link measurements to strategy (Kaplan & Norton, 1996). It was devised in 1992 and was later refined creating a tool that would allow to translate an organization’s mission, vision and strategy into a comprehensive set of performance measures that provides the framework for implementing its strategy (Drury, 2012).
According to Kaplan and Norton, with the BSC, the company’s mission, vision and strategy are translated into operational objectives and performance measures, with respective targets and initiatives, for each of its four perspectives, Financial, Customer, Internal Business Process and Learning and Growth (Kaplan & Norton, 1992; Drury, 2012; Bhimani et al., 2015).
The Financial Perspective relates with how the organization is seen by shareholders. This perspective evaluates the profitability of the organization’s strategy, specifying its financial objectives and displaying the financial consequences of achieving the objectives of the
9 remaining three perspectives. Being the financial objectives a result of the outcomes from the objectives of the other perspectives, these should be selected bearing that causal relationship in mind.
Kaplan and Norton identify three core financial elements that they believe to drive the strategy of the organization, which are revenue growth, cost reduction and asset utilization. Each of these factors should be reflected in the outcomes of the other perspectives.
Customer perspective focuses on how the customers see the organization. The perspective identifies the customer the organization aims to target and the market segments in which it aims to compete. It also enables an organization to identify and measure the value propositions they aim to deliver. The customer perspective objectives impact the revenue element of the financial perspective and should therefore guarantee that the target revenues are achieved.
Internal business process perspective concerns with what the organization must excel at. This perspective focuses on the internal operations that contribute to achieve the organization’s customer and financial objectives. Kaplan and Norton recommend that managers should define a complete internal-process value chain to guide the application of this perspective. The process value chain consists of three processes: the innovation process, the operations process and the post-sales process. The innovation process consists of creating products, services and processes that will meet the current and future needs of customers. The operation process focuses on producing and delivering existing products and services to customers. Finally, the after-sale service aims at providing service support to the customer after the sale or delivery of a product or service.
Finally, the learning and growth perspective seeks to understand how the organization can continue to improve and to create value. It identifies the capabilities that the organization must excel at in order to reach superior internal processes, creating therefore value for customers and shareholders. To maintain loyal, lasting and satisfied customers and to continue to capitalize its
10 Figure 2 - The Balanced Scorecard
resources to the maximum on the long-term, an organization must keep learning and developing. Hence there is a necessity to focus on the capabilities that an organization needs to create long-term growth and improvement. This perspective emphasises the importance of organizations investing in their infrastructure (people, systems and organizational procedures) to deliver the capabilities that enable the realization of the other three perspectives’ objectives. Kaplan and Norton have identified three major enabling categories for this perspective. Those categories are employee capabilities, information systems capabilities and motivation, empowerment and alignment, which this perspective aims at increasing and improve.
Despite the original four perspectives designed by Kaplan and Norton, further studies have suggested other perspectives. For example, the perspective of sustainability, brought by Brignall, (2002) and even Kaplan and Norton suggested later on, in 2001, a new perspective called “Mission” for non-for-profit organizations. Thence, the choice of perspectives is critical in the design of the BSC, to decide how many perspectives to include and which ones (Gurd & Gao, 2007).
The BSC was first proposed as a useful tool for healthcare organizations in 1994 by Griffith and several authors have from then on advice its implementation (Aidemark & Funck, 2009). The focus of the BSC in healthcare organizations should be on patient health, that is, on the impact in the lives of the people who they are trying to help (Gurd & Gao, 2007).
11
2.4) Total Quality Management (TQM)
TQM is a MA&C system that has the goal of continuously improving the quality of products or services. At its core, it bears the idea of building quality into products and processes and making quality a goal and responsibility for everyone in the organization. It is a customer focused system, that involves all employees in continuous improvement of all aspects of the organization (Westcott, 2013).
TQM was first devised by the Naval Air Systems Command to describe its Japanese-style management approach to quality improvement. The philosophy and tools of this systems were developed over a long period of time. In the 1930s Shewhart developed methods for statistical analysis and control of quality. In the 1950s, Deming, Juran and Crosby made relevant contributions for the subject and Feignbaum’s impacted our current understanding of TQM. In 1968, the Japanese created the concept of “Company quality control” to describe their approach to total quality, giving rise to the term quality management systems (Westcott, 2013).
Nowadays, with customer’s growing concern regarding quality of goods and services, TQM remains a flexible term (Aquilani et al., 2017). Despite the challenges to implement it, considering its need for sometimes major and long-term changes, there have been efforts for practical implementations and for literature improvements (Ahire et al., 2009).
Furthermore, in the last decades, the awareness of medical errors, driving to patient injury and death, has created the need for healthcare legislation and integration of quality in healthcare (Jin et al, 2016). Medical error is the outcome of deficiencies in the medical operational process. This situation requires an improvement in the quality of such processes, which can be achieved via analysis of medical errors, assessment of error mechanisms and establishment of counter measures (Jin et al., 2016).
Terms such as clinical governance, clinical effectiveness, clinical audit, peer reviews, accreditation and continuous professional development are examples of efforts to control and
12 enhance the quality of medical services (Mosadeghrad, 2015). Therefore, the need for systems like TQM arise, systems that allow healthcare organizations to understand the needs of its customers, to search for best practices and to enhance processes to deliver competent care and decrease the number of errors (Jin et al., 2016). The use of TQM systems may lead to better quality care, patient satisfaction, employee morale, productivity and profitability (Mosadeghrad, 2015).
3) Methodology
This literature review was developed according to the methodology proposed by Tranfield et al. (2003) aiming at providing a systematic analysis of the subject management accounting and control systems in healthcare (Tranfield et al., 2003). In particular, the study focuses on ABC, TDABC, BSC and TQM given that they are among the most popular MA&C approaches in the healthcare sector (Keel et al., 2017; Gurd & Gao, 2007; Cannavacciuolo et al., 2015; Withanachchi et al., 2015). Tranfield et al. (2003) suggests that management reviews should adopt methods used in medical science. They defend this, arguing that traditional reviews often lack thoroughness and rigour and can be biased by the researcher. According to them, medical science tries to improve the review process by “synthesizing research in a systematic,
transparent and reproducible manner” (ibid., p. 1) aiming at enhancing the research on a
certain subject and to provide useful and reliable information for policy making and practice. A systematic review should include the maximum available data, analysing not only the literature of field of research but also from other relevant subjects and it should be reproducible. This review follows the three stages suggested by Tranfield et al. (2003) and as so it was divided in planning the review, conducting the review and reporting and dissemination.
3.1) Planning the Review
As mentioned earlier, this review aims at systematically analyse all relevant research on the scope of MA&C Systems in Healthcare. As such, some instruments were defined to protocol
13 the procedure. For starters, databases were selected to execute the search, namely B-On, Emerald and EBSCO. Then it was agreed that due to time and size of the study restrictions, this review was only to include articles from journals on the Association of Business Schools (ABS) ranking, which was also a way to assure the quality of the articles reviewed.
Furthermore, it was decided to include only articles published between 2000 and 2017 in order to prevent the inclusion of outdated and therefore irrelevant articles. Also, the timeline for the development of the study was established from July to December and it was decided that the first step would be to gather the literature meant to be included in the empirical study, followed by the execution of the literature review, the empirical study itself and finally the conclusions, limitations and suggestions for further studies as well as the introduction.
Finally, it was established that the review was to include only articles in English, could include any type of article and any type of data and could include articles from any field of research as long as it occurred in the healthcare sector and regarded the approaches selected.
3.2) Conducting the Review
To assure the reproducibility of the study, a search framework was constructed. The study focuses on the ABS ranking journals, in order to assure the quality of papers. Selected articles had to comply with a search algorithm which consisted of “Activity-Based Costing” OR “Time-Driven Activity-Based Costing” OR “ABC” OR “TDABC” OR “Balanced Scorecard” OR “BSC” OR “Total Quality Management” OR “TQM” AND “Health*” OR “Hospital*” OR “Clinic*” OR “Patient*” OR “Medic*”. The articles included had to mention at least one word of each side of the “AND” operator in the Title, in the abstract or in the keywords to be eligible for this study. The “*” is a wildcard that allows to search for variable endings of the root word. After searching the key terms in the databases, filters were applied in order to include only articles written in English, published in the period of 2000-2017 and published in an ABS
14 ranked journal. For the last part the journals had to be selected by hand. The search mode was set as Boolean and the source type as academic journals.
The search resulted in a total of 60 articles. These were analysed to verify the nature and context of the keywords in the articles and from that procedure resulted the exclusion of six articles, because they mentioned the keywords but in different contexts than the ones meant for the scope of this review, mainly because they did not regard the healthcare sector. Therefore, the universe of the study was composed of 54 articles, from 24 different journals.
The selected articles were then analysed, through an empirical study, for key characteristics that could be relevant for the field of research. Those were subject studied, journal of publication, year of publication, data (geographical) origin, type of article and data collection method. After analysing those variables some associations were also studied, namely the relationship between the subject studied and the data origin, the studied subject and the type of article, the studied subject and the data collection method, the data origin and the type of article and finally the data origin and the data collection method.
3.3) Reporting and Dissemination
As mentioned above, an empirical study was conducted to analyse key characteristics of the articles studied. Those key characteristics were reported in several graphs and tables, displaying the context of the sample reviewed. Then, in order to draw relevant conclusions, associations between the variables were analysed which were also reported in the form of tables and graphs. Finally, the analysis of the context and of the association allowed to draw conclusions about the state of literature in the MA&C systems studied in the healthcare sector.
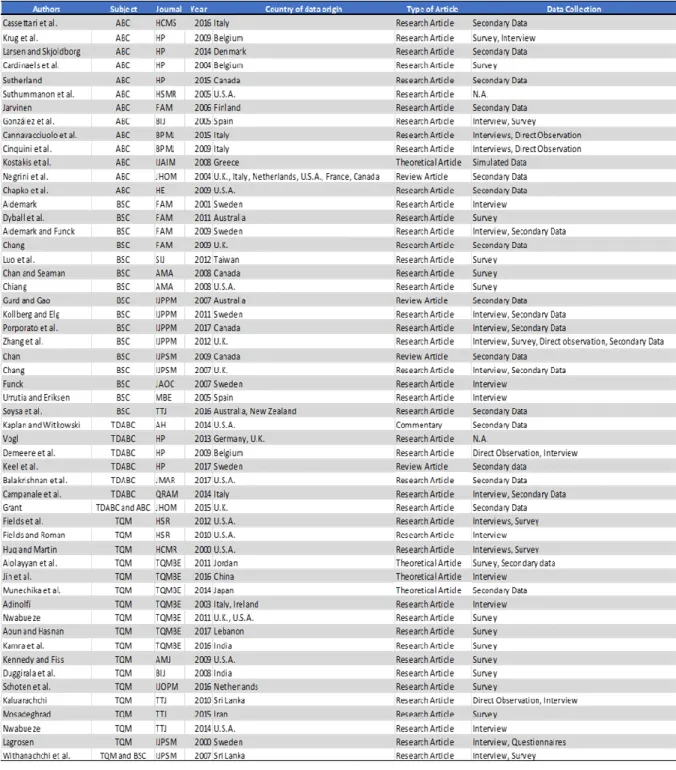
15 Table 1 - Studied Universe Relevant Data
4) Empirical Study 4.1) Studied Sample
Table 1 displays all relevant information regarding the articles retrieved. It includes the author’s name, the subject studied in the article, the journal and year of publication, the type of article and the data collection method.
16
Graph 1 - Articles per Journal per Subject
Graph 2 - Evolution of articles published through the years
The sample reviewed accounted for 54 articles published in 24 different journals (from 2000 to 2017). From those journals seven where from accounting as field of research, one from operations research and management science, six from public sector and health care, two from General Management, Ethics and Social Responsibility, six from Operations and Technology Management, one from Economics, Econometrics and Statistics and one from sector studies.
Observing the evolution of the total articles of the four MA&C systems studied (see Graph 2), we can see that 2009 was a year in which a lot of research in these fields occurred, no doubt the peak of the time frame observed with eight articles published that year. A slight tendency to increase is occurring, because from 2000 to 2009 the articles published varied between zero and three, and after 2009 until 2017 it varied from one to five.
Analysing the publication by subject studied (see Graph 3) it’s observable that in 2007 and 2012 more efforts were given to studying the BSC in healthcare, TQM had very few studies until 2008, after that fourteen of the seventeen sampled articles were published, demonstrating an
17 Graph 3 - Articles per Subject per Year
increasing concern with quality management in the healthcare sector from 2008 onwards. Activity based costing is the one more evened out through the years but only starting to get some publications after 2004. Regarding TDABC, only after 2009 it started to get some publications, which is understandable considering that it was only designed by Kaplan and Anderson in 2004, so it’s still a relatively recent concept. In 2002, no articles were published at all.
4.2) Variables Analysed 4.2.1) Subject
As already mentioned, the MA&C systems reviewed were ABC, BSC, TDABC and TQM in healthcare, therefore those are the subjects of study of the articles. From the 54 articles reviewed, 24% referred ABC, 30% analysed BSC, 11% studied TDABC, and 31% regarded TQM. There was also an article that
mentioned TDABC and ABC and one about TQM and BSC therefore each accounting for 2% of the sample. Graph 4 displays the distribution of the articles per subject.
4.2.2) Origin of the Data
Looking at the geographical origin of the data (Graph 5 shows the countries of data origin), is possible to see that the biggest sources of the data for the articles reviewed were the U.S.A.,
18 Graph 5 - Distribution of Articles per Country
accounting for 19% of the sample, the U.K. that accounted for 11% and Sweden and Italy with 10% each.
Vogl, 2013, analysed the U.K. and Germany DRG systems to improve patient level costing, analysing data from both Germany and U.K.. Negrini et al. 2004, studied several costing methods, one of which ABC, in Europe, using data from the U.K., Italy, Netherlands, U.S.A., France and Canada. Soysa et al., 2016 aimed at creating a performance measurement framework based on the BSC for Australian healthcare non-profit organizations using data from New Zealand and Australia. Adinolfi, 2003, studied TQM in Italian and Irish hospitals. Nwabueze, 2011, investigated the critical leadership traits to implement TQM in healthcare, conducting a survey in U.K. through a U.S.A. university. All other studies used data of only one country.
Graph 6 shows the distribution of article per continent of data origin. The sample has data from Asia, Europe, North America and Oceania, and Europe is clearly the one with most articles in it accounting for 51% of the
sample, followed by North America which accounts for 27%, Asia with 16% and Oceania that accounts for 6%.
19
4.2.3) Type of Article
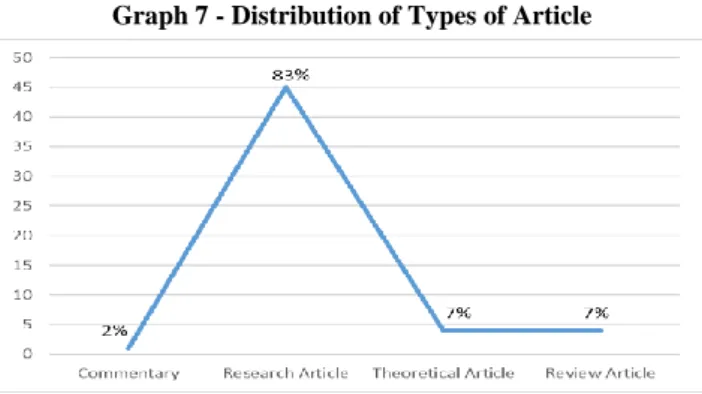
Graph 7 displays the distribution of the universe reviewed in terms of type of article. It’s possible to observe that 1 article is a commentary, accounting for 2% of the sample, the vast majority were research articles, accounting for 83% of the sample, 7% were theoretical articles and 7% review articles.
4.2.4) Data Collection Method
There were four data collection methods identified in the universe studied. Those were secondary data, surveys, interviews,
direct observation and simulated data. 30% of the articles used secondary data, 27% used a survey, 32% collected data through interviews, 7% used direct observation, 1% simulated data for their study and 3% of the articles had no mention of the method used to collect information. Graph 8 shows the distribution of the data collection methods.
4.3) Variable Association Analysis
4.3.1) Origin of the Data and Subject
F % F % F % F % F % China 0 0% 0 0% 0 0% 1 5% 1 2% India 0 0% 0 0% 0 0% 2 10% 2 3% Iran 0 0% 0 0% 0 0% 1 5% 1 2% Japan 0 0% 0 0% 0 0% 1 5% 1 2% Jordan 0 0% 0 0% 0 0% 1 5% 1 2% Lebanon 0 0% 0 0% 0 0% 1 5% 1 2% Sri Lanka 0 0% 1 6% 0 0% 2 10% 3 5% Taiwan 0 0% 1 6% 0 0% 0 0% 1 2% Asia 0 0% 2 11% 0 0% 9 45% 11 17% Belgium 2 11% 0 0% 1 13% 0 0% 3 5% Denmark 1 5% 0 0% 0 0% 0 0% 1 2% Finland 1 5% 0 0% 0 0% 0 0% 1 2% France 1 5% 0 0% 0 0% 0 0% 1 2% Germany 0 0% 0 0% 1 13% 0 0% 1 2% Greece 1 5% 0 0% 0 0% 0 0% 1 2% Italy 4 21% 0 0% 1 13% 1 5% 6 9% Ireland 0 0% 0 0% 0 0% 1 5% 1 2% Netherlands 1 5% 0 0% 0 0% 1 5% 2 3% Spain 1 5% 1 6% 0 0% 0 0% 2 3% Sweden 0 0% 4 22% 1 13% 1 5% 6 9% U.K. 2 11% 3 17% 2 25% 1 5% 8 12% Europe 14 74% 8 44% 6 75% 5 25% 33 51% Canada 2 11% 3 17% 0 0% 0 0% 5 8% U.S.A. 3 16% 1 6% 2 25% 6 30% 12 18% North America 5 26% 4 22% 2 25% 6 30% 17 26% Australia 0 0% 3 17% 0 0% 0 0% 3 5% New Zealand 0 0% 1 6% 0 0% 0 0% 1 2% Oceania 0 0% 4 22% 0 0% 0 0% 4 6% Total 19 100% 18 100% 8 100% 20 100% 65 100%
Nr. of countries per subject 11 46% 9 38% 6 25% 13 54% 24 100%
Total
ABC BSC TDABC TQM
Graph 7 - Distribution of Types of Article
Graph 8 - Distribution of Data Collection Methods
20 Associating the geographical source of the data used and the subject studied in the articles, we can better understand the interest of each country in each of the analysed MA&C systems in the healthcare context.
Observing table 2, we can see that the subject with most diversification of data origin is TQM, which has data from thirteen countries, but ABC is very close with data from eleven countries, BSC has data from nine countries and TDABC from six different countries. The country with most data used to study ABC in healthcare is Italy, with four articles in that subject, accounting for 21% of all data origin on this topic. BSC has the most data from Sweden, also with four articles with source on that country and accounting for 22% of data origin in BSC. TDABC has the same frequency in the U.K. and in the U.S.A. with two articles in each country, together accounting for 50% of data origin of this subject. Finally, TQM is more frequent in the U.S.A. with six articles and having this country accounting for 30% of its data origin.
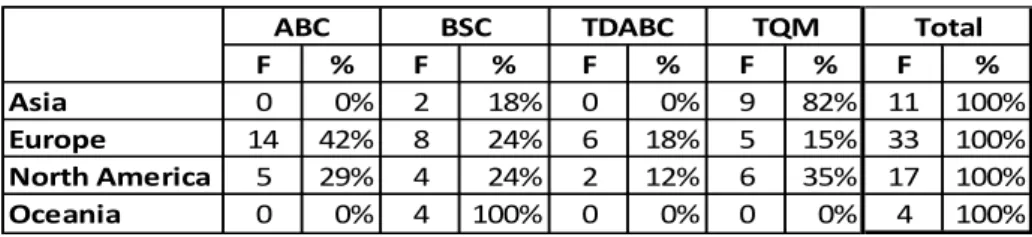
Of the ABC studies, 74% of data had origin in Europe and 26% originated from North America. As for BSC, it had 11% of data retrieved from Asia, 44% from Europe, 22% had origin in North America and 22% in Oceania. TDABC has 75% of its data source in Europe and 25% in North America. Finally, TQM has 45% of its data coming from Asia, 25% from Europe and 30% from North America. Graph 9 shows the distribution of MA&C systems per continent of data origin. Of the articles from Asia, 82% referred to TQM and 18% BSC. As for Europe, 42% of its sample was about ABC, 24% BSC, 18% TDABC and TQM accounted for 15%, while North America had 29% of its articles
about ABC, 24% about BSC, 12% TDABC and 35% about TQM. Lastly, all articles with data origin in Oceania studied the BSC (see Table 3).
21 F % F % F % F % F % Commentary 0 0% 0 0% 1 14% 0 0% 1 2% Research Article 12 86% 15 88% 5 71% 15 83% 47 84% Review Article 1 7% 2 12% 1 14% 0 0% 4 7% Theoretical Article 1 7% 0 0% 0 0% 3 17% 4 7% Total 14 100% 17 100% 7 100% 18 100% 56 100%
Types of article per subject 3 75% 2 50% 3 75% 2 50% 4 100%
ABC BSC TDABC TQM Total
F % F % F % F % F %
Asia 0 0% 2 18% 0 0% 9 82% 11 100%
Europe 14 42% 8 24% 6 18% 5 15% 33 100%
North America 5 29% 4 24% 2 12% 6 35% 17 100%
Oceania 0 0% 4 100% 0 0% 0 0% 4 100%
ABC BSC TDABC TQM Total
Table 3 – Association between Subject Studied and Continent of Data Origin
Table 4 - Association between Subject Studied and Type of Article
Graph 10 - Subject Studied per Type of Article Distribution
4.3.2) Type of Article and Subject
Studying the relationship between the type of article and the subject studied can be relevant in order to understand the type of research that has been performed in the different approaches that are being analysed in this review.
As mentioned before, the majority of the articles reviewed were research articles, accounting for 86% of the ABC articles, 88% of BSC, 71% of TDABC and 83% for TQM. There is only one commentary in the studied universe, which studies TDABC and accounts for 14% of the articles about this MA&C system. Review articles account for 7% of the ABC sample, 12% of BSC and 14% of TDABC. Lastly, there are four theoretical articles, one for ABC, accounting for 7% of ABC articles and three studying TQM, accounting for 17% of that sample. This information and distribution can be seen in table 4 and graph 10.
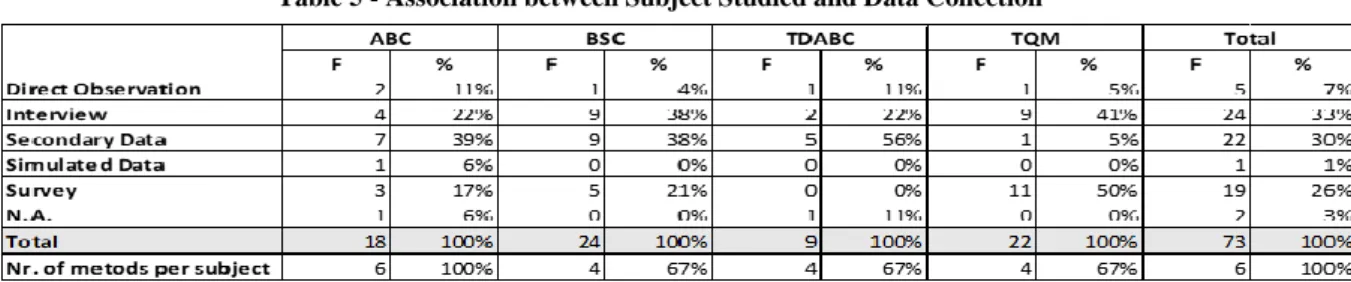
22 Table 5 - Association between Subject Studied and Data Collection
Method
Graph 11 - Subject Studied per Data Collection Method Distribution
4.3.3) Subject and Data Collection Method
Observing the association between the data collection methods and the subjects allows to identify which tools are more used depending on the MA&C systems studied.
In table 5 and graph 11 is possible to see that association. Regarding ABC, the most common data collection method is secondary data, accounting for 39% of the data for the articles of this subject, interview accounts for 22%, followed by survey with 11%, direct observation with 11%, one article using simulated data and another one that had no mention of the method used to collect information, accounting for 6% of the sample each. As for the BSC, the most common methods were equally the interview and secondary data, representing 9% of the sample each, survey was used in 5% of BSC articles and direct observation in 4%. TDABC used secondary data the most, 56% of the times, followed by interviews that explain 22% of the data for this subject and direct observation with 11%. One of the articles about TDABC had no mention of the data collection method, and that accounts for 11% of this sample. As for TQM articles, the survey is used in half of them, the interview in 41%, secondary data and direct observation were used 5% of the times each.
23 F % F % F % F % F % China 0 0% 0 0% 1 25% 0 0% 1 2% India 0 0% 2 4% 0 0% 0 0% 2 3% Iran 0 0% 1 2% 0 0% 0 0% 1 2% Japan 0 0% 0 0% 1 25% 0 0% 1 2% Jordan 0 0% 0 0% 1 25% 0 0% 1 2% Lebanon 0 0% 1 2% 0 0% 0 0% 1 2% Sri Lanka 0 0% 2 4% 0 0% 0 0% 2 3% Taiwan 0 0% 1 2% 0 0% 0 0% 1 2% Asia 0 0% 7 14% 3 75% 0 0% 10 16% Belgium 0 0% 3 6% 0 0% 0 0% 3 5% Denmark 0 0% 1 2% 0 0% 0 0% 1 2% Finland 0 0% 1 2% 0 0% 0 0% 1 2% France 0 0% 0 0% 0 0% 1 11% 1 2% Germany 0 0% 1 2% 0 0% 0 0% 1 2% Greece 0 0% 0 0% 1 25% 0 0% 1 2% Italy 0 0% 5 10% 0 0% 1 11% 6 10% Ireland 0 0% 1 2% 0 0% 0 0% 1 2% Netherlands 0 0% 1 2% 0 0% 1 11% 2 3% Spain 0 0% 2 4% 0 0% 0 0% 2 3% Sweden 0 0% 5 10% 0 0% 1 11% 6 10% U.K. 0 0% 6 12% 0 0% 1 11% 7 11% Europe 0 0% 26 53% 1 25% 5 56% 32 51% Canada 0 0% 3 6% 0 0% 2 22% 5 8% U.S.A. 1 100% 10 20% 0 0% 1 11% 12 19% North America 1 100% 13 27% 0 0% 3 33% 17 27% Australia 0 0% 2 4% 0 0% 1 11% 3 5% New Zealand 0 0% 1 2% 0 0% 0 0% 1 2% Oceania 0 0% 3 6% 0 0% 1 11% 4 6% Total 1 100% 49 100% 4 100% 9 100% 63 100%
Countries per article type 1 4% 19 79% 4 17% 8 33% 24 100%
Total Commentary Research Article Theoretical Article Review Article
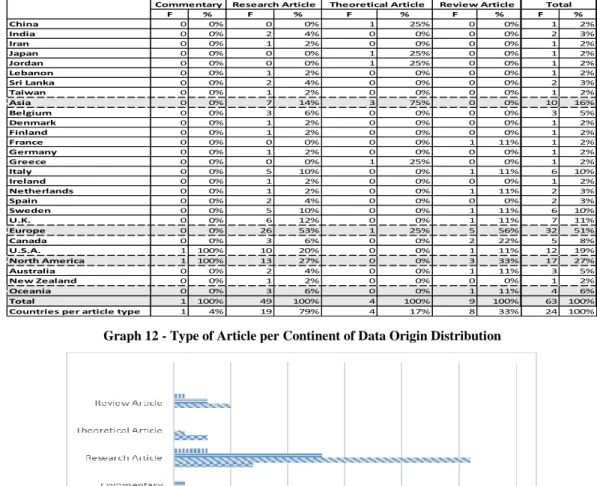
Table 6 - Association between Geographical Data Origin and Type of Article
Graph 12 - Type of Article per Continent of Data Origin Distribution
4.3.4) Data Origin and Type of Article
Table 6 presents the relationship between the geographical origin of the data and the type of article. Studying this association can show the type of research that is being conducted through different geographical areas. Research articles were the most used form of article, present in 79% of the countries in the sample, and with its highest incidence in Europe, which accounts for 41% of this type of article. Theoretical articles were used in 17% of the countries, that were China, Japan and Jordan, having Asia accounting for 75% of theoretical articles data, and Greece, with Europe accounting for the remaining 25% of data. Review articles were used in eight countries, France, Italy, Netherlands, Sweden and U.K., with 56% of data from Europe, Canada and U.S.A., having North America accounting for 33% of review articles’ data and Australia giving origin to 11% of this type’s data. Lastly the commentary was only used in the U.S.A.
24 Table 7 - Association between Data Collection Method and Geographical Data Origin
4.3.5) Data Origin and Data Collection Method
In this section the association between the geographical origin of the data and the data collection method is analysed in order to identify the preferred collection method from a geographical perspective. In table 7, it’s possible to verify that the countries that most used secondary data were Canada and the U.S.A. as 17% of the secondary data used was from the U.S.A. and other 17% form Canada. As for the surveys, they were mostly used in the U.S.A., with 26% of the surveys conducted in this country. Sweden was the country that used more Interviews as a tool for data collection, accounting for 22% of the interviews data and direct observation was used more frequently in Italy, accounting for 40% of direct observation data. As for simulated data, it was only used once, in Greece. Two articles, one performed in the U.K. and Germany and another in the U.S.A. had no mention of the data collection method used. From a continental perspective (see graph 13) it’s possible to verify that secondary data and surveys were used in all continents of the universe,
Interviews were used in all except Oceania, direct observation was only used in Asia and Europe and
simulated data was only used in Europe.
F % F % F % F % F % F % F % China 0 0% 0 0% 1 4% 0 0% 0 0% 0 0% 1 1% India 0 0% 2 11% 0 0% 0 0% 0 0% 0 0% 2 3% Iran 0 0% 1 5% 0 0% 0 0% 0 0% 0 0% 1 1% Japan 1 4% 0 0% 0 0% 0 0% 0 0% 0 0% 1 1% Jordan 1 4% 1 5% 0 0% 0 0% 0 0% 0 0% 2 3% Lebanon 0 0% 1 5% 0 0% 0 0% 0 0% 0 0% 1 1% Sri Lanka 0 0% 1 5% 2 9% 1 20% 0 0% 0 0% 4 5% Taiwan 0 0% 1 5% 0 0% 0 0% 0 0% 0 0% 1 1% Asia 2 8% 7 37% 3 13% 1 20% 0 0% 0 0% 13 17% Belgium 0 0% 2 11% 2 9% 1 20% 0 0% 0 0% 5 7% Denmark 1 4% 0 0% 0 0% 0 0% 0 0% 0 0% 1 1% Finland 1 4% 0 0% 0 0% 0 0% 0 0% 0 0% 1 1% France 1 4% 0 0% 0 0% 0 0% 0 0% 0 0% 1 1% Germany 0 0% 0 0% 0 0% 0 0% 0 0% 1 33% 1 1% Greece 0 0% 0 0% 0 0% 0 0% 1 100% 0 0% 1 1% Italy 3 13% 0 0% 4 17% 2 40% 0 0% 0 0% 9 12% Ireland 0 0% 0 0% 1 4% 0 0% 0 0% 0 0% 1 1% Netherlands 1 4% 1 5% 0 0% 0 0% 0 0% 0 0% 2 3% Spain 0 0% 1 5% 2 9% 0 0% 0 0% 0 0% 3 4% Sweden 3 13% 0 0% 5 22% 0 0% 0 0% 0 0% 8 11% U.K. 5 21% 2 11% 2 9% 1 20% 0 0% 1 33% 11 15% Europe 15 63% 6 32% 16 70% 4 80% 1 100% 2 67% 44 59% Canada 4 17% 1 5% 1 4% 0 0% 0 0% 0 0% 6 8% U.S.A. 4 17% 5 26% 4 17% 0 0% 0 0% 1 33% 14 19% North America 4 17% 5 26% 4 17% 0 0% 0 0% 1 33% 14 19% Australia 2 8% 1 5% 0 0% 0 0% 0 0% 0 0% 3 4% New Zealand 1 4% 0 0% 0 0% 0 0% 0 0% 0 0% 1 1% Oceania 3 13% 1 5% 0 0% 0 0% 0 0% 0 0% 4 5% Total 24 100% 19 100% 23 100% 5 100% 1 100% 3 100% 75 100%
Countries per method 13 54% 13 54% 10 42% 4 17% 1 4% 3 13% 24 100%
N.A. Total Secondary Data Survey Interview Direct Observation Simulated Data
25
5) Conclusions, Limitations and Suggestions for Further Research
Despite the search restrictions of the study, that only included articles from ABS ranked journals and that only uses three databases, the studied universe was composed of 54 articles, which shows that there have been some efforts in research of management accounting and control in healthcare. Also, a slight tendency to increase in the number of these publications shows the growing concern to face the managerial and sustainability problems in healthcare. Of the approaches analysed only TDABC still shows limited literature, which is
understandable considering that this system was only created in 2004.
Asia has a clearly higher concern with quality in healthcare, being that 82% of the articles from Asia were about TQM. The remaining articles from Asia were about the BSC, so in the sample studied, Asia showed no interest in researching costing systems in healthcare. Europe had research in all of the approaches, with greater concern with costing, given that the costing systems analysed accounted for 60% of the articles from Europe. North America had a
relatively even number of articles in all the subjects and Oceania had only articles regarding the BSC, showing a higher interest in performance in healthcare. There were no contributions from south America nor Africa for this review.
Research Article represented the majority of the article types in the universe studied and there are few reviews despite the considerable literature available. There are also scarce theoretical articles, but that would be expected considering that the systems studied have already
developed models.
There is a low use of direct observation as a data collection method, as it is used very few times in all of the subjects studied. It was mostly used for ABC and in Europe. Interviews were most used for TQM and in Europe, while secondary data was used the most for TDABC, accounting for 56% of its data, showing the still developing state of TDABC, and in Europe. Surveys were most used for TQM and in Asia.
26 Furthermore, this study presents some limitations. Firstly, only three databases were used to retrieve articles and only ABS ranked journals were used, so some potentially relevant research on the topic of this review was not considered for the study.
Only four management accounting and control systems were reviewed for the healthcare context, which is a relatively small number considering the variety of systems that exists, so the state of the art of these systems in healthcare is not rigorously contemplated.
Due to size restrictions of the study, there was no room for a descriptive analysis nor for further potential analysis, therefore there is the possibility for a more in-depth analysis of the universe of this study.
Moreover, this review provides a foundation for further research in the application of
management accounting and control in healthcare. Firstly, there is room to include a broader scope in order to include more MA&C systems in the study and therefore get an even better understanding of this subject in the healthcare context. A broader research criterion can also be applied to include articles outside the ABS rankings, that with the proper quality
evaluations can positively contribute for this topic’s research. TDABC shows a great potential for healthcare and a limited literature available, therefore more studies should be done on this subject.
Finally, this study also shows a gap in South American and African research, so further studies should include these geographical regions, as they could definitely benefit from more efficient healthcare.
6) References
Ahire, S. L., Landeros, R., & Golhar, D. (2009). Total Quality Management: A Literature Review And An Agenda For Future Research. Production and Operations Management, 4(3), 277-306. Aidemark, L.-G., & Funck, E. K. (2009). Measurement and Health Care Management. Financial
27 Aquilani, B., Silvestri, C., Ruggieri, A., & Gatti, C. (2017). A systematic literature review on total
quality management critical success factors and the identification of new avenues of research.
The TQM Journal, 29(1), 184-213.
Balakrisham, R., Pugely, A. J., & Shah, A. S. (2017). Modeling REsource Use with Time Equations: Empirical Evidence. Journal of Management Accounting Research, 29(1), 1-12.
Balakrishnan, R., Labro, E., & Sivaramakrishnan, K. (2012). Product Costs as Decision Aids: An Analysis of Alternative Approaches (Part 1). Accounting Horizons, 26(1), 1-20.
Bazzoli, G. J., Dynan, L., Burns, L. R., & Yap, C. (2004). Two Decades of Organizational Change in Health Care: What Have We Learned? Medical Care Research and Review, 61(3), 247-331. Bhimani, A., Horngren, C. T., Rajan, M., & Datar, S. M. (2015). Management and Cost Accounting.
Harlow: Pearson.
Cagwin, D., & J., B. M. (2002). The association between activity-based costing and improvement in financial performance. Management Accounting Research, 13(1), 1-39.
Cannavacciuolo, L., Maddalena, I., Ippolito, A., & Cristina, P. (2015). An activity-based costing approach for detecting inefficiencies of healthcare processes. Business Process Management
Journal, 21(1), 55-79.
Cardinaels, E., Roodhoof, F., & Herck, G. v. (2004). Drivers of cost system development in hospitals: results of a survey. Health Policy, 69(2), 239-252.
Cooper, R., & Kaplan, R. S. (1988). Measure Costs Right: Make the Right Decisions. Harvard
Business Review, 66(5), 96-103.
Demeere, N., Stouthuysen, K., & Roodhooft, F. (2009). Time-driven activity-based costing in an outpatient clinic environment: Development, relevance and managerial impact. Health Policy,
92(2-3), 296-304.
Drury, C. (2012). Management and Cost Accounting. Andover: CENGAGE Learning.
Eldenburg, L., & Krishnan, R. (2006). Management Accounting and Control in Health Care: An Economics Perspective. Handbook of Management Accounting Research, 2, 859-883. Gurd, B., & Gao, T. (2007). Lives in the balance: an analysis of the balanced scorecard (BSC) in
healthcare organizations. International Journal of Productivity and Performance, 57(1), 6-21. Jin, H., Munechika, M., Sano, M., Kajihara, C., Kaneko, M., & Guo, F. (2016). Operational process
improvement in medical TQM: a case study of human error in using devices. Total Quality
Management & Business Excellence, 27(8), 875–884.
Jonesa, T. C., & Dugdale, D. (2002). The ABC bandwagon and the juggernaut of modernity.
Accounting, Organizations and Society, 27(1-2), 121-163.
Kaplan, R. S., & Anderson, S. R. (2004). Time-Driven Activity-Based Costing. Harvard Business
Review, 82(11), 131-138.
Kaplan, R. S., & Anderson, S. R. (2007). Time-Driven Activity-Based Costing: A Simpler and More
28 Kaplan, R. S., & Norton, D. P. (1996). The Balanced Scorecard: Translating Strategy Into Action.
Boston: Harvard Business School Press.
Kaplan, R. S., & Porter, M. E. (2011). How to Solve The Cost Crisis In Health Care. Harvard
Business Review, 89(9), 47-64.
Kaplan, R. S., Witkowski, M. L., & Hohman, J. A. (2012). Boston Children's Hospital: Measuring Patient Costs. Harvard Business School Case, 86-112.
Keel, G., Savage, C., Rafiq, M., & Mazzocato, P. (2017). Time-driven activity-based costing in health care: A systematic. Health Policy, 121(7), 755-763.
Lachmann, M., Knauer, T., & Trapp, R. (2013). Strategic management accounting practices in hospitals: Empirical evidence on their dissemination under competitive market environments.
Journal of Accounting & Organizational Change, 9(3), 336-369.
Mosadeghrad, A. M. (2015). Developing and validating a total quality management model for healthcare organisations. The TQM Journal, 27(5), 544 - 564.
Porter, M. E., & Kaplan, R. S. (2011). The Big Idea: How to Solve the Cost Crisis in Health Care.
Harvard Business Review.
Ramji, B., J., P. A., & Shah, A. S. (2017). Modeling Resource Use with Time Equations: Empirical Evidence. Journal of Management Accounting Research, 29(1), 1-12.
Robin, C., & S., K. R. (1988). Measure Costs Right: Make the Right Decisions. Harvard Business
Review, 66(5), 96-103.
Stadhoudersa, N., Krusea, F., Tankea, M., Koolmanb, X., & Jeurissena, P. (2018). Effective healthcare cost-containment policies: A systematic review. Health Policy, 123(1), 71-79.
Sterling, R. R. (1967). A Statement of Basic Accounting Theory: A Review Article. Journal of
Accounting Research, 5(1), 95-112.
Tranfield, D., Denyer, D., & Palminder, S. (2003). Towards a Methodology for Developing Evidence-Informed Management Knowledge by Means of Systematic Review. British Journal of
Management, 14, 207-222.
Westcott, R. T. (2013). The certified manager of quality/organizational excellence handbook. Milwaukee: ASQ Quality Press.
Withanachchi, N., K.K.W., K., Pathirage, P., Tennakoon, N., & D.S.P., P. (2007). TQM emphasizing 5-S principles: A breakthrough for chronic managerial constraints at. International Journal of
Public Sector Management, 20(3), 168-177.
Woutersa, M. J. (1994). Decision orientation of activity-based costing. International Journal of