Volume 12 (2016) PROGRESS IN PHYSICS Issue 1 (January)
Power-Law Scaling of the Impact Crater Size-Frequency Distribution on Pluto:
A Preliminary Analysis Based on First Images from New Horizons’ Flyby
Felix Scholkmann
Research Office of Complex Physical and Biological Systems (ROCoS), Bellariarain 10, 8038 Z ¨urich, Switzerland E-mail: [email protected]
The recent (14th July 2015) flyby of NASA’s New Horizons spacecraft of the dwarf
planet Pluto resulted in the first high-resolution images of the geological surface-features of Pluto. Since previous studies showed that the impact crater size-frequency distribution (SFD) of different celestial objects of our solar system follows power-laws, the aim of the present analysis was to determine, for the first time, the power-law scaling behavior for Pluto’s crater SFD based on the first images available in mid-September 2015. The analysis was based on a high-resolution image covering parts of Pluto’s re-gionsSputnik Planum,Al-Idrisi MontesandVoyager Terra. 83 impact craters could be identified in these regions and their diameter (D) was determined. The analysis re-vealed that the crater diameter SFD shows a statistically significant power-law scaling (α = 2.4926 ± 0.3309) in the interval ofDvalues ranging from 3.75 ± 1.14 km to the largest determinedDvalue in this data set of 37.77 km. The value obtained for the scaling coefficientαis similar to the coefficient determined for the power-law scaling of the crater SFDs from the other celestial objects in our solar system. Further analysis of Pluto’s crater SFD is warranted as soon as new images are received from the spacecraft.
1 Introduction
The first close-up images of Pluto from NASA’s New Hori-zons spacecraft, received in mid-September 2015, show a complex surface structure of Pluto never seen before in this detail. During the spacecraft’s flyby of Pluto on 14th July 2015, images were taken by New Horizons’ Long Range Re-connaissance Imager (LORRI) with a cooled 1024 × 1024 pixel CCD camera from a distance of approx. 12,500 km making it possible to obtain high-resolution images of Pluto’s surface. Due to the slow transmission (about 1–2 Kbps), it will take around 16 months for all flyby images of Pluto to be received in full [1].
Many phenomena in astrophysics follow a power-law, i.e. the relationship between features exhibits a scale-invariance. Examples are the characteristics of the channel network on Mars [2], the relationship between solar flare occurrence and total flare energy [3], the correlation between a supermassive black hole mass and the host-galaxy bulge velocity dispersion (“M-sigma relation”) [4], the distribution of initial masses for a population of stars (“initial mass function”) [5], Kepler’s third law, or the distribution of galaxies in the universe [6–8]. Size-frequency distributions (SFD) of natural objects also follow in general a power-law. Examples are the SFD of frag-ment sizes due to a fragfrag-mentation process [9], the SFD of landslides [10], the particle SFD of volcanic ash [11], the mass distribution objects of the Kuiper belt [12] — or the SFD of impact crater diameters on celestial objects.
Already in 1940 Young showed that the impact crater SFD on the Earth’s Moon can be described by two power-laws with different scaling exponents. Further studies extended the analysis to other celestial objects, e.g. Earth [13], Mars
[14–16] and Mercury [17].
Due to the lack of high-resolution images available, it has not been possible until now to analyze the impact crater SFD of Pluto. With the first images now available from NASA’s New Horizons mission, the aim of the present paper was to conduct such a first, preliminary, analysis.
2 Materials and methods
2.1 Data
For the present analysis the raw images∗obtained by the New Horizons’ LORRI as of 14th September 2015 were visually inspected in order to find an image showing impact craters of Pluto with the highest resolution possible. An additional se-lection criterion was that the image had to be taken by LORRI at an angle capturing the region of interest maximally paral-lel to the camera, minimizing geometrical distortions of the features in the image.
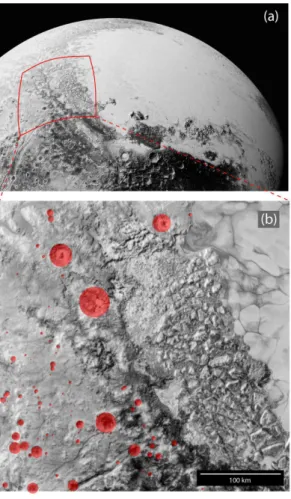
The image lor 0299174809 0x630 sci 4 (in the following denoted as LOR-0299174809) was selected as fulfilling these criteria (see Figure 1(b)). LOR-0299174809 displays a par-ticular area covering parts of Pluto’s regionsSputnik Planum, Al-Idrisi MontesandVoyager Terra. The image was taken by LORRI on 14thJuly 2015, 10:14:50 UTC, with an exposure time of 150 ms.
2.2 Determination of crater diameter values
The image LOR-0299174809 was analyzed in Adobe Illustra-tor (version CS5; Adobe Systems, CA, USA) by first visually
∗LORRI Images from the Pluto Encounter,
http://pluto.jhuapl. edu/soc/Pluto-Encounter
Issue 1 (January) PROGRESS IN PHYSICS Volume 12 (2016)
identifying the craters on the image and measuring their di-ameters (D). The obtained values were than rescaled to give the final values in the unit km. To do so, the information given on NASA’s website∗was used. Information on the website in-dicated that image number three (from top), which covers the region displayed in LOR-0299174809, is 470 km in width.
2.3 Statistical analysis
For the statistical analysis we used the mathematical frame-work provided by the Santa Fe Institute [18, 19]. The data were analyzed in Matlab (version 2010a; Mathworks Inc., Natick, MA, USA).
2.3.1 Estimation of the lower-bound and exponent of the power-law model
A quantityxshows power-law scaling if it stems from a prob-ability distributionp(x) ∼x−α, with the exponent
αdefining
the characteristics of the scaling. To test if an empirically obtained probability distribution follows a power-law, classi-cally a histogram is calculated and the distribution is analyzed on a doubly logarithmic plot. Sincep(x) ∼αln(x)+const.,
a power-law distributed quantityxfollows a straight line in the plot. Besides the fact that this method was (and is still) used to investigate power-law scaling of different quantities this approach can generate significant systematic errors [18]. Therefore, for the present analysis we used a framework pre-sented by Clauset et al. [18] that circumvents these errors and also offers the possibility of estimating the lower bound of the power-law (xmin). The determination of xmin is crucial when analyzing empirical data for power-law scaling since often the power-law behavior applies only for the tail region of the distribution, i.e. for values greater than the threshold valuexmin.
For the obtained crater diameter (D) data (=x) the power-law threshold valueDmin (= xmin) was determined based on the method described by Clauset et al. [18] which uses the Kolmogorow-Smirnov (KS) statistics. The scaling exponent
α was then calculated with a maximum likelihood fitting method also described by Clauset et al. [18].
2.3.2 Determination of the statistical significance of the power-law fit
In order to determine if the fitted power-law can be consid-ered statistically significant, a goodness-of-fit test described by Clauset et al. [18] was employed. To this end, power-law distributed synthetic data was generated with values ofαand
xmin that are equal to the values obtained by fitting the em-pirical data to the power-law model. Each synthetic data set is than fitted to the model and the KS statistics determined. Based on the occurrences of times the KS statistic is larger
∗http://tinyurl.com/n9k5mmc
than for the empirical values, a p-value is calculated. For p<0.1 the fit of the power-law model to the empirical data
is considered to be statistically not significant, i.e. it can be ruled out that the empirical distribution obeys a power-law scaling. Thus, the p-value in this case represents a measure of the hypothesis that is tested for validity. A high value ofp corresponds to a good fit.
3 Results, discussion and conclusion
83 impact craters could be identified and their diameter val-ues were determined, ranging from 0.84 km to 37.77 km. Using the obtained 83Dvalues and the methods described in Section 2.3.1, the scaling coefficientαwas determined to
be α = −2.4926±0.3309 and the scaling threshold value to be Dmin = 3.75±1.14 km. Thus, for D in the range [3.75±1.14 km,37.77 km] the values follow a power-law. The log-likelihood (L) of the dataD>Dminunder the fitted power law was determined to beL=104.5688.
The statistical test, as described in Section 2.3.2, employ-ing 10,000 synthetic data sets revealed a pvalue of 0.2241. Thus, according the test the hypothesis cannot be refuted that the data follows a power-law, i.e. Pluto’s crater SFD shows a power-law scaling. Figure 1(c) visualizes the power-law be-havior of the crater SFD.
How do the results of the presented analysis relate to the findings about characteristics of the crater SFD of other celes-tial objects? As mentioned in the introduction, it well estab-lished that the crater SFD of all investigated celestial bodies in our solar system exhibit a power-law scaling.
For example, according to an analysis performed by Robertson and Grieve from 1975 the crater SFD of the Earth is characterized byα ≈ −2 (for D > 8 km) [13]. An own analysis using the updated data of impact craters on Earth (n = 188) based on the Earth Impact Database† revealed
α=2.0286 (forD>7 km). The Earth Moon’s crater SFD has been intensively investigated since the 1940’s when Young [20] initially showed that for largeDthe crater SFD follows a power-law withα=−3, and for smallDthe scaling is de-scribed byα=−1.5. Subsequent studies described the scal-ing with laws governed byα=2 (forD=[∼2 km,70 km])
[21], as well asα = −2 (for D < 100 m) andα = −2.93
(for D >a few 100 m) [22], for example. Further
stud-ies showed that the scaling-relations of the lunar crater SFD need to include the observation that multiple power-laws are necessary to describe the whole SFD spectrum, i.e. α
de-pends on D [23, 24]. A solution for optimally fitting the crater SFD was described based on the idea of using a poly-nomial function to fit the SFD data in the log-log space, i.e. it could be shown that a polynomial function of 7th degree fit the data well forD = [300 m,20 km]. The polynomial function included an extra term accounting for the fact that the scaling function also depends on the geological
charac-†http://www.passc.net/EarthImpactDatabase
Volume 12 (2016) PROGRESS IN PHYSICS Issue 1 (January)
Fig. 1: (a) View of Pluto taken in July 2015 by LORRI on board NASA’s New Horizons spacecraft. In the field of view the west-ern lobe of the Tombaugh region is depicted. (b) LORI im-age lor0299174809 0x630 sci 4 showing a particular area covering parts of Pluto’s regionsSputnik Planum,Al-Idrisi Montesand Voy-ager Terra. (c) Visualization of the power-law scaling of the impact crater size distribution. P(D): complementary cumulative distribu-tion funcdistribu-tion;D: crater diameter. Images (a) and (b) were obtained from NASA, Johns Hopkins University Applied Phsics Laboratory, Southwest Research Institute.
teristics of the region investigated — a finding also made by other studies (e.g., [24–26]). For an extended range ofD, in later work a 11thdegree polynomial function was published by Neukum [27] valid forD = [10 m,300 km] and
cover-ing scalcover-ing exponents in the range ofα = [−1,4]. For the
Martian satellites Phobos and Deimos, the crater SFD was determined as being described by a power-law withα ≈1.9
forD=[44 m,10 km] [16].
Thus, the finding of the present analysis concerning the power-law characteristics (i.e.,α=2.4926±0.3309 forD= [3.75±1.14 km,37.77 km]) of the crater SFD of Pluto is comparable to the power-laws observed for the other celestial bodies. That Pluto’s diameter scaling forD<3.75± 1.14km
does not follow theα = −2.4926 scaling relies most
prob-ably on the fact that small craters are much faster deterio-rated due to erosion and that counting of craters with small Dwas not perfectly possible due to the limited resolution of the available image. The lowestDvalue (3.75±1.14 km) for
which the power law holds might interpreted as related to a transition from simple to complex craters. Interestingly, such a “transition diameter” was predicted for Pluto to be in the range of 4–5 km [28–30].
This analysis, of course, should be regarded only as a pre-liminary study for further follow-up as soon as the full set of images from Pluto is available and the images have been pro-cessed to deliver a high-resolution picture of Pluto’s surface morphology. A limitation of the present analysis is that only one high-resolution image with sufficient craters was avail-able. It was therefore only possible to obtain a relatively low number of crater diameter values (n=83).
Knowledge of Pluto’s crater SPF will not only give in-sights in the universality of the crater SFD scaling relations but necessarily will also help in the understanding of the his-tory of Pluto and the characteristics of the Kuiper belt which Pluto is part of.
Acknowledgements
I thank Rachel Scholkmann for proofreading the manuscript, and the New Horizons project team at the Johns Hopkins Uni-versity Applied Physics Laboratory for discussion concerning the copyright status of the publicly released LORRI images.
Submitted on October 15, 2015/Accepted on November 6, 2015
References
1. Rienzi G. How exactly does New Horizons send all that data back from Pluto? Available from: http://hub.jhu.edu/2015/07/17/ new-horizons-data-transmission
2. Caldarelli G., De Los Rios P., Montuori M., Servedio V.D.P. Statistical features of drainage basins in mars channel networks.The European Physical Journal B, 2004, v. 38 (2), 387–391.
3. Hudson H.S. Solar flares, microflares, nanoflares, and coronal heating.
Solar Physics, 1991, v. 133 (2), 357–369.
4. Ferrarese L., Merritt D. A fundamental relation between supermassive black holes and their host galaxies.The Astrophysical Journal, 2000, v. 539 (1), L9–L12.
Issue 1 (January) PROGRESS IN PHYSICS Volume 12 (2016)
5. Kroupa P., Weidner C., Pflamm-Altenburg J., Thies I., Dabringhausen J., Marks M., Maschberger T. The stellar and sub-stellar initial mass function of simple and composite populations. InPlanets, Stars and Stellar Systems, Oswalt T.D., Gilmore G. (Editors), 2013, Springer Netherlands, 115–242.
6. Watson D.F., Berlind A.A., Zentner A.R. A cosmic coincidence: The power-law galaxy correlation function. The Astrophysical Journal, 2011, v. 738 (1), 1–17.
7. Baryshev Y.V., Labini F.S., Montuori L., Pietronero L., Teerikorpi P. On the fractal structure of galaxy distribution and its implications for cosmology.Fractals, 1998 v. 6 (3), 231–243.
8. Joyce M., Sylos Labini F., Gabrielli A., Montuori M., Pietronero L. Ba-sic properties of galaxy clustering in the light of recent results from the Sloan Digital Sky Survey.Astronomy&Astrophysics, 2005, v. 443 (1), 11–16.
9. Turcotte D.L. Fractals and fragmentation.Journal of Geophysical Re-search, 1986, v. 91 (B2), 1921–1926.
10. Stark C.P., Hovius N. The characterization of landslide size distribu-tions.Geophysical Research Letters, 2001, v. 28 (6), 1091–1094.
11. Wohletz K.H., Sheridan F., Brown W.K. Particle size distributions and the sequential fragmentation/transport theory applied to volcanic ash.
Journal of Geophysical Research, 1989, v. 94 (B11), 15703–15721.
12. Bernstein G.M., Trilling D. E., Allen R. L., Brown K. E., Holman M., Malhotra R. The size distribution of transneptunian bodies.The Astro-physical Journal, 2004, v. 128 (3), 1364–1390.
13. Robertson P.B., Grieve R.A.F. Impact structures in Canada — Their recognition and characteristics.The Journal of the Royal Astronomical Society of Canada, 1975, v. 69, 1–21.
14. Bruckman W., Ruiez A., Ramos E. Earth and Mars crater size frequency distribution and impact rates: Theoretical and observational analysis.
arXiv:1212.3273, 2013.
15. Barlow N.G. Crater size-frequency distributions and a revised martian relative chronology.Icarus, 1988, 75, 285–305.
16. Thomas, P. Veverka, J. Crater densities on the satellites of Mars.Icarus, 1980, v. 41, 365–380.
17. Strom R.G., Chapman C.R., Merline W.J., Solomon S.C., Head J.W. Mercury cratering record viewed from Messergner’s first flyby.Science, 2008, v. 321 (5885), 79–81.
18. Clauset A., Shalizi C.R., Newman M.E.J. Power-law distributions in empirical data.SIAM Review, 2009, v. 51 (4), 661–703.
19. Virkar Y., Clauset A. Power-law distributions in binned empirical data.
Annals of Applied Statistics, 2014, v. 8 (1), 89–119.
20. Young, J., A Statistical Investigation of Diameter and Distribution of Lunar Craters.Journal of the British Astronomical Association, 1940, v. 50, 309–326.
21. Cross C.A. The size distribution of lunar craters.Monthly Notices of the Royal Astronomical Society, 1966, v. 134, 245–252.
22. Shoemaker E.M., Hait M.H., Swann G.A., Schleicher D.L., Dahlem D.H., Schaber G.G., Sutton R.L. Lunar regolith at tranquillity base.
Science, 1970, v. 167 (3918), 452–455.
23. Chapman C.R., Haefner, R.R. A critique of methods for analysis of the diameter-frequency relation for craters with special application to the Moon.Journal of Geophysical Research, 1967, v. 72 (2), 549–557.
24. Neukum G., K ¨onig B., Arkani-Hamed J. A study of lunar impact crater size-distributions.The Moon, 1975, v. 12 (2), 201–229.
25. Baldwin R.B. On the history of lunar impact cratering: The absolute time scale and the origin of planetesimals.Icarus, 1971, v. 14, 36–52.
26. Head J.W., Fassett C.I., Kadish S.J., Smith D.E., Zuber M.T., Neu-mann G.A., Mazarico E. Global distribution of large lunar craters: implications for resurfacing and impactor populations.Science, 2010, v. 329 (5998), 1504–1507.
27. Neukum, G. Meteoritenbombardement und Datierung planetarer Oberfl¨achen.Habilitationsschrift. 1983, M¨unchen, Germany: Univer-sit¨at M¨unchen.
28. Moore J.M., Howad A.D., Schenk P.M., McKinnon W.B., Pappalardo R., Ryan E., Bierhaus E.B., et al. Geology before Pluto: Pre-encounter considerations.Ikarus, 2014, v. 246, 65–81.
29. Bray V.S., Schenck P.M. Pristine impact crater morphology on Pluto — Expectations for New Horizons.Icarus, 2015, v. 246, 156–164. 30. Zahnle K., Schenk P., Levison H., Donnes L. Cratering rates in the outer
Solar System.Icarus, 2003, v. 163, 263–289.