MARIA DEL ROSARIO GONZÁLEZ-RODRIGUEZ
Professor at Universidad de Sevilla, Departamento de Economía Aplicada – Sevilla, Spain
ROSARIO MARTÍN-SAMPER [email protected]
Professor at Universidad de Sevilla, Departamento de Contabilidad y Economía Financiera – Sevilla, Spain
ANTONIO CARLOS GIULIANI [email protected]
Professor at Universidade Metodista de Piracicaba, Programa de Pós Graduação em Administração – Piracicaba – SP, Brazil
ARTICLES
Submitted 04.24.2014. Approved 09.03.2014
Evaluated by double blind review process. Scientiic Editor: Francisco Javier Rondán Cataluña
EVALUATING THE EFFICIENCY
PROGRESS WITH TECHNOLOGY IN A
SPANISH HOTEL CHAIN
Avaliando o progresso da eficiência com tecnologia em uma cadeia de hotéis
espanhola
Evaluando el progreso de la eficiencia con tecnología en una cadena de
hoteles española
ABSTRACT
This paper analyzes the changes in the total factor productivity index of a Spanish hotel chain in the period from 2007 to 2010 with the purpose of identifying eiciency patterns for the chain in a period of inancial crisis. The data envelopment analysis (DEA) Malmquist productivity index was used to esti-mate productivity change in 38 hotels of the AC chain. Results reveal AC hotels’ eiciency trends and, therefore, their competitiveness in the recession period; they also show the changes experienced in these hotels’ total productivity and its components: technological and eiciency changes. Positive eiciency changes were due to positive technical eiciency rather than technological eiciency. The recession period certainly inluenced the performance of AC Hotels, which focused on organizational changes rather than investing in technology.
KEYWORDS | Eiciency, productivity, data envelopment analysis, Malmquist index, Spanish hotel chains.
RESUMO
Este artigo analisa as mudanças no fator total de produtividade de uma cadeia de hotéis na Espa-nha, no período de 2007-2010, com o propósito de identificar os padrões da cadeia em um período de crise financeira. O índice data envelopment analysis (DEA) Malmquist de produtividade foi usado para estimar a mudança da produtividade nos 38 hotéis da AC Cadeia de Hotéis. Os resultados reve-laram as tendências de eficiência e competitividade da AC Hotéis em um período de recessão, bem como as mudanças vivenciadas na produtividade total e, consequentemente, em seus componentes de eficiência e tecnológicos. O período de recessão influenciou, sem dúvida, o comportamento da AC Hotéis, que buscou mais mudanças organizacionais do que tecnológicas.
PALAVRAS-CHAVE | Eficiência, produtividade, data envelopment analysis, índice Malmquist, cadeia de hotéis espanhola.
RESUMEN
Este artículo analiza los cambios del índice de productividad del factor total de una cadena de hoteles españoles en el periodo de 2007 hasta 2010, con el propósito de identificar patrones de eficiencia para la cadena en un periodo de crisis financiera. El índice de productividad data envelopment analy-sis (DEA) Malmquist fue utilizado para estimar el cambio de productividad en 38 hoteles de la cadena AC. Los resultados revelan las tendencias de la eficiencia de los hoteles AC y, por lo tanto, su com-petitividad en el periodo de recisión; ellos también demuestran los cambios experimentados en la productividad total de eses hoteles y sus componentes: cambios de eficiencia y tecnológicos. Cambios de eficiencia positivos se debieron más bien a eficiencias técnicas positivas que a eficiencias tecno-lógicas. El periodo de recesión ciertamente ha influenciado los Hoteles AC, que enfocaron más en los cambios organizacionales que en invirtiendo en tecnología.
PALABRAS CLAVE | Eficiencia, productividad, data envelopment analysis, índice Malmquist, cadenas de hoteles española.
INTRODUCTION
The tourism industry is a pillar of the Spanish economy. Accord-ing to Exceltur (2008), Spain is the second country in the world in number of international tourists (7 percent of total tourist ig-ures) and holds the same position in tourism revenues.
In the years before the inancial crisis, new internal and exter-nal factors helped the Spanish tourism sector, particularly receptive tourism, thus producing good overall business results. Promotional eforts made by central, regional, and municipal administrations explain part of this tourism bonanza in terms total arrival igures. On the other hand, the strength of domestic demand (though already showing signs of a slow-down), acute geopolitical instability in Spain’s main competitor countries in the “sun and sand” product category, increased European family spending, and a decrease in fuel prices helped to raise the inlux of tourists in Spanish resorts.
In the 2007-2010 period, the Spanish tourism situation was a very diferent one, as it was severely afected by the national and global economic and inancial crisis. The period was marked by a decrease in the dynamism of Spain’s tourism activity, caused by a plunge in both foreign and domestic demand.
Although 2007 marked the beginning of the crisis, it ended with a positive balance for the sector, as tourism businesses in general showed a moderate demand increase, with a 2.3 per-cent growth in overnight stays (Instituto Nacional de Estadística, 2007), which meant a moderate increase in sales and proits. This improvement in business proitability was due not only to the increase in sales, but also to the implementation of a less aggressive pricing policy to ensure occupancy and, particularly, a progressive improvement in cost management (Exceltur, 2008).
In the 2008-2009 period, the Spanish tourism sector was afected by the inancial crisis much more severely than the Span-ish economy as a whole, with a 5.6 percent drop in the tourism GDP. The close of 2009 showed an accumulated two-year decrease in sales and proits in most Spanish tourism businesses (Excel-tur, 2009). Spanish hotels could not go unharmed through the overall demand fall that afected all of the links in the tourism value chain. In a scenario with little sign of a recovery towards pre-crisis levels of demand, managers at these hotels urgently implemented cost reduction plans and eiciency measures for managing both structural and operational costs.
In 2010, tourism activities overcame what was a complex situation characterized by economic weakness and problems in accessing credit. In aggregate terms, tourism GDP grew moder-ately by 1 percent, and was accompanied by a moderate growth in sales, while cost reductions achieved by good cost manage-ment (Exceltur, 2010) helped guaranteeing revenues. The hotel sub-sector was involved in the resurgence of foreign demand,
helping to begin the recovery in overnight stays compared to the previous two years (Instituto Nacional de Estadística, 2009). In the context of tourism activities, the survival of the hotel sub-sector has deinitely been characterized by eicient resource management. The sub-sector had to improve its com-petitiveness by looking to best practices in the industry, which led to superior performance (Cano, Drummond, Miller, & Barclay, 2001). Performance assessment is an important way to incorpo-rate competitive marketing stincorpo-rategies, improve service quality, and ensure a better combination of inputs and outputs. Though the eiciency of decision units can be assessed using parametric and/or non-parametric techniques, data envelopment analysis (DEA) is one of the most widely used non-parametric tools to analyze eiciency in the hotel sub-sector (Anderson, Fish, Xia, & Michello, 1999; Barros, 2004;Morey & Dittman, 1995).
The Spanish hotel sector is comprised mainly of city hotels and resorts (sun and sand) aimed at a wide range of tourist segments. This study analyses the impact of the crisis period on the eiciency of a particular model of city hotels by determining whether they responded through organizational and/or technological changes in order to improve eiciency levels. The total-factor productivity (TFP) index was used, as well as its decomposition in technical ei-ciency and technological change. The AC Hotels chain was chosen because it has a strategy that varies with the location of each hotel in the chain, and because of the chain’s continuous innovation, ren-ovation, and infrastructure maintenance practices, using its own design team to ensure customers’ needs are met. In 2010, AC Hotels formed a joint venture with leading US company Marriott Interna-tional. Through this joint venture, the AC Hotels by Marriott brand was created to manage the chain. AC Hotels by Marriott is committed to a clear diferentiation in its products and services by reinforc-ing the chain’s characteristics, investreinforc-ing in new technologies such communication, management, and direct sales to customers. The inclusion of AC Hotels in Marriot’s new distribution channels and marketing tools will help the chain to increase its visibility to inter-national travelers, as well as learn the tastes and preferences of its customers in order to ofer them personalized services.
LITERATURE REVIEW
The use of benchmarking techniques plays an increasingly important role for irms in determining the eicient allocation of resources. DEA has been widely used for more than a decade as an eiciency analysis tool for studying the tourism sector, and is also used as a highly useful internal and external benchmark-ing technique between businesses in the sector (Barros, 2005b; Chiang, Tsai, & Wang, 2004;Morey & Ditman, 1995; Sigala, 2003; Wu, Tsai, & Zhou, 2011).
The travel agent industry faces a change of paradigm due to the role played by technological development, business competi-tion, concentracompeti-tion, and disintermediation. These emerging trends require identifying the factors that help agents increase their per-formance through the formulation of adequate strategies, allowing them to compete and survive in a higher competitive market
(Barros & Dieke, 2007; Barros & Matias, 2006; Bell & Morey, 1994, 1995; González & Martín, 2012; Wöber, 2000). The applicability of eiciency analysis has been also justiied in the restaurant sector due to its inherent competition, which is inluenced by variety in location, neighbourhood characteristics, and menus ofered. In fact, this analysis seems to be even more important for restau-rant chains, where establishments share the same goals through identical menus, operating procedures, design, and technology. DEA analysis allows identifying the best performing units bench-marked against less eicient ones, therefore providing valuable information to managers so they can allocate available resources properly (Banker & Monrey, 1986; Donthu, Hershberger, & Osm-onbekok, 2005; Hruschaka, 1986;Reynolds, 2004; Reynolds & Thompson, 2007).
Assessing service performance in hotels has become an important issue in the service industry. Hotels frequently face diiculties to counterbalance supply and demand due to their inherent characteristics as inseparability, intangibility, hetero-geneity, simultaneity and perishability. This requires making accurate decisions about the maximum amount of inputs to be reduced and the marketing strategies to be implemented in order to attract the maximum number of customers, given the available service capacities. Because both technical and allocation ei-ciencies provide practitioners with a good knowledge of overall eiciency, they justify the increasing interest in eiciency anal-ysis in the hotel sector. Therefore, most eiciency studies in the hotel sector were conducted in the 2000-2010 period. From 2011 to the present, ive studies were reviewed base on which we can assume that applying DEA analysis to the hotel industry will con-tinue to be of interest to researchers.
However, we can see some degree of geographic concen-tration, particularly in Taiwan’s hotel industry (Shang, Wamg, &
Hung, 2010; Ting & Huang, 2012; Wang, Hung, & Shang, 2006a, 2006b; Wu, Liang, & Song,2010; Wu et al., 2011), the USA (Hu & Cai, 2004;Morey & Dittman, 2003; Reynolds, 2004; Wöber & Fesenmaier, 2004; ) and in Portugal (Barros, 2005a, 2005b, 2006; Barros & Mascarenhas, 2005; Barros & Santos, 2006).
Most eiciency studies have focused their analysis on a sample of hotels, taking into account the use of inputs and the generation of speciic outputs. In general, the inputs that appear in the literature concern factors such as size, labour, cap-ital, and technology/organizational aspects. With regard to size, the inputs most commonly used are the number of rooms, the size or area used for each hotel service, and assets volume, all of which are used as indicators of capital. As to the labour factor, staing costs are widely used, comprising the number of employ-ees and other operating costs as an indicator of the necessary expenses involved. The most widely used outputs are total reve-nue and the revereve-nue generated by each activity or service, such as accommodation, food and beverages, and others (Chiang et al., 2004; Hu & Cai, 2004;Morey & Dittman, 2003; Shang et al., 2010, Wu et al., 2010, 2011). Occupancy or the number of beds sold are also widely used as output (Alonso de Magdaleno et al., 2009; Barros, 2004, 2005a, 2005b; Barros & Alves, 2004; Barros & Mascarenhas, 2005; Keh, Chu, & Xu, 2006;Shang et al., 2010; Sigala, 2003; Wu et al., 2010). Authors such as Sigala (2003), Fuchs (2004) and Chen (2007) have taken into account outputs such as customer satisfaction indexes and the Yielding Index (Chiang et al., 2004; Fuchs, 2004).
Although most studies analyze the eiciency of a sample of hotels for a speciic year, very few are longitudinal studies. These studies assess the eiciency of companies over a period of time, as well as any changes in technical and technological eiciency experienced by hotels, using the Malmquist produc-tivity index (Barros, 2005b, 2006; Barros & Alves, 2004; Hwang & Chang, 2003;Tsaur, 2001).
METHOD
subse-quent models, such as the super-eiciency model (Andersen & Petersen, 1993) and non-radial measure models (Ali, Lerme, & Seiford, 1995). Other DEA developments include Malmquist’s total factor productivity (TFP) index, developed by Swedish stat-istician Malmquist (1953). The Malmquist index appears to be an ideal eiciency measure when working with panel data, as it is key to consider changes over time in the process of eiciency measurements. The Malmquist productivity index produces an eiciency measure for a particular year in relation to the previ-ous, while allowing the best frontier to shift (usually upwards). TFP growth measures how much productivity grows or declines over time. The TFP index divides productivity changes in techni-cal eiciency change (EFFch) and technologitechni-cal change (TECHch). In this study, technical eiciency change refers to growth in a hotel’s productivity by using existing technology and economic inputs more eiciently. Technological change refers to growth in total factor productivity (TFP) as a result of improvements in tech-nology and innovations in the hotel’s system.
In order to analyze productivity growth, the Malmquist index compares two periods in time. For periods t=1, 2,…, T, the technology set can be expressed by the feasible combinations of inputs and outputs, according to the following expression:
St/ x,y
^ hyxcan producey
" ,
Thus, the Malmquist index based on the output distance function is deined as:
dT^xt,yth/ inf i: xt, i
1yt
` j ! St
9 C
Where x is a vector of inputs; y is a vector of outputs; St
is the technology set; superscript T is the technology reference period (T=t or T=t+1); and 1/θ is the amount by which outputs for year t could have been increased given the inputs used, if tech-nology for year T had been fully utilized.
dT is the reciprocal of Farell’s output-oriented eiciency
index. If a decision-making unit sits on the eiciency frontier, dT
will be 1; if it is below the frontier, it will not be eicient, and dT
will be less than 1.
The same decision-making unit for period t+1 (xt+1 , yt+1) can
be compared with the technology for period t:
dT xt,yt
^ h/ inf i: xt + 1, i
1yt + 1
` j ! St
9 C
The new distance can be 1 if DMU with data for period t+1 is eicient regarding technology at t; otherwise, it will be less than 1. Distance can also have a value greater than 1 if the unit with inputs and outputs at t+1 is not feasible with the technology at t.
Thus, Caves, Christensen, and Diewert (1982) deined the Malmquist index at t as the ratio:
MT xt + 1,yt + 1,xt,yt
^ h=
DT xt,yt
^ h
DT^xt + 1,yt + 1h
Where Mt > 1 indicates an increase in productivity for period t+1 in relation to period t, Mt = 1 shows the opposite, and Mt = 1
indicates that productivity has remained constant. The Malmquist index for t+1 is deined as the ratio:
MT + 1 xt + 1,yt + 1,xt,yt
^ h=
DT + 1 xt,yt
^ h
DT + 1^xt + 1,yt + 1h
To avoid arbitrarily using one of the periods as a reference,
Färe, Grosskopf, and Lavel (1994) sought to measure the Malm-quist index as a geometric mean of such indices, and calculated the reference technologies for both year t and year t+1 as:
M xt + 1,yt + 1,xt,yt
^ h=
DT xt,yt
^ h
DT^xt + 1,yt + 1h
>
h
DT + 1 xt + 1,yt + 1
^ h
DT xt + 1,yt + 1
^ h
$
DT + 1 xt,yt
^ h
DT + 1 xt + 1,yt + 1
^ h
> H
1/2
The ratio outside the brackets is the index of change in technical eiciency between year t and t+1 (i.e. the change in the distance between observed production and current maxi-mum feasible production). The bracketed term is the index of change in technology (innovation) between two periods evalu-ated at xt and xt+1.
Thus, the Malmquist TFP index can be written as:
M xt + 1,yt + 1,xt,yt
^ h= TFP = EFFch * TECHch
However, an improvement in TFP does not mean an enhancement in both technical eiciency and technological change.
Technical eiciency change can be further divided in two sub-components: pure technical eiciency change (PEch) and scale eiciency change (SEch), as follows:
EFFch=PEch * SEch, and therefore TFP=PEch*SEch*TECHch
ei-ciency change captures the DMU position in the VRS technology frontier in relation to the optimum in the constant returns to scale variable (CRS) frontier, and measures to what extent DMUs can take advantage of returns to scale by altering their size towards optimal scale (Färe et al., 1994). The third component, TECHch, shows the (normally upward) shift in the variable returns-to-scale frontier.
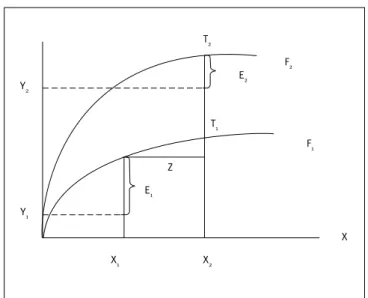
Figure 1.
Technological change and technical eiciency
T2
F2
F1 E2
Y2
Y1
X1 X2
E1 Z
X T1
Growth in production over time (t to t+1) can be interpreted with regard to technological and technical eiciency changes as shown in Figure 1 (Barros, 2005a). Best-practices hotels experi-ence technological changes in a period of time as a consequexperi-ence of investments in innovation. In addition to new technologies, the innovations adopted can be also procedures, techniques and methodologies. Technological advances move eicient produc-tion frontiers upwards from F1 to F2. T1 and T2 represent maximum production with technology 1 and 2 respectively, given an input X2. Technical eiciency corresponds to a better allocation of resources without waste, and, therefore, a consistent movement towards the best-practice frontier for any time. From a dynamic perspective (from year t to t+1), a technical eiciency change reveals a change between two successive technical eiciency frontiers. While positive pure technical eiciency changes are consequences of investments in organizational factors and better hotel management such as improvement in quality and better balance between inputs and outputs, scale eiciency change occurs when a hotel achieves optimal sales, leading to econo-mies of scale (Färe et al., 1994). Total grow production between
t and t+1 (Y2-Y1) is the result of three efects: input growth (Z=X2 -X1), technological eiciency change (T2-T1) and technical eiciency change (E2-E1): (Y2-Y1)=Z+( T2-T1)+ (E2-E1).
DATA COLLECTION
To estimate the production frontier, a balanced panel data obtained from Sistema de Análisis de Balances Ibéricos (SABI) was used for the 2007-2010 period. SABI is a database created by Informa, a irm that has been collecting annual accounts from major Spanish and Portuguese companies since 1990. It is an interesting, useful tool for business analysis such as comparisons between companies or company groups, rankings, concentration and segmentation analysis, and sectorial studies.
The study period is of great interest for the tourism sector as, in terms of economy, it covers the end of the upward trend in 2007 and the beginning of recession in 2008 (Instituto de Estudios Turísticos, 2011). This period allows analyzing how businesses have reacted to the change in trends from very favorable to a sit-uation of recession such as the one they faced then. We chose 2007 as the analysis’ initial year because it comprises a relevant change in accounting standards that occurred in Spain at the time. This ensures that all data for the period were produced with the same criteria and are therefore homogeneous and comparable for all units in the sample. The horizon considered was the broad-est allowed by the database, and the latbroad-est data for most of the businesses selected are from 2010.
For this study, we chose the AC Hotels chain as it is con-sidered one the most important Spanish chains, characterized by continual innovation, renovation, and infrastructure mainte-nance, using its own design team to ensure customer’s needs and expectations are met. Knowing AC Hotels’ eiciency pattern during the recession period is relevant not only to the irm’s man-agers but also to other practitioners who can learn from AC Hotels’ experiences. On the other hand, data available from SABI for AC Hotels in the analyzed period allow adequate statistical analysis and, therefore, reliable conclusions. The number of hotels whose complete data are available at SABI meets the criteria suggested by Cooper, Seiford, and Tone(2001):
DMU ≥ max {m x s, 3 (m + s)}
Where m is the number of inputs and s the number of out-puts in the analysis.
The non-parametric models for estimating the production frontier required appropriate identiication and measuring of inputs (resources) and outputs (transformation of the resources) in order to be used in the analysis. The variables in the article were selected according to the literature reviewed and the infor-mation available at the SABI database.
pro-duction activity. Variable assets represent capital factor and investments in equipment (Alonso de Magdaleno et al., 2009;
Barros, 2005a, 2005b); personnel expenses represent the labour factor (Alonso de Magdaleno et al., 2009; Barros & Alves, 2004; Davutyan, 2007;Morey & Dittman, 1995); and material costs represents the input material (Yu & Lee, 2009; Sigala & Mylon-aki, 2005). The output selected is related to the irm’s capacity
to generate proits from the service provided. The variable Total Operating Income is generally considered a concrete measure-ment showing that an organization has reached its economic goals (Anderson et al., 1999; Hu & Cai, 2004; Yang & Lu, 2006). We wrote the DEA module in the Stata software in order to com-pute the Malmquist productivity index for Spanish AC Hotels (Ji & Lee, 2010; Lee, 2011).
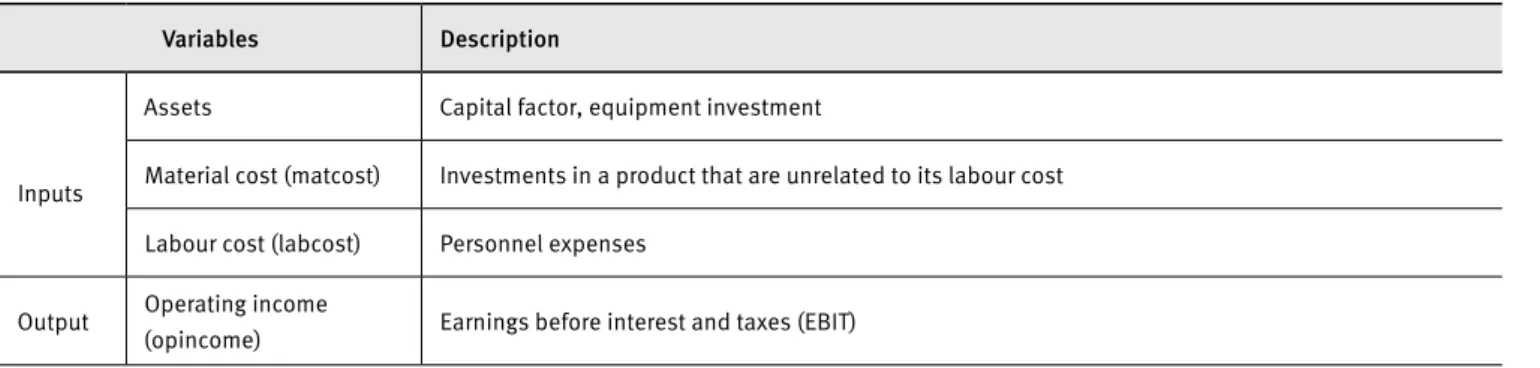
Exhibit 1.
Inputs and output in the eiciency analysis
Variables Description
Inputs
Assets Capital factor, equipment investment
Material cost (matcost) Investments in a product that are unrelated to its labour cost
Labour cost (labcost) Personnel expenses
Output Operating income
(opincome) Earnings before interest and taxes (EBIT)
Table 1 shows the main descriptive statistics and the selected inputs and output.
Table 1.
Descriptive statistics table: inputs-output 2007-2010
2007 2008
Variable Mean Std. Dev Min Max Mean Std. Dev Min Max
o_opincome 2,848,895 2,791.117 1,146 18,266 2,679.368 2,618.906 971 17,328
i_matcost 259.026 218.7151 56 1,421 234 254.319 52 1249
i_labcost 712.578 578.3971 347 3,791 766.105 666.917 367 4,412
i_assets 7417 5,098.65 702 19,173 7,202.737 4,920.66 799 18,309
2009 2010
Variable Mean Std. Dev Min Max Mean Std. Dev Min Max
o_opincome 2,074.921 1,980.023 853 13,110 2,216.158 2,188.061 823 14,228
i_matcost 197.533 185 30 954 191.211 217.969 24 1061
i_labcost 667.079 554.497 307 3,672 656.421 514.111 280 3402
i_assets 6,716.105 4,561.172 733 18,005 6,466.632 4,529.712 702 17,636
RESULTS AND DISCUSSION
on this question: “By how much can input quantities be propor-tionally reduced without changing output quantities?” Whereas the output-oriented approach addresses the following question: “By how much can output quantities be proportionally expanded
without altering input quantities?”
Because the hospitality industry is characterized by max-imizing outputs for a particular quantity of inputs, the present study used the output-based approach. Output-oriented eiciency measurements are suitable if we assume hotels to behave in an oligopolistic way (Barros, 2005a).
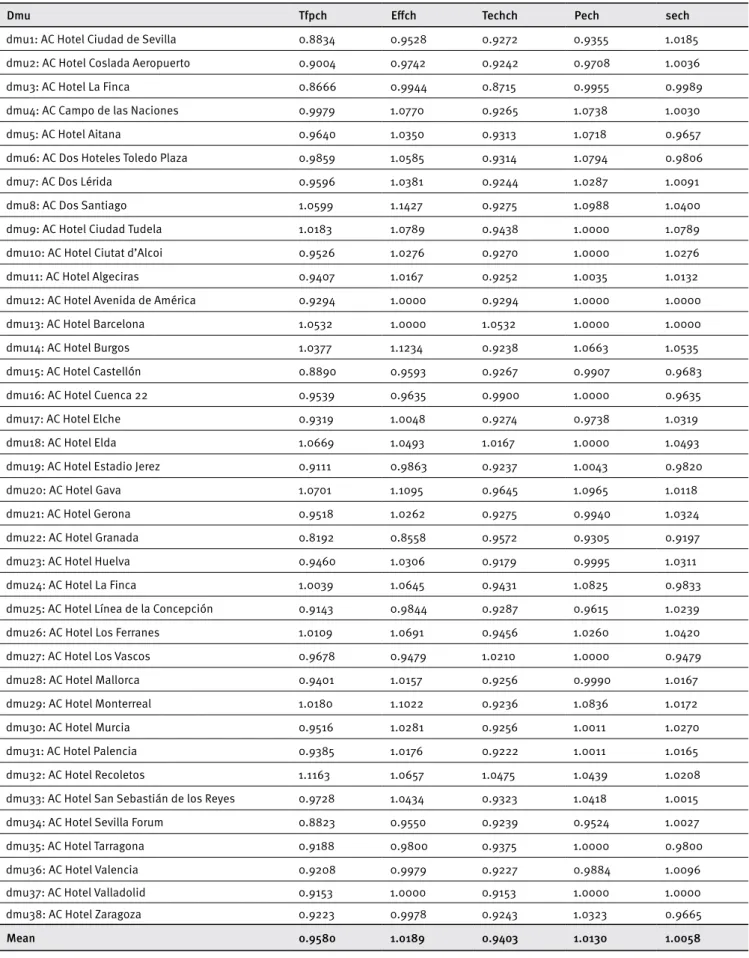
Based on the output-oriented DEA-Malmquist productivity index, Table 2 shows the estimation for the total factor produc-tivity change (TFPch), as well as its components, i.e., technical eiciency change (EFFch) (‘catch-up’ component) and technolog-ical change (TECHch) (innovation or frontier-shift component) for the 2007-2010 period. The study consisted of analyzing which part of the total productivity factor change can be attributed to eiciency change, and which part to technological change, causing a shift in the productive frontier. Technical eiciency changes require decision-making units to allocate resources with-out wasting. These requirements imply better investment planning, improved technical expertise, and improved hotel management and organization. Technological change reveals a change in tech-nology as a consequence of innovation and of new technologies being adopted by best practices hotels.
On average, dmu32 recorded the highest TFP growth with 11.62%, and dmu22 the lowest TFP growth, with an 18 percent drop. Overall, the mean TFP change score during the period was 0.9580, which means the hotels’ TFP dropped by 4.2 per-cent. Ten of 38 hotels experienced a positive TFP change (TFP>1), whereas the remainder had no additional productivity over the period (TFP<1). Therefore, most of the hotels experienced total productivity decline. Technical eiciency change for the period was above 1 (EFch>1), while technological eiciency change was below 1 (TECHch), revealing that, for the 2007-2010 period, these hotels improved their management and organization rather than invested in new technologies or innovations, in order to adapt to recession. The variation in inputs used by the hotels shows that, during the period, they improved their organizational fac-tors and reallocated resources by decreasing inputs, particularly labour and material costs. This outcome for the AC chain corrob-orates the general performance of the hotel sector. Faced with an accumulated decrease in sales and proits, hotel managers had to implement cost-reduction plans and eiciency measures in order to manage structural and operational costs.
Table 2 also shows the division of technical eiciency (TECHch) in pure technical (pech) and scaling eiciency (sech). The hotels’ diferent combinations of technical eiciency and
scal-ing eiciency show that, on average, AC hotels had improvements in both pure (pech>1) and scale eiciency (sech). The improve-ment in pure technical eiciency meant that hotels invested in organizational factors such as marketing initiatives, improve-ments in service quality, better investment planning, superior technical experience, and a better balance between inputs and outputs, among others. Improvements in scale eiciency meant that the establishments reached a size according to the number of rooms that allowed them economies of scale.
Based on Table 2, and according to Barros (2005a), this study identiies four combinations of technical eiciency and technological changes, dividing AC Hotels’ units among the cor-responding eiciency quadrants (Figure 2):
Quadrant 1 contains hotels where technical eiciency improvements occurred in combination with technological change improvements. In the irst group, two hotels are included (dmu18, dmu32), representing Spain’s best-performing hotels in 2007-2010. These hotels not only upgraded their organizational factor to allo-cate inputs properly in order to obtain maximum outputs, but also showed particular interest in innovation through new investments. Quadrant 2 includes 19 hotels where technical eiciency improvements occurred in parallel with a decline in technolog-ical change (dmu4, dmu5, dmu6, dmu7, dmu8, dmu9, dmu10, dmu11, dmu17, dmu20, dmu21, dmu23, dmu24, dmu26, dmu28, dmu29, dmu30, dmu31 and dmu33). Once the right input-output balance is reached, this study recommends for these hotels to acquire new technologies or introduce new practices in order to add value to their products or services.
Quadrant 3 contains two hotels and is characterized by a declining technical eiciency and improvements in technolog-ical change (dmu27). These hotels invested in technology but failed to reach the right input-output balance. They may need to upgrade organizational factors such as marketing strategies, qual-ity improvement, and a better input-output balance.
Finally, Quadrant 4 includes 12 hotels where a declining technical eiciency occurred in combination with a decrease in technological change (dmu1, dmu2, dmu3, dmu15, dmu16, dmu19, dmu22, dmu25, dmu34, dmu35, dmu36 and dmu38). These hotels had the lowest TFP score and are, therefore, the most ineicient in the sample. To improve their productivity they would have to upgrade their organizational factors, thus ensuring the right input-output balance, and invest in new technologies or meth-ods to enhance their organizational skills.
Table 2.
Malmquist productivity index, AC Hotels - 2007-2010
Dmu Tfpch Efch Techch Pech sech
dmu1: AC Hotel Ciudad de Sevilla 0.8834 0.9528 0.9272 0.9355 1.0185
dmu2: AC Hotel Coslada Aeropuerto 0.9004 0.9742 0.9242 0.9708 1.0036
dmu3: AC Hotel La Finca 0.8666 0.9944 0.8715 0.9955 0.9989
dmu4: AC Campo de las Naciones 0.9979 1.0770 0.9265 1.0738 1.0030
dmu5: AC Hotel Aitana 0.9640 1.0350 0.9313 1.0718 0.9657
dmu6: AC Dos Hoteles Toledo Plaza 0.9859 1.0585 0.9314 1.0794 0.9806
dmu7: AC Dos Lérida 0.9596 1.0381 0.9244 1.0287 1.0091
dmu8: AC Dos Santiago 1.0599 1.1427 0.9275 1.0988 1.0400
dmu9: AC Hotel Ciudad Tudela 1.0183 1.0789 0.9438 1.0000 1.0789
dmu10: AC Hotel Ciutat d’Alcoi 0.9526 1.0276 0.9270 1.0000 1.0276
dmu11: AC Hotel Algeciras 0.9407 1.0167 0.9252 1.0035 1.0132
dmu12: AC Hotel Avenida de América 0.9294 1.0000 0.9294 1.0000 1.0000
dmu13: AC Hotel Barcelona 1.0532 1.0000 1.0532 1.0000 1.0000
dmu14: AC Hotel Burgos 1.0377 1.1234 0.9238 1.0663 1.0535
dmu15: AC Hotel Castellón 0.8890 0.9593 0.9267 0.9907 0.9683
dmu16: AC Hotel Cuenca 22 0.9539 0.9635 0.9900 1.0000 0.9635
dmu17: AC Hotel Elche 0.9319 1.0048 0.9274 0.9738 1.0319
dmu18: AC Hotel Elda 1.0669 1.0493 1.0167 1.0000 1.0493
dmu19: AC Hotel Estadio Jerez 0.9111 0.9863 0.9237 1.0043 0.9820
dmu20: AC Hotel Gava 1.0701 1.1095 0.9645 1.0965 1.0118
dmu21: AC Hotel Gerona 0.9518 1.0262 0.9275 0.9940 1.0324
dmu22: AC Hotel Granada 0.8192 0.8558 0.9572 0.9305 0.9197
dmu23: AC Hotel Huelva 0.9460 1.0306 0.9179 0.9995 1.0311
dmu24: AC Hotel La Finca 1.0039 1.0645 0.9431 1.0825 0.9833
dmu25: AC Hotel Línea de la Concepción 0.9143 0.9844 0.9287 0.9615 1.0239
dmu26: AC Hotel Los Ferranes 1.0109 1.0691 0.9456 1.0260 1.0420
dmu27: AC Hotel Los Vascos 0.9678 0.9479 1.0210 1.0000 0.9479
dmu28: AC Hotel Mallorca 0.9401 1.0157 0.9256 0.9990 1.0167
dmu29: AC Hotel Monterreal 1.0180 1.1022 0.9236 1.0836 1.0172
dmu30: AC Hotel Murcia 0.9516 1.0281 0.9256 1.0011 1.0270
dmu31: AC Hotel Palencia 0.9385 1.0176 0.9222 1.0011 1.0165
dmu32: AC Hotel Recoletos 1.1163 1.0657 1.0475 1.0439 1.0208
dmu33: AC Hotel San Sebastián de los Reyes 0.9728 1.0434 0.9323 1.0418 1.0015
dmu34: AC Hotel Sevilla Forum 0.8823 0.9550 0.9239 0.9524 1.0027
dmu35: AC Hotel Tarragona 0.9188 0.9800 0.9375 1.0000 0.9800
dmu36: AC Hotel Valencia 0.9208 0.9979 0.9227 0.9884 1.0096
dmu37: AC Hotel Valladolid 0.9153 1.0000 0.9153 1.0000 1.0000
dmu38: AC Hotel Zaragoza 0.9223 0.9978 0.9243 1.0323 0.9665
Figure 2.
Quadrants of eiciency for Spanish AC hotels -
2007-2010
Q2
dmu4, dmu5, dmu6, dmu7, dmu8, dmu9, dmu10, dmu11, dmu17, dmu20, dmu21, dmu23, dmu24, dmu26, dmu28, dmu29, dmu30, dmu31 and dmu33
Q1
dmu18, dmu32
Q3
dmu27
Q4
dmu1, dmu2, dmu3, dmu15, dmu16, dmu19, dmu22, dmu25, dmu34, dmu35, dmu36 and dmu38
Technological change
Tec
hnic
al
eic
iency
c
h
an
g
e
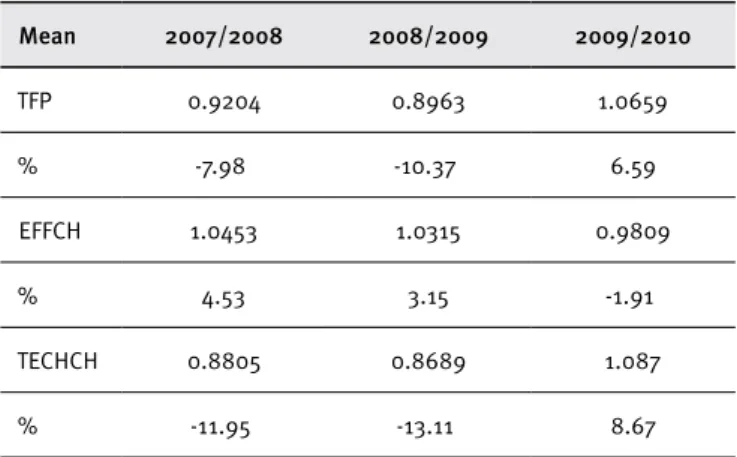
Because diferent trends can be seen for the 2007-2010 period with regard to how hotels adapted to the crisis, the changes in total productivity (TFP) and in technical and technological eiciency have to be analyzed for the three sub-periods, i.e., 2007-2008, 2008-2009, and 2009-2010. Table 3 shows the efect of the crisis irst becoming apparent in 2007-2008, whereas the biggest drop in total productivity occurred in 2008-2009. In addition, we can see that TFP dropped mainly because of technological ei-ciency, decreasing by 11.95% and 13.11% respectively in those two sub-periods. This reveals the negative impact of inancial crisis and, therefore, the diiculties to invest in new technologies (pro-cedures, techniques, methodologies, and skills upgrades) in the hotel system. The slight growth in 2009-10 (6.59%) relects the beginning of Spain’s tourism sector recovery, as well as improve-ments in how the sector adapted to the recession period in the Spanish economy.
Table 3.
Eiciency trend growth for AC hotels, 2007-2010
Mean 2007/2008 2008/2009 2009/2010
TFP 0.9204 0.8963 1.0659
% -7.98 -10.37 6.59
EFFCH 1.0453 1.0315 0.9809
% 4.53 3.15 -1.91
TECHCH 0.8805 0.8689 1.087
% -11.95 -13.11 8.67
The analysis of productivity changes for these 38 hotels in the 2007-2010 period corroborates the growth trend observed in Table 3. Results are shown in Table 4.
Table 4.
Productivity changes 2007-2010
2007/2008 TFPch EFFCH TECH
Positive changes 7/38 22/38 1/38
Negative changes 31/38 11/38 37/38
No change 0/38 4/38 0/38
2008/2009
Positive changes 8/38 20/38 2/38
Negative changes 30/38 11/38 36/38
No change 0/38 6/38 0/38
2009/2010
Positive changes 30/38 14/38 38/38
Negative changes 8/38 18/38 0/38
No change 0/38 6/38 0/38
Table 4 suggests that seven hotels in 2007-2008 and eight hotels in 2008-2009 had positive eiciency changes (TFPch>1). Only two hotels (AC GAVE and AC FERRANES) improved their ei-ciency over both periods. In the 2009-10 period, 30 hotels out of 38 had positive eiciency changes, mostly because of positive technological changes, indicating an improvement in technol-ogy and innovation in these hotels. In 2010, AC Hotels merged with Marriott International, creating a joint brand – AC Hotels by Marriot – to manage the former’s hotels. As results in Table 3 show, the new brand begins to be typiied by a clear commitment to investing in new technologies, particularly regarding com-munication channels, management, and direct customer sales. This investment via innovation improves the brand’s visibility to international travelers while helping to learn the tastes and pref-erences of its customers in order to ofer personalized services.
CONCLUSIONS
Since 2008, the Spanish tourism sector in general and the hotel sub-sector in particular have been afected by the inancial crisis much more severely than the Spanish economy as a whole. To halt the decline in tourism and hotel activities, one of the main problems facing the industry has been the need to improve its international competitiveness.
Hotels’ eiciency growth rates for the 2007-2010 period were analyzed with regard to changes in accounting rules and the aforementioned economic and inancial recession. We chose the Spanish chain AC Hotels (city hotels) for our analysis of hotel eiciency because of city hotels’ poor performance in the above period when compared with resorts.
The indings of this study can be briely concluded as fol-lows. Firstly, the study reveals how the eiciency of the analyzed hotels changed in the 2007-2010 period and what factors deter-mined the changes. The overall mean for total productivity change was negative at 0.9580, as a result of a negative change in tech-nological eiciency and a positive change in technical eiciency. During the studied period, the hotels were able to improve their organizational factors through better resource reallocation, by decreasing their inputs, particularly labour and food and bever-ages costs. A total 22 hotels out of 38 had a positive technical eiciency change, whereas only four hotels recorded a positive technological change. Only two hotels changed both organiza-tional and technological aspects positively. The recession period certainly afected AC Hotels’ performance, which resorted to orga-nizational changes rather than investing in technology. This result for the AC chain corroborates the overall hotel sector performance. Faced with an accumulated decrease in sales and proits, hotel managers had to implement cost-reduction plans, as well as the organizational changes mentioned above.
Eiciency analysis provides some advantages from a man-agement viewpoint. The Malmquist productivity index allows managers to identify strategically important hotels. These hotels where technical eiciency occurred in parallel with technological eiciency change seem to be the ones with highest capabilities and inherent competence to thrive rather than just survive in a highly competitive environment. Technique also identiies hotels with room for improvement in best practices, either by investment in innovation to reverse technology decline or by inding the right input-output balance (against technical eiciency decline). Ei-ciency analysis can serve as both guidance and encouragement to hotel managers, prompting them to evaluate their performance while improving decision making towards innovation and organi-zational factors in order to increase products and service value.
Trends in eiciency growth were also analyzed by sub-peri-ods. Results show a negative change in productivity and a positive change in technical eiciency for 2007-2008 and 2008-2009, whereas positive changes in total factor productivity and tech-nological eiciency were found in 2009-2010, as well as a small negative change in 2009-2010. Results are in accordance with the situation that characterized the Spanish hotel sector, which suf-fered a deep recession in 2008 and 2009, and a slight recovery in 2010 mostly because of a rebound in foreign demand. However,
this demand was also driven by innovations in the hotel sub-sec-tor regarding special ofers and reduced hotel rates.
The Spanish tourism sector was going through a decline in activities before the period of national and international economic crisis. This situation called for a new approach to the sector and for modernization of its traditional characteristics. The hotel sub-sec-tor was in need of a major innovation efort to allow improvements in the quality of places available and services provided, as well as signiicant investments in promotional and advertising campaigns. The efort made by the AC Hotels chain in 2010 to improve techno-logical eiciency relects the subsector’s need to adapt and innovate, and it certainly has to continue improving not only in terms of orga-nizational factors – through marketing campaigns, better resource allocation, and staf skills upgrading – but also in terms of technolog-ical factors – through innovation and investments in new procedures and techniques, which will help them improve results.
LIMITATIONS AND FUTURE RESEARCH
One of the limitations of this paper is the fact that results are based on a short period, i.e., 2007-2010, although one of great rel-evance as it was particularly challenging for the Spanish economy and for service sector practitioners. In 2010, Marriott Interna-tional and AC Hotels merged to form a hotel joint venture and new co-brand, AC by Marriott. AC by Marriott focuses on incor-porating AC Hotels’ concept and business model of a urban-style, four-star hotel product, characterized by quality, comfort, design, and technology, combined with Marriott International’s global systems, distribution, and sales platforms. Based on this new situation, a future study will focus on analyzing the efects of AC by Marriot joint venture on eiciency. Interviews with AC hotel managers are likely to be necessary in order to understand the merger and acquisition process and determine what has changed, considering the situations before and after the process. Using both qualitative and quantitative techniques should add further value to the study. Because eiciency analysis cannot identify the external or internal variables causing ineiciency, econometric models are also necessary, and will be conducted in the future.
REFERENCES
Ali, A. I., Lerme, C. S., & Seiford, L. M. (1995). Components of eiciency evaluation in data envelopment analysis. European Journal of Opera-tional Research, 80(3), 462-473. doi:10.1016/0377-2217(94)00131-U
Andersen, P., & Petersen, N. C. (1993). A procedure for ranking eicient units in data envelopment analysis. Management Science, 39(10), 1261-1264. doi:10.1287/mnsc.39.10.1261
Anderson, R., Fish, M., Xia, Y., & Michello, E. (1999). Measuring eicien-cy in the hotel industry: A stochastic frontier approach. International Journal of Hospitality Management, 8(1), 45-57. doi:10.1016/S0278-4319(98)00046-2
Banker, R. D., Charnes, R. F., & Cooper, W. W. (1984). Some models for estimating technical and scale ineiciencies in data envelopment analysis. Management Science, 30(9), 1078-1092. doi:10.1287/ mnsc.30.9.1078
Barros, C. (2004). A stochastic cost frontier in the Portu-guese hotel industry. Tourism Economics, 10(2), 177-192. doi:10.5367/000000004323142416
Barros, C. (2005a). Evaluating the eiciency of a small hotel chain with a Malmquist productivity index. International Journal of Tourism Re-search, 7(3), 173-184. doi:10.1002/jtr.529
Barros, C. (2005b). Measuring eiciency in the hotel sector. Annals of Tourism Research, 32(2), 456-477. doi:10.1016/j.annals.2004.07.011
Barros, C. P., & Alves, F. P. (2004). Productivity in the tourist industry. International Advances in Economic Research, 10(3), 215-225.
Barros, C. P., & Dieke, P. U. C. (2007). Performance evaluation of Italian airports: A data envelopment analysis. Journal of Air Transport Man-agement, 13(4), 184-191. doi:10.1016/j.jairtraman.2007.03.001
Barros, C., & Mascarenhas, M. J. (2005). Technical and allocative ei-ciency in a chain of small hotels. International Journal of Hospitality Management, 24(3), 415-436. doi:10.1016/j.jhm.2004.08.007
Barros, C. P., & Matias, A. (2006). Assessing the eiciency of travel agen-cies with a stochastic cost frontier: A Portuguese case study. Interna-tional Journal of Tourism Research, 8(5), 367-379. doi:10.1002/jtr.578
Barros, C. P., & Santos, C. A. (2006). The measurement of eicien-cy in Portuguese hotels using Data Envelopment Analysis. Jour-nal of Hospitality and Tourism Research, 30(3), 378-400. doi: 10.1177/1096348006286798
Bell, R. A., & Morey, R. C. (1994). The search for appropriate partners: A macro approach and application to corporate travel management. Omega, 22(5), 477-490. doi:10.1016/0305-0483(94)90029-9
Bell, R. A., & Morey, R. C. (1995). Increasing the eiciency of corporate travel management through macro benchmarking. Journal of Travel Research, 33(3), 11-20. doi:10.1177/004728759503300303
Cano, M., Drummond, S., Miller, C., & Barclay, S. (2001). Learning from others: Benchmarking in diverse tourism enterprises. Total Quality Management, 12(7-8), 974-980. doi:10.1080/09544120100000023
Caves, D. W., Christensen, L. R., & Diewert, W. E. (1982). The economic theory of index numbers and the measurement of input, output, and productivity. Econometrica, 50(6), 1393-1414. doi:10.2307/1913388
Charnes, A., Cooper, W., & Rhodes, E. (1978). Measuring the eiciency of decision making units. European Journal of Operational Research, 2(6), 429-444. doi:10.1016/0377-2217(78)90138-8
Chen, C. (2007). Applying the stochastic frontier approach to measure hotel managerial eiciency in Taiwan. Tourism Management, 28(3), 696-702. doi:10.1016/j.tourman.2006.04.023
Chiang, W., Tsai, H., & Wang, L. (2004). A DEA evaluation of Taipei ho-tels. Annals of Tourism Research, 3(3), 712-715. doi:10.1016/j.an-nals.2003.11.001
Cooper, W. W., Seiford, L. M., & Tone, K. (2001). Data envelopment anal-ysis: A comprehensive text with models, applications, references and DEA-solver software. Kluwer Academic Publishers: Boston.
Davutyan, N. (2007). Measuring the quality of hospitality at Antalya. International Journal of Tourism Research, 9(1), 51-57. doi:10.1002/ jtr.580
Donthu N., Hershberger, E. K., & Osmonbekok, T. (2005). Benchmark-ing marketBenchmark-ing productivity usBenchmark-ing data envelopment analysis. Jour-nal of Business Research, 58(11), 1474-1482. doi:10.1016/j.jbus-res.2004.05.007
Exceltur. (2008). Perspectivas turísticas. Balance 2007 y perspectivas para 2008. Informe Perspectivas Turísticas Exceltur n. 23, Madrid.
Exceltur. (2009). Perspectivas turísticas. Balance 2008 y perspectivas para 2009. Informe Perspectivas Turísticas Exceltur n. 31, Madrid.
Exceltur. (2010). Perspectivas turísticas. Balance 2009 y perspectivas para 2010. Informe Perspectivas Turísticas Exceltur n. 32, Madrid.
Färe, E., Grosskopf, S., & Lavel, C. A. K. (1994). Production frontiers. New York: Cambridge University Press.
Farrell, M. J. (1957). The measurement of productive eiciency. Journal of the Royal Statistical Society, 120(3), 253-290. doi:10.2307/2343100
Fuchs, M. (2004). Strategy development in tourism destinations: A data envelopment analysis approach. Poznan Economics Review, 4(1), 52-73.
González, R. M. R., & Martín, S. R. (2012). Analysis of the eiciency of Spanish travel agencies. Electronic Journal of Applied Statistical Analysis, 5(1), 77-92. doi:10.1285/i20705948v5n1p60
Hruschka, H. (1986). Ansätze der eizienzmessung von betrieben. Jour-nal für Betriebswirtschaft, 36(2), 76-85.
Hu, B. A., & Cai, L. A. (2004). Hotel labour productivity assessment: A data envelopment analysis. Journal of Travel & Tourism Marketing, 16(2-3), 27-38. doi:10.1300/j073v16n02_03
Hwang, S., & Chang, T. (2003). Using data envelopment analysis to mea-sure hotel managerial eiciency change in Taiwan. Tourism Manage-ment, 24(4), 357-369. doi:10.1016/s0261-5177(02)00112-7
Instituto de Estudios Turísticos. (2011). Balance del turismo en España. Resultados de la actividad turística. Ministerio de Industria y Comer-cio, España.
Instituto Nacional de Estadística. (2007). Coyuntura turística hotelera. Madrid, España.
Instituto Nacional de Estadística. (2009). Coyuntura turística hotelera. Madrid, España.
Ji, Y., & Lee, C. (2010). Data envelopment analysis. Stata Journal, 10(2), 267-280.
Shahroudi, S., & Dery, M. (2011). Assessment of the eiciency of Guilan province’s hotels using two-stage DEA method. Australian Journal of Basic & Applied Sciences, 5(9), 1495-1502.
Keh, H. T., Chu, S., & Xu, J. (2006). Eiciency, efectiveness and pro-ductivity of marketing in services. European Journal of Operational Research, 170(1), 265-276. doi:10.1016/j.ejor.2004.04.050
Lee, C. (2011). Malmquist productivity analysis using DEA frontier in Stata. Stata Conference, Chicago.
Morey, R., & Dittman, D. (1995). Evaluating a hotel GM’s performance. The Cornell Hotel Restaurant and Administration Quarterly, 36(5), 30-35. doi:10.1016/0010-8804(95)92248-l
Morey, R., & Dittman, D. A. (2003). Update and extension to ‘evaluat-ing a hotel GM’s performance’. The Cornell Hotel and Restaurant Administration Quarterly, 44(5-6), 60-68. doi:10.1016/s0010-8804(03)90108-x
Reynolds, D. (2004). An exploratory investigation of multiunit restau-rant productivity assessment using data envelopment analysis. Journal of Travel & Tourism Marketing, 16(2-3), 19-26. doi:10.1300/ j073v16n02_02
Reynolds, D., & Thompson, G. (2007). Multiunit restaurant productivity assessment using three-phase data envelopment analysis. Interna-tional Journal of Hospitality Management, 26(1), 20-32. doi:10.1016/j. jhm.2005.08.004
Shang J. K., Wang F. C., & Hung, W. T. (2010). A stochastic DEA study of hotel eiciency. Applied Economics, 42(19), 2505-2518. doi:10.1080/00036840701858091
Sigala, M. (2003). The information and communication technologies productivity impact on the UK hotel sector. International Jour-nal of Operations & Production Management, 23(10), 1224-1245. doi:10.1108/01443570310496643
Sigala, M., & Mylonaki, J. (2005). Developing a data envelopment anal-ysis model for measuring and isolating the impact of contextual fac-tors on hotel productivity. International Journal of Business Perfor-mance Management, 7(2), 174-190. doi:10.1504/jbpm.2005.006489
Ting, C. T., & Huang, C. W. (2012). Measuring the efectiveness of mutual learning for Taiwan’s tourist hotels with the DEA approach. Cornell Hospitality Quarterly, 53(1), 65-74. doi:10.1177/1938965511425364
Tsaur, S. (2001). The operating eiciency of international tourist ho-tels in Taiwan. Asia Pacific Journal of Tourism Research, 6(1), 73-81. doi:10.1080/10941660108722090
Wang, F. C., Hung, W. T., & Shang, J. K. (2006a). Measuring pure mana-gerial eiciency of international tourist hotels in Taiwan. The Service Industries Journal, 26(1), 59-71. doi:10.1080/02642060500358860
Wang, F. C., Hung, W. T., & Shang, J. K. (2006b). Measuring the cost ef-iciency of international tourist hotels in Taiwan. Tourism Economics, 12(1), 65-85. doi:10.5367/000000006776387150
Wöber, K. W. (2000). Benchmarking hotel operations on the internet: A data envelopment analysis approach. Information Technology & Tourism, 3(3/4), 195-212.
Wöber, K. W., & Fesenmaier, D. (2004). A multi-criteria approach to des-tination benchmarking: A case study of state tourism advertising programs in the United States. Journal of Travel & Tourism Marketing, 16(2-3), 1-18. doi:10.1300/j073v16n02_01
Wu, J., Liang, L., & Song, M. (2010). Performances based clustering for benchmarking of container ports: An application of DEA and cluster analysis technique. International Journal of Computational Intelli-gence Systems, 3(6), 709-722. doi:10.1080/18756891.2010.9727734
Wu, J., Tsai, H., & Zhou, Z. (2011). Improving eiciency in international tourist hotels in Taipei using a non-radial DEA model. Internation-al JournInternation-al of Contemporary HospitInternation-ality Management, 23(1), 66-83. doi:10.1108/09596111111101670
Yang, C., & Lu, W. M. (2006). Performance benchmarking for Taiwan’s international tourist hotels. Information Systems and Operational Research, 44(3), 229-245.