RAC, Rio de Janeiro, v. 20, n. 2, art. 6, pp. 238-260, Mar./Abr. 2016
http://dx.doi.org/10.1590/1982-7849rac2016150018
Exploration, Exploitation, and Organizational Coordination
Mechanisms
Silvio Popadiuk1
Diógenes de Souza Bido1
Universidade Presbiteriana Mackenzie1
Resumo
Este artigo apresenta uma relação empírica entre exploração, explotação e mecanismos de coordenação organizacional, classificados como centralização de tomada de decisão, formalização e conectividade. Para analisar os resultados desta survey, nós utilizamos duas técnicas: Principal Component Analysis (PCA) e Partial Least Squares Path Modeling (PLS-PM). Nossa análise foi baseada nas respostas de 249 gestores de empresas localizadas no Brasil (amostragem por conveniência). Contrário às nossas expectativas, centralização e explotação se associaram com sinal negativo. Nossos dados revelaram que a formalização se associou positivamente com explotação. Embora a relação entre formalização e exploração tenha sido considerada significante, o resultado foi contrário à hipótese de pesquisa enunciada. Os relacionamentos entre conectividade e explotação e conectividade com exploração foram considerados positivos e significantes. Este relacionamento significa que quanto mais aumenta a conectividade, maior é a probabilidade de ocorrer exploração e explotação.
Palavras-chave: centralização; formalização; conectividade; exploração; explotação.
Abstract
This paper presents an empirical relationship among exploration, exploitation, and organizational coordination mechanisms, classified as the centralization of decision-making, formalization, and connectedness. In order to analyze the findings of this survey, we used two techniques: Principal Component Analysis (PCA) and Partial Least Squares Path Modeling (PLS-PM). Our analysis was supported by 249 answers from managers of companies located in Brazil (convenience sampling). Contrary to expectations, centralization and exploitation were negatively associated. Our data supports the research hypothesis that formalization is positively associated with exploitation. Although the relationship between formalization and exploration were significant, the result is contrary to the research hypothesis that we made. The relationships among connectedness and exploitation, and connectedness and exploration were both positive and significant. This relationship means that the more connectedness increases, the higher the likelihood of exploitation and exploration.
Introduction
The concepts of exploration and exploitation, made clear in the seminal work by March (1991), consist of approaches related to organizational learning (Levinthal & March, 1993) and other theoretical lines that consistently require further studies seeking to understand how organizations deal with them. Gupta, Smith and Shalley (2006) opined that these concepts must be discussed from different standpoints: technological innovation (Benner & Tushman, 2002, 2003; Laursen, Leone, & Torrisi, 2010; Tushman & O´Really, 1996), organizational design (Tushman, Smith, Wood, Westerman, & O´Reilly, 2010), organizational adaptation, organizational learning process (Lyytinen, Rose, & Yoo, 2010), competitive advantage or organizational survival. They raised questions about these two concepts concerning conceptualizing and balance of exploration and exploitation.
Among those studies already carried out, Jansen, Van Den Bosch and Volberda (2005) aimed their questionings at the effects of coordination mechanisms and at environmentally moderated variables in organizational performance, associated with explorer and exploiter innovations. In this sense, taking
a section of that article by these authors as a basis, this paper’s objective is to present an empirical
relationship between exploration, exploitation and organizational coordination mechanisms described by Jansen et al. (2005) as the centralization of decision-making, formalization, and connectedness.
Our study’s main contribution involves the association of the concepts of exploration and
exploitation of managerial coordination mechanisms (centralization, formalization, and connectedness).
This study has the following structure: first, it provides a discussion on the concepts of exploitation and exploration and the three organizational coordination mechanisms involving centralization, formalization, and connectedness. Then it goes into hypotheses regarding the association conducted in this study and an analytical approach based on structural equation modeling. Finally,
results, the study’s limitations and future directions are discussed.
Theoretical Background
Exploitation - For March (1991), exploitation implies fine-tuning, choice, production, efficiency, selection, implementation and execution. When an organization strives for exploitation, there is a trend towards greater certainties and greater speed, proximity and clarity of activities. This suggests that less effort is allocated to revolutionary innovations, and over the medium to long term this may be an element influencing trends for obsolescence of organizational knowledge. Explicit knowledge is more present in exploitation, and there is an idea of continuity, routine, standards and repetition. Adding competencies and skills increases the possibility of rewards both for the staff and for the organization as a whole.
Gilsing (2002) states that exploitation is defined by a strong appeal to pump up economic growth based on existing knowledge and learning routines. Together with a tight focus on cost cutting, this provides an incentive for subsequent exploitation concerning economies of scale.
Scaling effects are ensured by the fact that the essential knowledge transmission and retention mechanisms are highly institutionalized through technical standards, formal procedures for problem-solving and professional associations (Gilsing, 2002).
Hence, developing an internal or external network (Lazer & Friedman, 2007) may allow building up a competitive position while providing leverage for growth through deploying specific knowledge in different contexts (Lazer & Friedman, 2007).
level of adaptation. As a result, the learning process’ purpose shifts towards adapting knowledge to the new context (Gilsing, 2002).
Exploration - March (1991) associates exploration with new possibilities, which include research, variations, risk-taking, experimentation, games, flexibility, discoveries, and innovation. Organizations focused on exploration require higher outlays on experimentation, without significant gains in terms of short-term benefits.
The associated tangible and intangible returns are systematically less certain, further away in time and more remote from the action and adaptation context. Exploration may involve basic research, implying fewer certainties, longer time frames and facts that are less widely disseminated, as compared to product development.
Exploration also tends to be harder to internalize for organizations, encompassing a focus on innovation (Li, Vanhaverbeke, & Schoenmakers, 2008; Tushman et al., 2010) and tacit knowledge. In marketing, exploration is defined by Slater and Narver (1995) as a generated learning process and as a double-loop system by Argyris and Schön (1978). The level of exploration in marketing is determined by the sum of the effects of these changes (Argyris & Schön, 1978; Greve, 2007; Slater & Narver, 1995).
Dimensions associated with the model’s development - A review of published work showed that studying exploitation and exploration strategies could lead to the conclusion that there are two standpoints associated with these issues (Popadiuk, 2012).
The first is related to aspects inherent to the organization’s internal environment, and the other
refers to external aspects. At least six dimensions are associated with theoretical discussions between these two standpoints.
With regard to the internal environment, the focus lies on the organization’s capabilities and thus on the efficient and effective use of resources. This is a function of the adjustment between organizational activities and its strategic planning.
Organizational effectiveness and efficiency are always related, to a greater or lesser extent, to organizational knowledge. They involve control mechanisms, rules, procedures and routines. Thus, four dimensions may be described as: (a) strategic orientation; (b) organizational knowledge practices; (c) organizational efficiency; and (d) innovative practices.
From the standpoint of the external environment, two dimensions are particularly noteworthy: one relates to competition and the other focuses on establishing partnerships with a variety of players in the environment. Both must also be blended with the four previous dimensions in order to seek out innovative stances.
From this discussion on exploitation and exploration, it may be deduced that the management of activities inherent in these two approaches requires a broad set of coordination mechanisms (Jansen, Van Den Bosch, & Volberda, 2005).
As these authors stress, there are few existing studies that seek to detect the implications among exploration and exploitation and coordination mechanisms. They add that part of these studies is focused on formal mechanisms and ignores informal coordination mechanisms (Cardinal, 2001). Hence, it may be assumed that different coordination mechanisms of organizational knowledge should give rise to different impacts in situations where guidelines are more focused on exploration or focused on exploitation, as we shall describe in the following sections.
formalization (Cardinal, 2001; X. Lin & Germain, 2003) and; (b) informal, consisting of the set of social relationships, referred to as connectedness.
Centralization - Hage and Aiken (1967) define centralization as the way in which power is distributed among social positions. They assert that it is made up of two components: (a) the concentration of decisions regarding the distribution of resources or policy making, whose indicator is participation in the decision-making process; (b) the concentration of decisions relating to carrying out tasks whose indicator is the hierarchical authority. Cardinal (2001) states that centralizing decision-making decreases communication channels. As a consequence, it also reduces the quality and quantity of ideas and knowledge concerning troubleshooting (Sheremata, 2000). Cardinal (2001) adds that if information is transmitted through formal communication channels, the success probability of a project involving a radical technology may be greatly reduced, if the project does not fit the dominant status quo in the organization.
On one hand, Jansen et al. (2005) consider that centralization of decision-making is reflected in smaller chances for the emergence of innovations with explorer characteristics. On the other hand, centralization can help innovations with exploiter characteristics (March, 1991; Sheremata, 2000).
Because this type of innovation is limited in its scope and its novelty level, it generates less uncertainty. In this sense, centralization of decision-making authority increases the efficiency of information processing and facilitates innovation exploiters.
A meta-analysis prepared by Damanpour (1991) on the relationship between innovation and organizational characteristics shows that high levels of organizational centralization have a negative effect on radical innovation processes due to reduced autonomy by individuals.
However, it may have positive effects on situations of incremental innovation. In this case, a set of routines and procedures is already established, which requires more centralized control mechanisms (Ettlie, Bridges, & O´Keefe, 1984). Therefore, we state the following research hypotheses:
H1: The higher the centralization of decision-making, the greater its level of exploitation.
H2: The higher the centralization of decision-making, the lower its level of exploration.
Formalization - Aiken and Hage (1968) define formalization as the degree of work standardization and the amount of deviations from standards. A high degree of formalization implies that knowledge is relatively more explicit, rules and procedures are dominant and, additionally, people tend to submit themselves to these controls.
Hence, controls can influence innovation processes. High levels of formalization negatively impact the degree of organizational flexibility and the spontaneity of people when they need to troubleshoot. Controls do increase the efficiency of knowledge acquisition. On the other hand, they can hinder its transformation aimed at creating innovations that deviate from the standards set by organizational routines.
Jansen et al. (2005) emphasize that the formalization of rules, procedures, instructions and communications hampers experimentation and ad-hoc problem-solving, and also reduces the likelihood of an individual’s deviation from structured behaviors. Hence, formalization blocks deviation of existing knowledge and that of a variety of behaviors. Thus, formalization restricts innovations with explorer characteristics.
Through formalization, best practices are encoded in such a way that make them more efficient for exploitation, as well as easier to apply and to accelerate their implementation (Zander & Kogut,
1995). Thus, formalization reinforces exploiters’ innovative features that involve the enhancement of existing products, processes and services (Liao, 2007). Therefore, we state two new research hypotheses:
H4: The higher the formalization, the lower its level of exploration.
Connectedness -Describes the informal collaboration between disciplines and functions at the organizational level (Jansen et al., 2005). It consists of effective cross-functional teams, with enough force to overcome the different mental models and cultures that exist in the organization or consists of the necessary connectivity within the organization that ensures disagreements among members of cross-functional teams.
Connectedness leads to the formation of links involving more than two firms. It also leads to the perception of shared networks. Connectivity enhances the complementarity of sequences or other interdependent activities, leading to the formation of a chain by adopting activities in various relationships. Such adjustments result in a reorientation of network structures with a view to maximizing
the benefits. Network density is reflected in increasing controls, influencing the partners’ activities
(Pillai, 2006).
Jansen et al. (2005) argue that connectedness increases opportunities for informal conversations and access to knowledge sources within the organization. It helps the combination of knowledge between individuals and the development of new knowledge underlying exploratory innovation. Also, they argue that social relations help in establishing legitimacy and empowers staff to adopt an exploratory innovation. However, from a certain point, the density of social networks may limit diverging perspectives and alternative ways of doing things.
Because highly dense networks spread strong standards and establish shared behaviors, they reduce the deflection of behaviors and also limit the search scope and selective perception of alternatives.
Connectedness is advantageous for the development of trust and cooperation among members. It allows individuals to develop a deep understanding of refinements and improvements in products, processes, and existing markets. In addition, dense social relations enable members of the organization to share experiences concerning implementation of certain enhancements. Therefore, we state two final research hypotheses:
H5: The higher the connectedness, the greater its level of exploration.
H6: The higher the connectedness, the lower its level of exploitation.
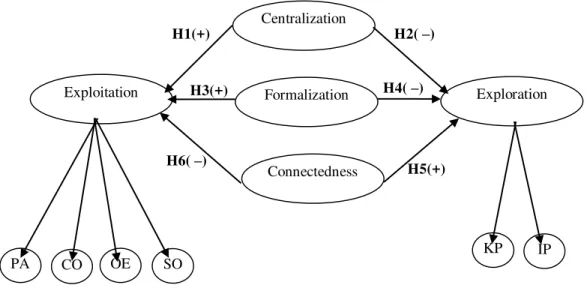
Figure 1. Structural Model
Exploitation is a reflective second-order latent variable (Jarvis, C. B., Mackenzie, S. B., & Podsakoff, P. M. (2003). A critical review of construct indicators and measurement model misspecification in marketing and consumer research (p. 205). Journal of Consumer Research, 30(2), 199-218. doi: 10.1086/376806). Its indicators were the first-order latent variables: (PA) partnerships, (CO) competition, (OE) operational efficiency and (SO) strategic orientation. As these relations are measurement model, we did not state them as hypotheses. Exploration is a reflective second-order latent variable. Its indicators were the first-order latent variables: (KP) knowledge practices and (IP) innovation practices. Formative latent variables, in general, are t o generate indexes; reflexive latent variables are those in which the indicators express the latent variable (Bagozzi, R. P. (2007). On the meaning of formative measurement and how it differs from reflective measurement: comment on Howell, Breivik, and Wilcox (2007). Psychological Methods, 12(2), 229-237. doi: 10.1037/1082-989X.12.2.229); Coltman, T., Devinney, T. M., Midgley, D. F., & Venaik, S. (2008). Formative versus reflective measurement models: two applications of formative measurement. Journal of Business Research, 61(12), 1250-1262. doi: 10.1016/j.jbusres.2008.01.013; Mackenzie, S. B., Podsakoff, P. M., & Jarvis, C. B. (2005). The problem of measurement model misspecification in behavioral and organizational research and some recommended solutions. The Journal of Applied Psychology, 90(4), 710-30. doi: 10.1037/0021-9010.90.4.710. We classified coordination mechanisms – centralization, formalization, and connectedness - as reflexive latent variables based on a discussion by Jansen, J. J. P., Van Den Bosch, F. A. J., & Volberda, H. W. (2005). Managing potential and realized absorptive capacity: how do organizational antecedents matter? Academy of Management Journal, 48(6), 999-1015. doi:10.5465/AMJ.2005.19573106; Hage, J., & Aiken, M. (1967). Program change and organizational properties: a comparative analysis. American Journal of Sociology, 72(5), 503-519; Cardinal, L. B. (2001). Technological innovation in the pharmaceutical industry: the use of organizational control in managing research and development. Organization Science, 12(1), 19-36. doi: 10.1287/orsc.12.1.19.10119; and Lin, X., & Germain, R. (2003). Organizational structure, context, customer orientation, and performance: lessons from Chinese state-owned enterprises. Strategic Management Journal, 24(11), 1131-1151. doi: 10.1002/smj.348.
Methodological Procedures
We developed the instrument for data collection based on a review of the published works on these topics: We measured centralization, formalization, and connectedness with items based on the authors referenced in the Analysis Model item, and the scale to measure exploration and exploitation is the outcome of studies carried out by the authors since 2007 and published by Popadiuk (2012).
We used several strategies to collect data: partly through personal contacts, partly through e-mail messages and partly through direct mail with prepaid replies, with the remainder collected through services rendered by a team hired for this purpose, which visited the companies where respondents worked.
The final non-probabilistic convenience sample was composed of 249 companies in all three business sectors: industry, trade and services, and the key-respondents were preferably managers, assuming that they had a broader overview of the company.
H2( –) Centralization
Formalization
Exploitation Exploration
Connectedness H1(+)
H4( –) H3(+)
H6( –) H5(+)
PA CO OE SO
To reduce common method bias (CMB), we separated the predictor and criterion variable items over the length of the survey instrument and assured participants that their responses would be kept
anonymous, and to assess the CMB, we used Harman’s single-factor test (Podsakoff, Mackenzie, Lee, & Podsakoff, 2003).
The unrotated exploratory factor solution of all 58 items (principal components extraction) resulted in ten components (69.8% of total variance extracted) with eigenvalue greater than 1.0. The first component extracted just 30.7% of variance, which means that the results do not eliminate the possibility of any common method bias, but they suggest that it is unlikely to confuse their interpretation.
Although Harman’s test did not detect the percentage of variance due to the method, and the one from the model itself (legitimate relations), it is a method widely used in current publications, for example: Bansal e Zahedi (2014); Liu, Yen, Lo e Chen (2014); Torres, Johnson e Imhonde (2014); Wang, Tseng e Yen (2014); Wei, Yi e Yuan (2011).
On 04/01/2015, we conducted a search in ProQuest (Full texts + Peer reviewed + basic search, keywords: common method AND Harman). We sorted the results by relevance and selected articles published from 01/2014, which resulted in 127 articles. Then we downloaded the first 30 items to assess the results of Harman’s test on the 19 articles that reported the results in detail, the variance extracted by the first factor was: minimum = 11.0%; mean = 27.5%; median = 27.6%; maximum = 38.0%, which was considered acceptable in all cases. So we may consider that our result (30.7%) is consistent with the usual standards.
Data Treatment and Analysis
Organizational Profile – 41.8% of the companies were known as leaders in their fields of activity; 50.6% posted estimated revenues of up to US$ 50 million in 2007; and 29.0% had headcounts of over 2,000 employees, with 85.7% in São Paulo State, Brazil. Information on leadership was based on the perception of informants. Table 1 reflects the profile that relates revenue, positioning, and sector.
Table 1
Companies’ Profile(1)
Revenue US$ Millions
Industry Trade Services Total
TOTAL NI(*) Leader Other Leader Other Leader Other Leader Other
Until 2 20.0 29.0 40.0 33.3 16.3 31.6 22.4 31.1 26.9 12
+2 - 4 8.6 3.2 0.0 13.3 4.7 0.0 5.1 2.9 4.0 2
+4 - 40 28.6 29.0 15.0 40.0 9.3 17.5 17.3 7.8 20.9 8
+40 42.9 38.7 45.0 13.3 69.8 50.9 55.1 41.7 48.3 9
(1)Total 35 31 20 15 43 57 98 103 201 31
32.8 17.4 49.8 100.0
Note. (*) Not informed – (1) 17 responses not matched (232+17 = 249).
We required informants to have at least five years of expertise related to the organization considered for this study. For this reason, we assumed informants had a broader overview of the organization under study. Contact with 70.0% of informants was personal. 32.8% of the sample
consisted of respondents who worked in the economy’s industrial sector; 17.4% worked in the trade
at auto dealerships. In the service sector, 47.5% of the sample referred to informants working in the insurance and financial sectors. Among the respondents, 70.6% were men; 94.0% were university graduates; 81.8% were more than 30 years old, and 80.7% held managerial positions.
Analysis Model –In order to analyze the survey’s findings, we used two analytical techniques:
the first consisted of a Principal Component Analysis (PCA) intended to eliminate items with low commonality levels, undermining the findings on convergent validity as well as reliability (Pett, Lackey, & Sullivan, 2003). The second technique consisted of a Partial Least Squares Path Modeling (PLS-PM). The purpose of this technique was to examine the convergent and discriminant validity of the exploitation and exploration constructs (Anderson & Gerbing, 1998). Additionally, to evaluate the relationship between these constructs and coordination mechanisms.
PLS-PM is often considered more appropriate than LISREL by virtue of its capacity to estimate the model, even with non-normal data (demanding a lower sample size than LISREL), and to handle a complex model (e.g., second-order latent variables) (Chin & Dibbern, 2010; Hair, Hult, Ringle, & Sarstedt, 2014; Henseler, Ringle, & Sinkovics, 2009).
As we can see in Figure 1, the model has two second-order reflective latent variables (Jarvis, Mackenzie, & Podsakoff, 2003; Wetzels, Odekerken-Schröder, & Oppen, 2009).
We measured exploiter as a second-order latent variable (Table 3), derived from the first-order latent variables (Table 2): organizational efficiency, competition, strategic orientation and partnerships, and explorer, in the same way, by two first-order latent variables: organizational knowledge practices and innovative practices.
Table 2
Factor Loading and t-Values (1st- Order Latent Variables)
Knowledge Practices – (Exploration) Factor loading t-value
Volume of new ideas generated .719 12.3
Use of new sources of knowledge drawn from partners .768 14.9
Existing knowledge in databases .794 17.1
Use of knowledge already in place in the company .793 14.9
Sharing in-house knowledge .855 29.9
Individual learning processes .801 18.4
Collective learning processes .854 26.7
Team-building capacities .854 33.0
Personnel development intensity .883 37.3
Appreciation of individual knowledge .823 22.9
Innovative Practices – (Exploration)
Focus on completely new products or processes .812 16.1
Prototype development .764 11.5
Product innovation rate .832 21.3
Marketing techniques innovation .822 18.6
Opening up new distribution channels .816 20.2
Focus on radical product innovations .893 38.4
Table 2 (continued)
Innovative Practices – (Exploration) Factor loading t-value
Focus on radical technology innovations .852 30.1
Ceaseless quest for new markets .790 15.8
Development of new products and services .879 30.4
Aggressive participation in technology-based alliances .805 19.0
Competition – (Exploitation)
Appearance of new competitors (new players) .728 3.0
Existence of substitute products or processes .645 3.1
Competition in the local (Brazilian) market .821 2.9
Price-based competition in the local (Brazilian) market .841 2.9
Fierce competition in company industry .854 2,9
Existence of promotional (or price) wars in company industry .821 2.9
Competition covers company offers easily .701 2.6
Price-based competition is the high point of the company industry .728 2.9
Strategic Orientation – (Exploitation)
Strategic view focused on the present .945 61.1
Strategies focused on the short term .946 59.9
Organizational Efficiency – (Exploitation)
Creation of detailed routines .779 17.0
Importance of efficiency .853 28.8
Focus on performing activities .878 30.5
Concerns about gains of scale .818 18.4
Organizational control mechanism .847 24.0
Focus on costs .844 24.2
Focus oriented towards production .834 20.4
Partnerships – (Exploitation)
Local relationships with outside partners .820 19.5
Level of dependency on outside partners .661 8.6
Use of contracts in relationships with outside partners .740 11.5
Transparency in joint efforts with partners .772 13.5
Duration of outside partnerships .803 15.8
Sharing knowledge with partners .842 24.9
Concern with establishing outside partnerships .863 24.7
Number of outside partners for the company .828 19.3
Table 2 (continued)
Centralization (Dewar, Whetten, & Boje, 1980; Hage & Aiken, 1967; Jansen
et al., 2005) Factor loading t-value
Most decisions people make here have to have their supervisor’s approval .650 3.1
There can be little action taken here until a supervisor approves a decision .791 3.5
A person who wants to make his own decisions would be quickly discouraged .915 3.1
Even small matters have to be referred to someone higher up for the final
decision .684 2.8
People need to ask their supervisor before they do almost anything .557 2.1
Formalization (Deshpande & Zaltman, 1982; Jansen et al., 2005)
Whatever situation arises, written procedures are available for dealing with it .748 8.5
Rules and procedures occupy a central place in the organizational unit .813 11.0
Written records are kept of everyone’s performance .737 9.2
Written job descriptions are formulated for positions on all organizational
levels .756 9.9
Employees are hardly ever checked for rule violations Excluded
Connectedness (Jansen et al., 2005; Jaworski & Kohli, 1993)
There is ample opportunity for informal hall talk among employees .624 6.0
Employees from different departments feel comfortable calling each other
when the need arises .724 10.1
Managers discourage employees from discussing work related matters with
those who are not their immediate superior Excluded
People around here are quite accessible to each other .880 28.0
It is easy to talk with virtually anyone you need to, regardless of rank or position .830 16.3
Note. t-values estimated by bootstrap in SmartPLS 2.0.M3 (Ringle, C. M., Wende, S., & Will, A. (2005). SmartPLS (version 2.0 M3) [Software]. Germany: University of Hamburg. Retrieved from https://www.smartpls.com/smartpls2) with 249 cases and 1000 resamples. t > 1.96 is significant at 5% and t > 2.58 at 1%.
Table 3
Statistics on Convergent Validity and Reliability
Latent variable AVE Composite
Reliability
Cronbach’s Alpha
Mean Standard Deviation
Explorer – 2nd-order .844 .91 - - -
. Knowledge practices .666 .95 0.94 4.99 1.12
. Innovation practices .685 .95 0.94 4.53 1.41
Exploiter – 2nd-order .462 .76 - - -
. Competition .594 .92 0.90 4.73 1.32
. Strategic orientation .895 .94 0.88 5.46 1.30
. Organizational efficiency .700 ,94 0.92 5.52 1.11
. Partnerships .630 ,93 0.91 5.03 1.18
Table 3 (continued)
Latent variable AVE Composite
Reliability
Cronbach’s Alpha
Mean Standard Deviation
Centralization .533 .84 0.83 3.85 1.13
Formalization .585 .84 0.76 4.23 0.94
Connectedness .595 .85 0.76 4.29 0.76
Recommendation >.50 >.70 >.70 - -
2nd order Latent variable Factor loadings t value
Exploration > Knowledge Practices .918 53.6
Exploration > Innovation Practices .919 56.0
Exploitation > Competition .435 2.7
Exploitation > Strategic orientation .606 7.4
Exploitation > Organizational efficiency .830 20.8
Exploitation > Partnerships .777 14.8
Note. Significance probability: t > 1.96 is significant at 5% and t > 2.58 at 1%. From Table 2 and Table 3 we verify that all factor loadings are high and reveal potential to be significant. For a sample of 249 cases, any correlation superior to|.124| will be significant at the level of 5.0%. This result is obtained by the sensitivity test in G*Power3 (Faul, F., Erdfelder, E., Lang, A.-G., & Buchner, A. (2007). G*Power 3: a flexible statistical power analysis program for the social, behavioral, and biomedical sciences. Behavior Research Methods, 39(2), 175-191. doi: 10.3758/BF03193146), or directly by the formula (Costa, P. L. O., Neto (1977). Estatística. São Paulo: Edgard Blücher).
For modeling second-order latent variables, we followed recommendations from Wetzels, Odekerken-Schröder and Oppen (2009), with repetition of the first-order latent variable’s indicators on the second-order latent variable.
Measurement model assessment - The scale for exploitation and exploration used in this survey (Popadiuk, 2012) listed 45 indicators (7-points) whose final indicators with the respective factor loadings and t-value are included in Table 2. The scales for centralization, formalization, and connectedness (6-points) were based on prior studies also referenced in Table 2.
Convergent Validity - For the convergent validity analysis, we adopted three criteria as proposed by Hair, Babin, Money, and Samouel (2005): factor loadings higher than .7; AVE – Average Variance Extracted higher than .5 and t-values higher than 1.96 (or p < .05).
An examination of Table 2 shows us that all the factor loadings were significant (p < .05). Apart from six indicators, all others reflected a factor loading greater than .7, showing that for these criteria, the model was adequate in terms of its convergent validity, which was confirmed by the average variance extracted (AVE) values that exceeded .5 (Table 3), except for the exploiter latent variable at .46, but that was nevertheless very close to the minimum recommended value. Reliability measured by Cronbach’s Alpha and composite reliability also proved adequate, with values exceeding .7.
Table 4
Correlations and Crossloadings
Panel (a) – Correlations between first-order latent variables
1 2 3 5 6 8 9 10 11
1 Centralization .730
2 Formalization .068 .765
3 Connectedness -.288 .353 .771
5 Knowledge practices -.261 .365 .502 .816
6 Innovative Practices -.187 .373 .440 .686 .827
8 Competition .023 .115 .031 .173 .197 .771
9 Strategic orientation -.189 .189 .211 .440 .496 .182 .946
10 Organizational
efficiency -.159 .407 .389 .591 .558 .145 .512 .837
11 Partnership -.240 .122 .359 .447 .467 .205 .287 .403 .793
Panel (b) - Correlations between latent variables of the structural model
1 2 3 4 7
1 Centralization .730
2 Formalization .068 .765
3 Connectedness -.288 .353 .771
4 Exploration -.244 .403 .514 .918
7 Exploitation -.223 .330 .417 .694 .679
Panel (c) – Crossloadings between exploration and exploitation
4 5 6 7 8 9 10 11
4 Exploration .918
5 Knowledge practices .918 .816
6 Innovative Practices .919 .686 .827
7 Exploitation .694 .633 .640 .679
8 Competition .215 .173 .197 .435 .771
9 Strategic orientation .510 .440 .496 .606 .182 .946
10 Organizational
efficiency .626 .591 .558 .830 .145 .512 .837
11 Partnership .498 .447 .467 .777 .205 .287 .403 .793
Note. The square root values for the AVE were inserted in the diagonal in order to assess the discriminant validity. All correlations greater than |.18| are significant at 5% (n = 249, power = .80, two-tail) and those greater than |.21| are significant at 1%, that was computed from G*Power 3 (Buchner, A., Erdfelder, E., Faul, F., & Lang, A. (2006). G*Power (3.0.3) [Software]. Germany: Universität Dusseldorf. Retrieved from http://www.psycho.uni-duesseldorf.de/abteilungen/aap/gpower3/). The gray cells are the factor loadings.
Panel (c) explains what occurred: competition and strategic orientation had low factor loadings (less than .7) which resulted in a low value for AVE (.46, in Table 2). If we removed competition from the measurement model, AVE would be .55. In this way, the square root of AVE would surpass the correlation between exploration and exploitation. However, it would jeopardize the content validity of the latent variable exploitation. For this reason we may conclude that exploration and exploitation were measured correctly and that both are highly correlated.
The positive correlation between exploration and exploitation (.694, p <.01) is not reflected as a theoretical inconsistency. From those considerations developed by Gupta et al. (2006) and by other authors (March, 1991), we concluded that it is practically impossible to rate an organization as taking on an exclusively explorer or exploiter orientation.
The reason for this is that each department within an organization can carry out its work in accordance with its own need for knowledge, which is aimed more at what already exists in the company, or from new knowledge arising from the interaction with internal and external environments. Hence, while one area such as R&D requires research, creativity, experimentation and new knowledge, manufacturing may only use routines, procedures, and explicit regulations in accordance with the
organization’s documentation. In this sense, strictly speaking, any organization has, to a greater or lesser extent, a connectedness in its structure that may have both exploiter and explorer orientations. In other words, they have a certain degree of ambidexterity (Duncan, 1976).
A study carried out by Cao, Gedajlovic, and Zhang (2009) provides an approach that bolsters the argument contained in the previous paragraph. These authors based their position on an illustrative example when referring to the presence of explorer or exploiter orientation. This is reflected in Table 5.
Table 5
An Example of an Ambidexterity Profile for Two Generic Companies
Company Degree of exploration
Degree of exploitation
Degree of ambidexterity based on the balance between exploration and exploitation
Degree of ambidexterity based on the combination between exploration and exploitation
A 10 5 Low High
B 5 5 High Low
Reliability - Reliability can be assessed by Cronbach’s Alpha or composite reliability. In the
context of structural equations modeling and PLS-PM, composite reliability is the most appropriate measurement and all results found in Table 3 meet the criteria proposed by Hair et al. (2005) and Hair, Hult, Ringle and Sarstedt (2014): composite reliability are greater than 0.7.
Structural Model Assessment – Hypothesis tests - In Table 6 we can verify that the three coordination mechanisms are correlated with exploration and exploitation. Model 1 is equal to Figure 1, and in model #2 we included control variables (sector, size, and leadership). Despite sector and leadership being significant at 5%, we noted that the changes in structural coefficients were lower than 0.03, increasing our reliance on the meaningfulness of these coefficients.
Table 6
Path Coefficients among Exploration, Exploitation, and Coordination Mechanisms
Path Coefficients (Hypothesis)
Model #1 Model # 2 (with controls)
β p ΔR² R²
(R² adj.) β p ΔR²
R² (R² adj.)
Centralization → Exploitation (H1) -.156 .016 3%
23.1% (22.2%)
-.183 .009 4%
27.0% (25.2%)
Formalization → Exploitation (H3) .239 .000 8% .235 .000 8%
Connectedness → Exploitation (H5) .285 .000 12% .258 .000 11%
Leader → Exploitation .143 .007 2%
Sector → Exploitation -.025 .717 0%
Size → Exploitation .136 .019 2%
Centralization → Exploration (H2) -.157 .006 4%
34.2% (33.4%)
-.183 .003 4%
38.4% (36.9%)
Formalization → Exploration (H4) .283 .000 11% .281 .000 11%
Connectedness → Exploration (H6) .369 .000 19% .343 .000 18%
Leader → Exploration .153 .004 2%
Sector → Exploration .016 .782 0%
Size → Exploration .153 .021 3%
Note. Key: β = standardized path coefficients. p = p-value. ΔR² = contribution of each predictor to explain the variance of dependent variables. R² adj. = R² adjusted. Sector (n = 78 industry, 51 trade, 120 service) was dummy encoded, and these two indicators were used as formative in the measurement model (Falk, R. F., & Miller, N. B. (1992). A primer for soft modeling. Ohio: The University of Akron Press.).Revenue in 2007 was used as indicator of Size, and was grouped in classes: 1 = to 1M R$, 2 = ]1 – 5] M, 3 = ]5 – 10], 4 = ]10 – 100], 5 = above 100 MR$, and Leadership (n = 104 leader, 145 = non-leader) was dummy encoded.
All structural coefficients were significant at 5%. However, it should be noted that exploitation and centralization has a negative path coefficient (-.156, p < .05). This negative value reveals that the centralization of decision-making and exploitation has opposing directions. When one is more prevalent, this tends to inhibit the other, and vice-versa. Therefore, H1: The higher the centralization of
decision-making, the greater its level of exploitation- is not supported by our study.
One of the reasons for the research hypothesis in this study not being supported, as expected, could be explained by the following argument: There is more exploitation, meaning that the processes, routines, procedures and control mechanisms are already institutionalized within the organization, mainly when innovation tends to be incremental. Therefore this becomes an organizational practice and the individuals in the organization probably no longer perceive that there is centralization.
As H1 was not supported, this may reveal that centralization is necessary, but it is not enough to
In other words, centralization makes the exploration process more difficult, but this alone is not enough to prove the positive impact on the exploitation process.
Research hypothesis H2 -The higher the centralization of decision-making, the lower its level of
exploration – has been supported (-.157, p < .05). Therefore the predominance of centralization of decision-making implies a trend towards inhibiting the exploration process and vice-versa.
Research hypothesis H3 - The higher the formalization, the greater its level of exploitation - was
supported (.239, p < .05). However, H4 - The higher the formalization, the lower its level of exploration – has not been supported (.283, p < .05). Though the coefficient is significant, its value was positive, revealing that formalization and exploration have the same direction.
While it is understandable that exploitation demands formalization, the fact that our data do not support H4 suggests that the formalization process is an essential practice for any organization and
therefore regardless of the fact that there is more or less of an explorer orientation. Accordingly, we concluded that even if there is an explorer orientation, formalization is necessary. Formalization is an organizational practice that should take place whatever the type of innovation – be it radical or incremental – carried out by the organization. It may be more intense or less intense in accordance with the type of innovation, but it is always present. Therefore individuals within the organization may find that even in creative situations with new ideas, products and services inherent to situations where there is an explorer orientation, a certain level of formalization is present due to the use of procedures, practices and necessary routines for documenting the activities developed.
Research hypothesis H5 - The higher the connectedness, the greater its level of exploration – was
supported (.369, p < .05). Therefore, the more connectedness in the organization, the more there is evidence of exploration and vice versa.
Research hypothesis H6 - The higher the connectedness, the lower its level of exploitation - was
not supported (.285, p < .05), though the coefficient is significant and associated positively. This result shows that even an exploiter orientation requires connectedness.
This result seems to be solid due to the high level of connectivity necessary between companies whose coalition could be in search of knowledge, with either explorer or exploiter features, provided by knowledge sharing. Moreover, by institutionalizing the exploitation process, routines, processes, procedures, control mechanisms, structures, and other features, which are inherent to the exploitation orientation, flow easily throughout the organization. This could make individuals believe that there is more connectivity inside the organization.
Conclusion
The relationship between exploration and centralization (H2) was supported (-.157, p < .05), as
expected. While one predominates in one direction, the other follows the opposite direction. Therefore, more centralization means less effort for exploration and vice versa. Contrary to expectations, centralization and exploitation (H1) are associated in a negative way (-.156, p < .05). That is, if one is
predominant the other follows an opposite direction. Our research hypothesis had supposed the same direction, that is, more centralization, more exploitation and vice versa.
The research hypothesis that formalization was positively associated with exploitation was supported (H3) (.239, p <.01). Inherent in this result, an organization oriented towards exploitation must
have more explicit knowledge, more competition, a short-term strategic orientation, more controls aiming at organizational efficiency and an increasing number of partnerships. Although the relationship between formalization and exploration (H4) was deemed significant, the result is contrary to the research
hypothesis made (.283, p <.01). Our expectation was that more formalization would involve less exploration. However, it is possible that the opposite relationship between formalization and exploration is effectively present in situations where the organization’s focus is on activities with exploiter features. Thus, a likely explanation for the contradictory result is that companies could be adopting ambidextrous postures in their innovation processes. In the study by Jansen et al. (2005), formalization and exploitation displayed a relationship similar to this. However, the relationship between formalization and exploration was not significant.
Consequently, it is understandable that exploitation requires formalization. As H4 was not
supported, it suggests that the formalization process is an essential practice for any organization and therefore regardless of the fact that there is more or less an explorer orientation. Accordingly, we concluded that even if there is an explorer orientation, formalization is necessary.
The relationship between connectedness and exploitation (H5 - path = .285, p <.01) and
connectedness and exploration (H6 - path = .369, p <.01) were significant and positive. This means that
the more connectedness increases, the higher the likelihood of exploitation and exploration. Although an opposite result has been found between connectedness and exploitation, this result may be explained by means of the same reason associated with formalization. That is, organizations in this study tend to adopt ambidextrous postures (Duncan, 1976; Güttel & Konlechner, 2009; Im & Rai, 2008; Litrico & Dean Lee, 2008; Z. Lin, Yang, & Demirkan, 2007). This posture is not surprising. Previous studies using this same database (Popadiuk, 2012) revealed that approximately 40% of the organizations were rated as ambidextrous, 9% as explorers, 14% as exploiters, and 37% were not in a well-defined position. Jansen et al. (2005) formulated the hypothesis that connectedness was related to exploration as an inverted U-shape. Therefore, this hypothesis was not supported in the study. On the other hand, the hypothesis that connectedness had a positive relationship with exploitation was supported, similar to that found in this study. Furthermore, the fact that connectedness is directly related to exploitation and exploration reveals the importance of social interactions within the organization, as envisaged in other studies of organizational knowledge management.
Final remarks
Based on our results and past studies, we concluded that the idea of exploration and exploitation is complex. One cannot simply elaborate a definition in merely a few words. It is evident from published works that many perspectives need to be taken into consideration to have a clear understanding of their meaning and significance within organizations. Essentially, these two concepts refer to organizational learning. In this sense, the learning curve is a relevant factor to be taken into account when discussing this issue. If an organization makes a constant effort to learn, because of the capacity and valuation of its internal knowledge, this will relate greatly to the exploitation process. However, if the organization is open to absorbing what happens outside of its domain, it will look for orientation that could be defined as exploration. Furthermore, this simultaneous search must be desired by the majority, because it allows joining these two lines of research, creation and use of knowledge in a synergistic manner able to generate a competitive advantage.
Although in the seminal article by March (1991) a trade-off between these two strategic orientations of organizational knowledge was discussed, the studies analyzed in published works and affirmations made in this study allow us to conclude that it is not possible for organizations to position themselves in only one of the extremes, be it that of exploration or exploitation.
Accordingly, when faced with such complexity it may be considered that the hypothesis formulated for this study reflects in part the association between exploitation and exploration and mechanisms of organizational coordination.
Besides possible theoretical gaps, some points viewed as critical must be taken into consideration in future studies of this topic such as common method biases (CMB). Although analyses regarding CMB were within the usual values of other studies, it is not possible to assess the extent to which this bias is present, so for future research we recommend using the procedure of Chin, Thatcher, Wright, and Steel (2013), or preferably to include variables obtained from other sources in the model, such as secondary data for example.
One of these critical points refers to the depth of analysis of this phenomenon. When referring to exploration and exploitation, March (1991) viewed the essence of their role as explaining innovation processes in organizations. In general terms, it is possible to pursue this discussion. However, as assessed by other researchers the discussion of these concepts is far more complex than imagined. Initially, this will depend on the viewpoint of the user of the knowledge or learning process.
For example, for somebody writing a text, the process consists of far more exploitation. The knowledge is held by the writer even when derived from knowledge obtained elsewhere (exploration); this is a pure exploitation process. Intellectual efforts are required to be able to express the ideas in the text. On the other hand, the reader of this text even when endowed with knowledge on the topic, will be engaged in an exploration process when reading it. Here we are referring to an individual ontological analysis level. This process may be extrapolated to the group and/or organizational context. Thus, demarcation is essential for the analysis.
The second point refers to the sampling process. Although the sample used here focused on three business activities representing industry, trade and services in an attempt to develop a more homogeneous data set, it is evident that factors intrinsic to the collection process may have influenced data quality. Part of the data was collected by telephone, part by e-mail and part personally. It was not always possible to obtain respondents with the desired profile in order to answer the questionnaire: more specifically, a manager with a broad-ranging overview of the organization.
Another point to be analyzed is the context of the information. Through a description of the companies encompassed by the sample, it seems clear that they are quite large. Even an entrepreneur who established the organization will not have a detailed view of everything happening throughout its structure. Therefore, he or she alone cannot be accountable for this organization. In an ideal survey, there should be many respondents within the company when possible, several from various areas within the company. However, this would require the researcher to spend quite some time in the company, which might perhaps be possible if engaged in a consulting project. One manner of making the model more accurate would be to apply the questionnaire in a very specific context – marketing, finance, production, administration, etc. – or even in an activity such as some project, for example.
Still on the topic of sampling, the ideal would be the use of a probabilistic sample that could
represent the activity, the project or the organizational function being studied. In this study’s particular
case, the sample was gathered by convenience. Part of this sample was based on updating records used in another survey that was conducted some years before, in order to analyze the information environment of organizations.
References
Aiken, M., & Haje, J. (1968). Organizational interdependence and intra-organizational structure.
American Sociology Review, 33(6), 912-930. doi: 10.2307/2092683
Anderson, J. C., & Gerbing, D. W. (1998). Structural equation modeling in practice: a review of the two-step approach. Psychological Bulletin, 103(3). 411-423. doi: 10.1037/0033-2909.103.3.411
Argyris, C., & Schön, D. A. (1978). Organizational learning: a theory of action perspective. Massachussetts, MA: Addison-Wesley.
Bagozzi, R. P. (2007). On the meaning of formative measurement and how it differs from reflective measurement: comment on Howell, Breivik, and Wilcox (2007). Psychological Methods, 12(2), 229-237. doi: 10.1037/1082-989X.12.2.229
Bansal, G., & Zahedi, F. M. (2014). Trust-discount tradeoff in three contexts: frugality moderating privacy and security concerns. The Journal of Computer Information Systems, 55(1), 13-29.
Benner, M. J., & Tushman, M. L. (2002). Process management and technological innovation: a longitudinal study of the photography and paint industries. Administrative Science Quarterly, 47(4), 676-707. doi: 10.2307/3094913
Benner, M. J., & Tushman, M. L. (2003). Exploitation, exploration, and process management: the productivity dilemma revisited. Academy of Management Review, 28(2), 238-256. doi: 10.5465/AMR.2003.9416096
Bierly, P. E., III, Damanpour, F., & Santoro, M. D. (2009). The application of external knowledge: organizational conditions for exploration and exploitation. Journal of Management Studies, 46(3), 481-509. doi: 10.1111/j.1467-6486.2009.00829.x
Buchner, A., Erdfelder, E., Faul, F., & Lang, A. (2006). G*Power (3.0.3) [Software]. Germany:
Universität Dusseldorf. Retrieved from
http://www.psycho.uni-duesseldorf.de/abteilungen/aap/gpower3/
Cao, Q., Gedajlovic, E., & Zhang, H. (2009). Unpacking organizational ambidexterity: dimensions, contingencies, and synergistic effects. Organization Science, 20(4), 781-796. doi: 10.1287/orsc.1090.0426
Cardinal, L. B. (2001). Technological innovation in the pharmaceutical industry: the use of organizational control in managing research and development. Organization Science, 12(1), 19-36. doi: 10.1287/orsc.12.1.19.10119
Chin, W. W., & Dibbern, J. (2010). An introduction to a permutation based procedure for multi-group pls analysis: results of tests of differences between simulated data and a cross-cultural analysis of the sourcing of information system services between Germany and the USA. In V. E. Vinzi, W. W. Chin, J. Henseler, & H. Wang (Eds.), Handbook of partial least squares: concepts, methods, and applications (Chap. 7, pp. 171-193). Berlin: Springer-Verlag.
Chin, W. W., Thatcher, J. B., Wright, R. T., & Steel, D. (2013). Controlling for common method variance in PLS analysis: the measured latent marker variable approach. In H. Abdi, W. W. Chin, V. E. Vinzi, G. Russolillo, & L. Trinchera (Eds.), New perspectives in partial least squares and related methods (pp. 231-239). New York: Springer.
Costa, P. L. O., Neto (1977). Estatística. São Paulo: Edgard Blücher.
Damanpour, F. (1991). Organizational innovation: a meta-analysis of effects of determinants and moderators. Academy of Management Journal, 34(3), 555-590. doi: 10.2307/256406
Deshpande, R., & Zaltman, G. (1982). Factors affecting the use of market research information: a path analysis. Journal of Marketing Research, 19(1), 14-31. doi: 10.2307/3151527
Dewar, R. D., Whetten, D. A., & Boje, D. (1980). An examination of the reliability and validity of the Aiken and Hage scales of centralization, formalization, and task routineness. Administrative Science Quarterly, 25(1), 120-128. doi: 10.2307/2392230
Duncan, R. B. (1976). The ambidextrous organization: designing dual structures for innovation. In R. H. Kilmann, L. R. Pondy, & D. P. Slevin (Eds.), The management of organization design: strategies and implementation (Vol.1, pp. 167-188). Amsterdam, Netherlands: North Holland Publishing Company.
Ettlie, J. E., Bridges, W. P., & O´Keefe, R. D. (1984). Organization strategy and structural differences for radical versus incremental innovation. Management Science, 30(6), 682-695. doi: 10.1287/mnsc.30.6.682
Falk, R. F., & Miller, N. B. (1992). A primer for soft modeling. Ohio: The University of Akron Press.
Faul, F., Erdfelder, E., Lang, A.-G., & Buchner, A. (2007). G*Power 3: a flexible statistical power analysis program for the social, behavioral, and biomedical sciences. Behavior Research Methods, 39(2), 175-191. doi: 10.3758/BF03193146
Fornell, C., & Larcker, D. F. (1981). Evaluating structural equation models with unobservable variables and measurement error. Journal of Marketing Research, 18(1), 39-50. doi: 10.2307/3151312
Gilsing, V. A. (2002). Co-evolution of exploration & exploitation in a sectoral system of innovation. Retrieved from http://www.druid.dk/conferences/winter2002/gallery/gilsing.pdf
Greve, H. R. (2007). Exploration and exploitation in product innovation. Industrial and Corporate Change, 16(5), 945-975. doi: 10.1093/icc/dtm013
Gupta, A. K., Smith, K. G., & Shalley, C. E. (2006). The interplay between exploration and exploitation.
Academy of Management Journal, 49(4), 693-706. doi: 10.2307/20159793
Güttel, W. H., & Konlechner, S. W. (2009). Continuously hanging by a thread: managing contextually ambidextrous organizations. Society and Business Review, 61, 149-171.
Hage, J., & Aiken, M. (1967). Program change and organizational properties: a comparative analysis.
American Journal of Sociology, 72(5), 503-519.
Hair, J. F., Jr., Babin, B., Money, A., & Samouel, P. (2005). Fundamentos de métodos de pesquisa em administração. Porto Alegre: Bookman.
Hair, J. F., Jr., Hult, G. T. M., Ringle, C. M., & Sarstedt, M. (2014). A primer on partial least squares structural equation modeling (PLS-SEM). Thousand Oaks, CA: Sage Publications, Inc.
Henseler, J., Ringle, C. M., & Sinkovics, R. R. (2009). The use of partial least squares path modeling in international marketing. Advances in International Marketing, 20, 277-319. doi: 10.1108/S1474-7979(2009)0000020014
Im, G. (2006). Exploratory and exploitative knowledge sharing in interorganizational relationships
Im, G., & Rai, A. (2008). Knowledge sharing ambidexterity in long-term interorganizational relationships. Management Science, 54(7), 1281-1296. doi: 10.1287/mnsc.1080.0902
Isobe, T., & Montgomery, D. B. (2004). Exploitation, exploration, and firm performance: the case of small manufacturing firms in Japan. Research Collection Lee Kong Chian School of Business.
Retrieved from
http://ink.library.smu.edu.sg/cgi/viewcontent.cgi?article=3341&context=lkcsb_research
Jansen, J. J. P., Van Den Bosch, F. A. J., & Volberda, H. W. (2005). Managing potential and realized absorptive capacity: how do organizational antecedents matter? Academy of Management Journal, 48(6), 999-1015. doi:10.5465/AMJ.2005.19573106
Jarvis, C. B., Mackenzie, S. B., & Podsakoff, P. M. (2003). A critical review of construct indicators and measurement model misspecification in marketing and consumer research. Journal of Consumer Research, 30(2), 199-218. doi: 10.1086/376806
Jaworski, B. J., & Kohli, A. K. (1993). Market orientation: antecedents and consequences. Journal of Marketing, 57(3), 53-70.
Kyriakopoulos, K., & Moorman, C. (2004). Tradeoffs in marketing exploitation and exploration strategies: the overlooked role of market orientation. International Journal of Research in Marketing, 21(3), 219-240. doi: 10.1016/j.ijresmar.2004.01.001
Laursen, K., Leone, M. I., & Torrisi, S. (2010). Technological exploration through licensing: new insights from the licensee´s point of view. Industrial and Corporate Change, 19(3), 871-897.doi: 10.1093/icc/dtq034
Lazer, D., & Friedman, A. (2007). The network structure of exploration and exploitation. Administrative Science Quarterly, 52(4), 667-694. doi: 10.2189/asqu.52.4.667
Levinthal, D. A., & March. J. G. (1993). The myopia of learning. Strategic Management Journal, 14(S2), 95-112. doi: 10.1002/smj.4250141009
Li, Y., Vanhaverbeke, W., & Schoenmakers, W. (2008). Exploration and exploitation in innovation: reframing the interpretation. Creativity and Innovation Management, 17(2), 107-126. doi: 10.1111/j.1467-8691.2008.00477.x
Liao, Y.-S. (2007). The effects of knowledge management strategy and organization structure.
International Journal of Management, 24(1), 53-60.
Lin, X., & Germain, R. (2003). Organizational structure, context, customer orientation, and performance: lessons from Chinese state-owned enterprises. Strategic Management Journal, 24(11), 1131-1151. doi: 10.1002/smj.348
Lin, Z., Yang, H., & Demirkan, I. (2007). The performance consequences of ambidexterity in strategic alliance formations: empirical investigation and computational theorizing. Management Science, 53(10), 1645-1658. doi: 10.1287/mnsc.1070.0712
Litrico, J.-B., & Dean Lee, M. (2008). Balancing exploration and exploitation in alternative work arrangements: a multiple case study in the professional and management services industry.
Journal of Organizational Behavior, 29(8), 995-1020. doi: 10.1002/job.553
Liu, L.-L., Yen, H.-H., Lo, C.-F., & Chen, C.-Y. (2014). Risk communication, trust and patient commitment. Journal of Accounting, Finance & Management Strategy, 9(1), 89-114.
Lyytinen, K., Rose, G., & Yoo, Y. (2010). Learning routines and disruptive technological change. Hyper-learning in seven software development organizations during internet adoption.
Mackenzie, S. B., Podsakoff, P. M., & Jarvis, C. B. (2005). The problem of measurement model misspecification in behavioral and organizational research and some recommended solutions. The Journal of Applied Psychology, 90(4), 710-730. doi: 10.1037/0021-9010.90.4.710
March, J. G. (1991). Exploration and exploitation in organizational learning. Organizational Science, 2(1), 71-87.
Netemeyer, R. G., Bearden, W. O., & Sharma, S. (2003). Scaling procedures: issues and applications. Thousand Oaks: Sage Publications, Inc.
Nunnally, J. C., & Bernstein, I. H. (1994). Psychometric theory (3rd ed.). New York: McGraw-Hill.
Pett, M. A., Lackey, N. R., & Sullivan, J. J. (2003). Making sense of factor analysis: the use of factor analysis for instrument development in health care research. California: Sage Publications, Inc.
Pillai, K. G. (2006). Networks and competitive advantage: a synthesis and extension. Journal of Strategic Marketing, 14(2), 129-145. doi: 10.1080/09652540600659756
Podsakoff, P. M., Mackenzie, S. B., Lee, J.-Y., & Podsakoff, N. P. (2003). Common method biases in behavioral research: a critical review of the literature and recommended remedies. The Journal of Applied Psychology, 88(5), 879-903. doi: 10.1037/0021-9010.88.5.879
Popadiuk, S. (2012). Scale for classifying organizations as explorers, exploiters or ambidextrous.
International Journal of Information Management, 32(1), 75-87. doi: 10.1016/j.ijinfomgt.2011.07.001
Ringle, C. M., Wende, S., & Will, A. (2005). SmartPLS (versão 2.0 M3) [Software]. Germany: University of Hamburg. Retrieved from https://www.smartpls.com/smartpls2
Sheremata, W. A. (2000). Centripetal and centrifugal forces in radical new product development under
time pressure. Academy of Management Review, 25(2), 389-408. doi:
10.5465/AMR.2000.3312925
Slater, S. F., & Narver, J. C. (1995). Market orientation and the learning organization. Journal of Marketing, 59(3), 63-74. doi: 10.2307/1252120
Torres, R., Johnson, V., & Imhonde, B. (2014). The impact of content type and availability on ebook reader adoption. The Journal of Computer Information Systems, 54(4), 42-51.
Tushman, M., Smith, W. K., Wood, R. C., Westerman, G., & O´Reilly, C. (2010). Organizational designs and innovation streams. Industrial and Corporate Change, 19(5), 1331-1366. doi: 10.1093/icc/dtq040
Tushman, M. L., & O’Reilly III, C. A. (1996). Ambidextrous organizations: managing evolutionary and revolutionary change. California Management Review, 38, 8-30.
Vorhies, D. W., Orr, L. M., & Bush, V. D. (2011). Improving customer-focused marketing capabilities and firm financial performance via marketing exploration and exploitation. Journal of the Academy of Marketing Science, 39(5), 736-756. doi: 10.1007/s11747-010-0228-z
Wang, H.-K., Tseng, J.-F., & Yen, Y.-F. (2014). How do institutional norms and trust influence knowledge sharing? An institutional theory. Innovation: Management, Policy & Practice, 16(3), 374-391. doi: 10.1080/14479338.2014.11081994
Wetzels, M., Odekerken-Schröder, G., & Oppen, C. van (2009). Using PLS path modeling for assessing hierarchical construct models: guidelines and empirical illustration. MIS Quarterly, 33(1), 177-195.
Yalcinkaya, G., Calantone, R. J., & Griffith, D. A. (2007). An examination of exploration and exploitation capabilities: Implications for product innovation and market performance. Journal of International Marketing, 15(4), 63-93. doi: 10.1509/jimk.15.4.63
Zander, U., & Kogut, B. (1995). Knowledge and the speed of the transfer and imitation of organizational capabilities: an empirical test. Organization Science, 6(1), 76-92. doi: 10.1287/orsc.6.1.76
Dados dos Autores
Silvio Popadiuk
Rua da Consolação, 930, Consolação, 01302-907, São Paulo, SP, Brasil. E-mail: [email protected]
Diógenes de Souza Bido