Artigo
*e-mail: [email protected]
PARTICULATE MATTER IN THE INDOOR ENVIRONMENT OF MUSEUMS IN THE MEGACITY OF SÃO PAULO
Andrea Cavicchiolia,*, Ericka Pardini Morronea and Adalgiza Fornarob
aEscola de Artes, Ciências e Humanidades, Universidade de São Paulo, Avenida Arlindo Bettio 1000, 03828-000 São Paulo – SP, Brasil bDepartamento de Ciências Atmosféricas, Instituto de Astronomia, Geofísica e Ciências Atmosféricas, Universidade de São Paulo, Rua do Matão 1226, 05508-090 São Paulo – SP, Brasil
Recebido em 09/01/2014; aceito em 10/07/2014; publicado na web em 22/09/2014
Atmospheric pollutants can have serious impacts on the preservation of São Paulo’s tangible cultural heritage. The purpose of this paper is to report the results of a monitoring campaign focussed on particulate matter (PM) that was conducted in three of the most important museums of the São Paulo megacity (Brazil): the Museu de Arqueologia e Etnologia (MAE-USP), the Museu Paulista (MP-USP), and the Pinacoteca do Estado de São Paulo (PE). These museums exhibit indoor PM and black carbon (BC) concentrations consistent with their urban locations and their speciic methods for managing the indoor environment.
Keywords: cultural heritage; indoor environment; particulate matter.
INTRODUCTION
In recent years, the scientiic community has shown considerable interest in the presence of particulate matter (PM) in the atmosphere and its impact on air quality. This relects the intensiication of concern for a problem that shows no signiicant sign of improvement. According to the oficial environmental agency of São Paulo State (Companhia Ambiental do Estado de São Paulo, CETESB),1 in the Metropolitan Area of São Paulo (MASP) “the annual average concentrations of PM2.5 are quite high if compared with the quality standards of the USA
or the World Health Organization (WHO). Overdoses have reached levels that are 48% higher than the annual American standard or 100% above the WHO reference value on an annual basis.” CETESB also stated that “there is no sign of a reduction trend in the levels of PM2.5 considering that since 2004, that is, over the last four years, the
average concentrations remained unaltered.” This quote refers to the 2003–2006 period. However, similar igures were conirmed in more recent years at MASP stations that monitor this parameter.2
In general, PM contamination studies focus on outdoor envi-ronments where the primary sources of this pollutant are found (vehicular and industrial emissions, soil resuspension). As a result, indoor pollution remains an area of study of relatively minor interest. The composition of indoor air depends on a series of factors, such as the level of atmospheric contamination in the outdoor surroundings, internal sources of contaminants and the processes that govern the transport, physical–chemical transformations and the deposition of substances. In this context, the type of air exchange used and practices for indoor air quality management play a special role.3
This issue requires attention, not only on account of human health considerations, but also with regard to the deterioration of materials. In areas speciically devoted to the preservation of tangible cultural heritage (museums, archives, galleries, libraries, among others), the degradation of artistic and historic artifacts resulting from PM depends on particle size, concentration and composition.4,5
The importance of undestanding the factors that affect PM pene-tration in indoor environments, its sinks and possible countermeasures were the focus of a 1992 study in which internal sources were also emphasised.6 Similarly, Nazaroff et al. assessed both indoor and
outdoor concentrations of PM, levels of black carbon (BC) and rates of deposition in ive California museums.7 According to that study, museums with natural ventilation exhibited ine particulate concentra-tions almost as high as outdoors, thus highlighting the potential risk of impacts in urban museums without indoor environmental control systems. Similarly, indoor concentrations of BC ranged from 50% to 100% of the outdoor concentrations versus 20% to 50% in buildings with heating, ventilation and air conditioning (HVAC) systems. The circulation of visitors and its role in PM penetration, as well as the effect of meteorological factors, was stressed in a study focussed on the Sainsbury Centre for Visual Arts.8 In London, two museums were assessed in terms of rate of particle deposition on vertical and horizontal surfaces as a function of particle size, temperature (T), relative humidity (RH) and number of visitors.9 Schmidt et al. studied PM concentrations in the National Museum of Copenhagen, a faci-lity located in the city centre and, therefore, surrounded by heavily travelled streets.10 In areas with HVAC systems in place, the rate of PM removal was as high as 98%. However, the study found that the eficiency of removal was lower for ine particles, associated with BC.
The collection of 30 samples from different locations in the Archaeological Museum of Thessaloniki enabled the comparison of indoor ine PM concentrations and with outdoor PM levels.11 According to the authors, the indings point to similar temporal luctuations in ine PM concentrations inside and outside (I/O ratio) the museum. This is typical of buildings with high rates of air exchange, as is the case where windows are kept open most of the time. A study of the air quality in a historical archive in Milan, Italy, highlighted different tendencies for ine PM accumulation in distinct locations within the building, with underground areas exhibiting higher I/O ratios.12
In Brazil, the irst comprehensive study of indoor air quality was conducted in 1993 by the Laboratório de Apoio ao Desenvolvimento Tecnológico (LADETC), followed by a second phase in 1995-96. The study focussed primarily on the presence of formaldehyde, acetal-dehyde, benzene, toluene and xylenes (BTX) in ofices, restaurants, kitchens, museums, schools, libraries, graphic workshops, homes and airports.13 Later studies of indoor air quality covered a range of large,14 medium and small urban centres.15-17
334.6 µg m−3, whereas the mean value for PM
2.5 ranged from 132.4 to 303.6 µg m−3. In the outdoor atmosphere, PM
10 concentrations were in the range of 129.5-141.9 µg m−3 and PM
2.5 concentrations were in the range of 101.2-196.6 µg m−3. As a result, I/O ratios were higher than the unity, on average.
With regard to its chemical composition of PM, the coarse fraction tends to be more heterogeneous. However, because it originates primarily from the resuspension of soil particles, it is generally richer in Si, Al, Ca, Mg and Fe, while also incorporating combustion ashes and pollen particles.18 In the ine mode, sulphate, nitrate, ammonium, some heavy metals, PAHs and BC predominate. BC, a typical marker of combustion processes, is composed of organic and inorganic structures (particularly elemental carbon), and is mainly deined in terms of its optical properties.19-21
The literature is unanimous in emphasising that the impact of PM on materials is more speciically associated with ine mode particles. These can cause physical and chemical damage resulting from: i) the catalytic action of heavy metals (e.g. Fe and Mn) in the degradation of organic compounds or by favoring the oxidation of S-rich species into H2SO4; ii) the presence of substances speciically harmful for materials, as is the case of (NH4)2SO4 in the blooming of varnishes; iii) the deposition of hygroscopic material, hence promoting the up-take of water molecules that can accelerate a number of degradation processes (hydrolysis); and iv) the impregnation of ine particles into the substrates (e.g. BC) leading to undesirable visual effects like soiling or ghosting.4,5 Furthermore, even when the visual alteration of works of art can be reversed, the repeated action of cleaning triggers decay and is considered a long-term impact.4
Owing to the fact that objects exposed or preserved in museums are unique, precious and vulnerable, detailed studies on the micro-environmental conditions of their indoor areas become extremely important for the adoption of preventative conservation measures. Yet, investigations are still quite scarce. With this goal in mind, this paper will illustrate and discuss the results of the monitoring of PM concen-trations and its content of black carbon conducted in three important museums located in the municipality of São Paulo, Brazil. São Paulo is the largest and possibly most polluted of Brazilian cities. However, it is perhaps the liveliest in terms of cultural activities and the richest in the quantity of artistic and historic artifacts. Institutions in which monitoring was conducted included the archaeology museum of the University of São Paulo (Museu de Arqueologia e Etnologia MAE-USP), the historical museum Museu Paulista (MP-USP), also part of the University of São Paulo, and Pinacoteca do Estado de São Paulo (PE-SP), one of the richest plastic arts museums in Latin America. EXPERIMENTAL
Locations
The three museums selected for study are all important institutions for conservation that exhibited substantial differences in location, architecture, type of exposed material, and probable mechanism for the exchange of air between indoor and outdoor environments, and availability of HVAC systems. Two of the museums were also the subject of further measurements of indoor air quality that are reported elsewhere.22,23
The location of the museums within São Paulo and simpliied loor plans of each building are shown in Figure 1. It shows the sec-tors (highlighted with capital letters) within which samplings were conducted. However, because they are multistorey buildings (with the exception of MAE-USP), sampling sites can be more easily identiied if the information in Figure 1 is crosschecked with the data in Table 1, which identiies the collection points on each loor. The photographs
and satellite images in Figure 2 show more clearly the three buildings, their surroundings and their location within the urban context.
PE-SP is located on Avenida Tiradentes, in the city centre, at the southeast corner of Parque da Luz, opposite the homonymous railway station. The three-loor building, erected in 1900, has a rectangular base and is oriented in such a way as to have its major sides facing the street on the southeast and the park on the northwest. There are entrances on the two minor sides (the visitor’s entrance being the on the south) and several windows, the majority of which remain permanently closed. The central part of the building is comprised of two large patios covered by a glass roof that provides natural light in those areas and a limited degree of air exchange.
Five sampling points were selected (Table 1 and Figure 1): i) a storage room used for paintings (RT 1, sector C, ground loor); ii) a storage room located in close proximity to RT 1, used primarily for paper artifacts, but containing other objects such as sculptures (RT
Figure 1. Location of the three museums within the municipality of São
2, sector C, ground loor); iii) an exhibition room facing the street (Sala Willys, EX 1, sector A, second loor); iv) an exhibition room facing the park (Sala Retratos, EX 2, sector B, second loor); and v) the balcony (Belvedere, EXT, sector C, irst loor) facing the street.
With regard to environmental controls, the exhibition areas are acclimatised by means of a fan coil system (Trane) in which outside air is captured at roof level and iltered through polypropylene/nylon membranes, adjusted to the desired T and RH and pumped into the internal galleries. The storage area, where T and RH are precisely controlled by dedicated equipment, receives air from an indoor inlet (exhibition area) and this is subsequently iltered in a fashion similar to other sectors of the museum. All internal rooms are provided with a system of passive exhaust ducts.
The MP-USP is situated inside a park called the Parque da Independência. The park is surrounded by large avenues that connect the city centre with the southeast suburbs. The main ediice is a few hundred metres from these avenues. The building was erected at the end of the 19th century in a sumptuous style, with its main entrance on the north side and large doors and windows all around. The museum consists of four levels: the lower level (basement), ground loor, irst loor and second loor. Here, it was possible to carry out sampling at eight points distributed in the museum as follows (Table 1 and Figure 1): three storage areas situated in the central tower (RT 1, sector A; RT 2, sector B; and RT 3, sector B), the latter comprising the textile collection; four exhibition areas (EX 1, sector C) in the mezzanine of the main staircase that leads from the main entrance to the irst loor galleries; EX 2, sector A, Sala Rostos e Roupas; EX 3, sector D, Sala Mobiliário; EX 4, sector C, in the lower level); and an external point that corresponds to the external gallery on the irst loor facing the park (EXT, sector E).
In the MP-USP, there are no rooms with environmental controls apart from the physical barriers represented by doors and windows.
In general, doors (and sometimes windows) are kept open, facilita-ting the exchange of air between the between indoor and outdoor environments. The storage areas (RT1, RT2 and RT3) are enclosed spaces within corridors that lead to the administrative ofices. They have no windows and doors are mostly closed. In RT 3, a fan is kept on permanently to minimise air stagnation.
Constructed in 1989, MAE-USP occupies an area of approxima-tely 12,000 m2 on the main campus of the University of São Paulo. The museum consists of two main single-storey areas: the larger one used for administration and storage and a smaller one for permanent exhibitions (Figure 1). The building’s immediate surroundings are covered mostly by vegetation; the campus bus parking and the busy Marginal Pinheiros are slightly more than 1 km distance.
Five sampling sites were selected at the MAE-USP: i) a point in the middle of the storage area (RT 1, sector B); ii) a point next to the entrance door (RT 2, sector B); iii) , a point near the door in the eth-nographic exhibition building (EX 1, sector C); iv) a point in the inner part of the ethnographic exhibition building (EX 2, sector D); and v) an outdoor sampling location next to the guard post (EXT, sector E). The MAE-USP has no air conditioning, but other forms of air circulation exist. In the exhibition area, external air is provided mechanically (without iltration); an exhaust system is provided in the storage sector.
It is worth noting that, following the sampling described in this paper, all three museums underwent some degree of structural alte-ration (the MAE-USP will soon move to a new building). Therefore, some of the sampling areas described above no longer exist. Sampling
During the study, 152 samples of ine and coarse PM were col-lected. A portion of the samples was obtained during the wet season
Figure 2. Photographs and satellite images (from Google Earth, Google Inc.) showing a 1.5 km area around the museums. All images of the three museums are
(December 2008 to February 2009, and November 2009). Other sam-ples were obtained during the dry season (April 2009 to September 2009). Sampling was carried out randomly from Monday through Friday. Sampling on Mondays, the day on which all the museums are closed, was not expected to bias the sampling results in the exhibition areas because visitor volume on weekdays is not particularly high. Furthermore, on days off there are always a number of maintenance activities that involve the circulation of a substantial number of people and the opening of doors and windows in all the rooms.
The PM sampling was performed using a lab-made Low Volume Sampler (Mini-Vol), developed and assembled according to the design proposed by Hopke et al..24
The equipment has two units: pumping and inlet/sampling. A pump is comprised of a diaphragm pump (Gast, model DOA V722-AA), a valve for coarse low control, a rotameter (Dywer, model MMA, 5-25 L min−1 range) and a conventional hourmeter. Inlet/sampling includes a PVC/polyethylene impactor and a poly-carbonate stacked ilter unit. The impactor, which restricts the access of particles with diameter larger than 10 µm, was lathe-turned in accordance with the original design. The ilter unit, acquired from the Norwegian Institute for Air Research (NILU, Norway), supports two stacked 47-mm membranes (polycarbonate Isopore™ Membrane Filters), with porosity of 8 µm (collecting the coarse mode, i.e. 8–10
µm particles) and 0.4 µm (collecting the ine mode, i.e. 0.4–8 µm
particles). Each round of sampling was performed for 24 hours at
a low rate of 18 L min−1 with the inlet mounted on a 1.60 m-high tripod. Some measurements in PE-SP and MAE-USP were carried out with an automatic DustTrak Aerosol Monitor (TSI Inc., USA) provided with a PM10 impactor kit.
Quantification
PM concentrations were obtained by relating the amount of collected material, determined by gravimetry, and the volume of air aspirated over the entire sampling time. The gravimetry procedure involved measuring the mass of the polycarbonate membranes before and after sampling, after the acclimatisation of ilters for 24 h at 22 ºC e 42% RH, on plastic petri dishes. Weighing was performed in triplicate on a balance with a readability of 1 µm (Mettler Toledo,
MX5 model).
The quantiication of BC was obtained using a Smoke Stain Relectometer (Diffusion Systems Model M43D) following a well--established methodology.25
RESULTS AND DISCUSSIONS
The results of the sampling program conducted in the three museums are reported in Table 2 and illustrated, in terms of average PM concentration in the ine and coarse modes, in Figure 3. When considering these data, it must be stressed that the number of indoor
Table 1. Sampling Sites: Location and Characteristics
Sampling Points
Sector*
(Floor) Site Description Main Characteristics
Air Circulation Forced
Inlet
Air Filters
Forced Exhaust
MAE-USP
RT 1 A (0) Storage area (next to the door)
Painted wall, loor covered with synthetic rub-ber, main exhibit materials: feathers, natural ibres, ceramics, textiles, wood, glass, metals
No No Yes
RT 2 B (0) Storage area (inner point) No No Yes
EX 1 D (0) Exhibition area “África”
(inner point) Yes No No
EX 2 C (0) Indígena” Exhibition area “Brasil
(next to the door) Yes No No
EXT E (0) Guard post (external) - -
-MP-USP
RT 1 A (+2) Storage area (West) Painted wall, wooden loor, main exhibit materials: paintings, porcelain, wood, textiles,
metals, paper
No No No
RT 2 B (+2) Storage area (East) No No No
RT 3 B (+2) Storage area (textile) Painted wall, loor covered with synthetic
rub-ber, main exhibit materials: textiles No No No
EX 1 C (+1) Main staircase
Painted walls, loor covered with ceramic tiles, main exhibit materials: metal, paintings,
marble
No No No
EX 2 A (+1) Exhibition area Roupas”“Sala Rostos e Painted wall, wooden loor, main exhibit materials: paintings, porcelain, wood, textiles,
metals, paper
No No No
EX 3 D (+1) Exhibition area Mobiliário”“Sala No No No
EX 4 C (-1) Lower level exhibition area Painted wall, wooden loor, main exhibit
materials: paintings, porcelain, metals No No No
EXT E (+1) Open-air gallery (external) - - -
-PE-SP
RT 1 C (0) Storage area (paintings) Painted wall, granite loor, main exhibit
mate-rials: paintings Yes Yes No
RT 2 C (0) Storage area (paper) Painted wall, granite loor, main exhibit
mate-rials: paintings, metal, chalk, paper Yes Yes No
EX 1 A (+2) Exhibition area “Sala Wyllis” Painted wall, carpeted loor, main exhibit
materials: paintings, metals Yes Yes No
EX 2 B (+2) Exhibition area “Sala Retratos” Painted wall, carpeted loor, main exhibit
materials: paintings, metals Yes Yes No
EXT C (+1) Balcony Belvedere (external) - - -
samples was, as a rule, quite larger than that of the outdoor samples. This is because the focus of the investigation was on the indoor micro-environments and there was a speciic interest in mapping differences in distinct areas of each museum. However, in every museum the outdoor atmosphere was sampled for the same number of days as each individual indoor room (the only exception being RT2 in MAE that was monitored over four days versus ive days for the outdoor environment), so that every group of data was equally representative of one type of environment in statistical terms.
The PE-SP had the highest outdoor contribution of PM (particularly the coarse mode, with an average concentration of 20.6 µg m−3). This is attributable to the museum’s close proximity to primary sources of PM, mainly car and motorcycles (burning petrol and ethanol), and buses and lorries (burning diesel). The MAE-USP ranked second in PM concentrations, exhibiting an average of 13.1 µg m−3. It must be remembered that the external measurements at the MAE-USP were taken just outside the main building, at ground level and at a few metres distance from the parking area. This, together with the proximity to the university’s bus depot just behind the museum, should explain the somewhat higher level of PMc at that location. The MP-USP, on the other hand, displayed lower outdoor PMc concentrations (average of 7.4 µg m−3, half the MAE-USP outdoor levels). The outdoor PM
c values of standard deviation, maximum and minimum concentrations of 2.8, 11.1 and 3.8 µg m−3, respectively, did not differ signiicantly from the PMf concentrations at the MP-USP. Unlike the other two museums (Table 2 and Figure 3), this data relect stable environment conditions. This is likely due to the fact that at the MP-USP, the measurements were taken directly outside the museum and the park around the building served as a buffer zone, at least for the PMc.
For PMf, the concentrations varied within narrower intervals, with averages ranging from 6.2 (MAE-USP) to 8.4 (PE-SP) µg m−3, minima from 2.5 (MP-USP) to 5.0 (PE-SP) µg m−3 and maxima from 8.1 (MAE-SP) to 11.0 (PE-SP) µg m−3. This indicated, again, the least favorable conditions outside the PE-SP. These results are perfectly compatible with the fact that indoor PMf concentrations are less inluenced by variables like trafic intensity and meteorological conditions, as already observed in a recent review on this topic.4
It is interesting to note that, in all the external measurements, the PM10 concentrations (sum of ine and coarse modes, also denominated inhalable particles) were signiicantly below the thresholds deined in the air quality standard (150 µg m−3) for PM
10
2. They exhibited average, minimum and maximum igures of 20.7, 6.3 and 41.1 µg m−3, respectively. These values were not fully representative of the bulky outdoor concentration of PM10 in the in the São Paulo city centre. For
Table 2. Summary of the PM concentrations, indoors and outdoors at the three museums: number of samples (n); standard deviation (sd); mean; median; respective ratios between average indoor and outdoor values; (I/O); maximum concentration (max.); minimum concentration (min.); BC mean concentrations and mass percentage contribution for PM
MAE-USP MP-USP PE-SP
Fine Coarse Fine Coarse Fine Coarse
In. Out. In. Out. In. Out. In. Out. In. Out. In. Out.
n 19 5 19 5 28 4 28 4 16 4 16 4
sd (µg m-3) 1.7 1.4 4.8 6.2 2.4 3.0 3.2 2.8 2.6 2.3 2.3 9.4
Mean (µg m-3) 3.5 6.2 5.1 13 5.8 6.8 5.4 7.4 5.1 8.4 3.6 21
I/O 0.56 0.39 0.85 0.72 0.61 0.17
Median (µg m-3) 3.0 6.2 3.8 9.4 5.8 7.2 5.0 7.4 4.6 8.7 3.7 22
I/O 0.48 0.41 0.80 0.67 0.53 0.17
Max (µg m-3) 5.9 8.1 20 25 11 10 15 11 12 11 7.8 30
Min (µg m-3) 1.2 4.0 0.80 8.4 1.4 2.5 1.0 3.8 1.9 5.0 0.40 7.8
BC (µg m-3) 0.8 1.5 0.20 0.40 1.3 1.5 0.20 0.30 1.1 1.9 0.20 0.80
BC (%) 23 24 4.0 3.0 23 22 4.0 3.0 21 23 6.0 4.0
example, at the Faculty of Medicine of USP in the central area of the town, Castanho recorded PM10 average concentrations of 77 µg m
−3
in winter and 32 µg m−3 in summer by using a Tapered Oscillating Monitor (TEOM).25 Bourotte et al. conirmed similar levels using the methodology employed in this study, with an average winter PM10 concentration of 62.7 µg m−3.26 Also, according to CETESB27, the average annual concentrations of PM10 in 2009 were 32 and 34 µg m−3,respectively, at the Pinheiros and Parque Dom Pedro air quality monitoring stations. These stations were the closest to the three mu-seums. On the other hand, some nonsystematic measurements were performed with the automatic DustTrack instrument at peak hours at the external sampling points of MAE-USP (on 3/3/10, for 15 min) and PE-SP (on 1/3/10, and 4/3/10, for 10 min). Those measurements provided PM10 concentrations of, respectively, 15, 23 and 55 µg m
−3
that were consistent with the averages reported in Table 2. This means that, although some underestimation of PM10 concentrations provided by the sampling device is quite likely, the external values generated were affected by a certain degree of abatement in PM concentration that took place between the source area (vehicular trafic) and the sampling points. These were located either distant from primary sources (MP-USP) or in locations that provided, to some extent, sheltering or reduced access by particles. Nonetheless, what should be considered is the actual concentration in the immediate vicinity of each museum.
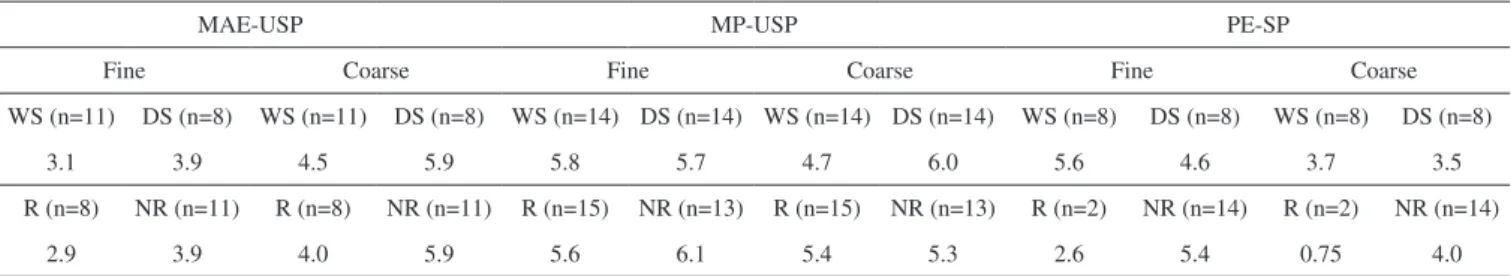
Table 3 shows average PM concentrations (ine and coarse modes) measured in all indoor areas of the two museums in the dry and wet seasons, as well as rainy and nonrainy days (information retrieved from the authors’ own records, corroborated by the literature).27
To demonstrate how the data is representative, the number of samples (n) used for the calculation of each average is also reported.
The data shows that, at MAE-USP, the change from the wet to dry season provoked an overall increase in both PMf and PMc, consistent with the worsening of urban air quality. The fact that three of the wet--season measurements were taken during holidays, when visitation and vehicle trafic around the museum is reduced, may contribute to the difference in average values. In fact, if those three values are excluded from the calculation, the difference in PMc between the wet season and dry season falls from +30% to +4%. As for the effect of atmospheric precipitation, which is expected to wash PM from the air, the results indicate again that the indoor area is quite strongly affected by the outdoor particulate concentration, particularly the coarse mode that experiences a 50% decrease on rainy days versus a 37% reduction recorded for PMf.
Despite the larger amount of measurements, the situation at the MP-USP, is less clear because of the broader variety of indoor envi-ronments sampled. The change of season is evident in the increase of mean PMc concentration (+26%), but has no marked effect on PMf. On the other hand, the decrease in rainfall does have an impact on PMf (+9%) and almost no effect on PMc. This observation and the fact that all the wet-season measurements were taken during holidays when this museum receives far less visitors (mainly students), appears
to indicate that the presence of larger particles are less inluenced by changes in outdoor atmospheric PM concentration and more by the movement of people in the exhibition areas, as will be further described below.
Conditions at the PE-SP can only be analysed in terms of wet and dry season because the number of samples obtained on rainy days is limited to two. This was considered insuficient for a reliable assessment. Here, the differences between PM concentration at the beginning of the wet and dry seasons amount to decreases on the order of −5% (PMc) and −18% (PMf), notwithstanding the fact that, over the last years, average PM10 in São Paulo has been 22% higher in April/May than in November.27
This occurrence can be explained by the combination of three effects: the close proximity of the museum to the primary source of both coarse and ine PM; sampling periods corresponding to the transitional rather than full seasons; and the existence of an environmental control system in the PE-SP. The irst two effects imply that atmospheric conditions typical of the dry season, which tend to favour the accumulation of pollutants in the urban context (thermic inversions and overall reduced precipitation events and intensity), were less signiicant in the case of the indoor area of the PE-SP. Data from CETESB27 conirm that, of the wet season days when the measurements were taken (November 3rd, 4th, 5th, 9th, 10th and 11th, 2009), there was rain only on 11/9/2009. Therefore, substantial differences in the data between the two periods would not be expected. On the other hand, one should consider that with a centralised HVAC system for the control of the indoor environment and the increase in outdoor temperature and relative humidity, the low of air from outdoors in November is likely to be artiicially intensiied in relation to natural ventilation, and possibly stronger in April/May. Furthermore, enhanced mechanical air mixing in a partially enclosed environment is expected to maintain suspended particles to a greater extent, an aspect particularly supported by Nazaroff et al.7 and Camuffo et al.28 The more distinct increase of PM
f in November, as opposed to April/May, is consistent with this view since various authors agree that iltration in conventional air conditioning systems is not suficient to retain ine particulate matter.4,7,17,28
With regard to indoor concentrations, Table 2 presents a general picture of the overall eficiency of each museum in terms of average indoor/outdoor concentration ratio (I/O). In contrast, Figure 3 highli-ghts differences between separate areas in each building. In the PE-SP, the I/O ratios were 0.17 (PMc) and 0.61 (PMf), with better performance in the two storage rooms and the exhibition sector located on the park side of the building. These results show that, in the PE-SP, the more isolated the areas (storage, where inlet air was sucked from indoors) or more distant from the main street (exhibition west, less exposed to the direct inluence of vehicular trafic), the more successful the reduction of PMf concentrations. Yet, ine mode particles were not addressed with equal eficiency and, in fact, the average PMf con-centration in the east exhibition area was as high as concon-centrations outside the building, or even slightly higher (Figure 3). In almost all
Table 3. Average PM concentration (µg m-3) in the ine and coarse fraction in samples (n) collected during the wet season (WS) and dry season (DS) in
MAE--USP (Dec-Feb, Aug-Sep), MPMAE--USP (Jan, May) and PE-SP (Apr-May, Nov) and measured in rainy (R) and non rainy days (NR) in both seasons
MAE-USP MP-USP PE-SP
Fine Coarse Fine Coarse Fine Coarse
WS (n=11) DS (n=8) WS (n=11) DS (n=8) WS (n=14) DS (n=14) WS (n=14) DS (n=14) WS (n=8) DS (n=8) WS (n=8) DS (n=8)
3.1 3.9 4.5 5.9 5.8 5.7 4.7 6.0 5.6 4.6 3.7 3.5
R (n=8) NR (n=11) R (n=8) NR (n=11) R (n=15) NR (n=13) R (n=15) NR (n=13) R (n=2) NR (n=14) R (n=2) NR (n=14)
cases, with exception of RT2, PMf had higher concentrations than PMc. This fact might be ascribed to the use of air ilters that were only effective against larger particles, whereas iner particles could enter the museum through both improperly sealed doors and windows and the ilters themselves. Furthermore, leakage of air though cracks in the building should not be disregarded in the case of particles in the 1–5 µm diameter range and where the optimum penetration eficiency/ deposition velocity ratio was reached.4
In the MP-USP, although the external contribution of PM was signiicantly reduced compared to the PE-SP, the I/O (0.72 and 0.86) was considerably less favorable. The vulnerability of the MP-USP to outdoor factors such of temperature and humidity, solar light and airborne pollutants has already been highlighted and discussed in earlier papers.22,23 In the case of PM, it is worth observing that ine particles tend to penetrate inside the museum with enhanced ability, being more concentrated than coarse particles in all areas. Exceptions were the main staircase point (EX1), where the large volume of visi-tors certainly contributed to the resuspension of PMc, and the lower level gallery (EX4) that probably suffered from its proximity to larger particles in suspended soil. The difference between the two irst loor exhibition rooms follows the same pattern, particularly with lower PMf in EX2 (Roupas e Rostos) than in EX3 (Mobiliário). This diffe-rence is likely due to a door and a window facing the open-air terrace that are normally kept open EX2, whereas EX3 is linked to another indoor area and is maintained with doors and windows permanently closed. Fine particles were almost as concentrated in the storage rooms as in the outdoor atmosphere, although with coarse particles at the lowest indoor levels. A drop in PMf level was observed in RT3 (textile storage room), where constant mechanical ventilation was used as a form of environmental management. This positive result is consistent with previous observational and modeling studies that conclude it is an eficient way to address indoor PMf.
7
In the MAE-USP, indoor contamination from PM was associated more with the coarse mode. This was possibly due to much larger outdoor concentrations of this PM fraction (twice more concentrated than ine faction) and to the fact that the entire museum is located at ground level, thus receiving larger contributions of suspended particles. The fact that fresh air was injected into the exhibition area without iltering should further affect PM concentrations in this sector. Interestingly, the fact that housekeeping personnel conduct intensive cleaning does not appear to positively affect the levels of coarse PM in this area. In the storage area, an exhaust system is installed, which is likely to explain a somewhat lower overall concentration of the two PM modes. It should be observed that the larger average coarse concentration in RT2 was outweighed by the fact that one of the measurements occurred on a day on which general house cleaning was conducted. This involved access by a somewhat larger number of staff, the movement of furniture and objects, vacuuming and dus-ting. This likely caused the resuspension of an unusual quantity of coarse PM. The concentration was maintained, but induced a larger standard deviation within this set of data. Its exclusion would result in the reduction of the average PMc from 6.30 to 2.82 µg m
−3, which is lower than RT1 (3.97 µg m−3). This is a reasonable result if one considers that the exhaust system should be more eficient in this part of the storage room (inner section) than close to the door (RT1).
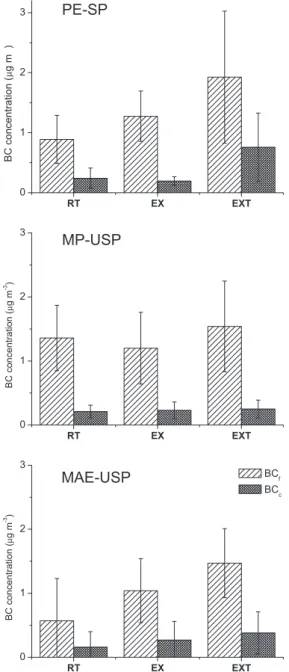
Figures 4 and 5 and Table 2 show the concentration of BC in both ine and coarse mode particles. To minimise the effect of potential outliers that were identiied among the concentration values, the BC data were clustered in three categories: external concentrations, exhibition areas and storage rooms. The suspect concentrations were not eliminated. However, a simulation (not shown) conirmed that their exclusion would not qualitatively alter the scenario illustrated in Figures 4 and 5.
In absolute terms, the BC concentrations followed the same pat-terns as the overall PM concentrations, with always larger levels in the outdoor environment, followed by the exhibition areas (generally more exposed to the outdoor environment) and inally the storage areas. The average indoor PMf concentrations ranged from 0.57 (RT-MAE-USP) to 1.36 µg m−3 (EX-MP-USP). That is, levels comparable with previous published concentrations in this ield can be regarded as intermediate.7,29 The MP-USP exhibited distinct characteristics with the highest BC concentrations in the storage area than the exhibition area, but consistent with trends in the overall levels of PM.
As expected, BC is found at higher concentrations in ine PM, consistent with the fact that they were generated by fossil fuel combustion, possibly with a signiicant contribution of diesel-based engines. Although data on PM smaller than 2.5 µm are not available, BC concentrations of smaller particles are expected to be even higher according to well-established literature information.4,7,28
In relative terms, BC represented 23% of the overall mass concen-tration of PMf and 3% of PMc in the outdoor environment, essentially
Figure 4. Average and standard deviation Black Carbon (BC)
Figure 5. Mass percentage contribution of Black Carbon (BC) in fine and
coarse PM
with no difference among the three sites. This is in agreement with literature data, although the sampling point in this case was parti-cularly important.21,25 On average, indoor proportions do not deviate from these values, although Figure 5 shows interesting enrichment for PMf in the storage areas of the PE-SP and MP-USP apart from almost all cases of PMc. This may be due to the fact that, in the PE-SP, the iltration system was indeed effective in reducing overall PM concentrations in the inner parts of the museum. However, eficiency was reduced in the case of BC particles, possibly because of their reduced dimensions that make them less prone to retention in iltering membranes. BC particles are particularly more concentrated in the iner fractions of PM. In this respect, Worobiec et al. conirmed in a previous study at the Wawel Castle in Crakow, Poland, that BC was more abundant in the ine fraction in winter and the most internal part of the building (45% in 2nd loor rooms vs. 34% outside, 27% on the 1st loor and 13% on the ground loor); when air circulation was enhanced, the BC variations followed that of the PM concentrations.30 In the MP-USP, the proportion of BC in the storage area was the
same as outdoor PM. However, it dropped in the exhibition rooms, likely because of the greater contribution of larger noncarbonaceous particles at lower levels in the building. That is, the proportion of BC seems to increase in areas where some kind of restriction to access by PM was promoted (unless speciic measures for very ine BC particles were implemented) and where typical resuspension particles became less abundant.
CONCLUSION
This study addressed the distribution of PM concentrations in the indoor environment of three of the most important Brazilian museums. The overall levels of particles in exhibition and storage areas, although always signiicantly below the safety standards deined for the human population, exceeded the threshold for safe conservation (10 µg m−3 in stores and archives) in 46% of all measurements. Of those, 76% were in the exhibition rooms and 28% were in the storage areas.31 The current safety guidelines for cultural heritage are based on an estimate of the time it will take, under average environmental conditions, for some degradation to be observed. For example, Tétreault estimated that 10 µg m−3 is the maximum concentration of PM
2.5 for a preservation target of one year before the appearance of the lowest observed adverse effects.32 In this sense, the lowest level of aggressive airborne pollutants, including PM, should always be the goal in order to guarantee the longest life time of a valuable artifact and to reduce the drawbacks and economic costs associated with recurrent interventions. This implies a continuous and organised deployment of efforts to characterise microenvironments in a museum or any other conservation institution. Along with a thorough understanding of all the factors governing the presence of harmful species in the indoor atmosphere and their effects on materials, the conservation scientist should contribute to strategic planning and decision-making for the protection of indoor air quality and preventive approaches to conservation.
ACKNOWLEDGEMENTS
Prof. Marisa Afonso (MAE-USP); Dr. Teresa Toledo de Paula (MP-USP); Valéria Mendonça, Teodora Carneiro and Camilla Vitti (PE-SP); the staff of LAPAT (IAG-USP); the team of Prof. Américo S. Kerr (IF-USP); FAPESP (grants N. 2006/61437-3 and 2008/04551-3). REFERENCES
1. CETESB, Material particulado inalável fino (MP2,5) e grosso (MP2,5 – 10) na atmosfera da região metropolitana de São Paulo (2000 – 2006), Governo do Estado de São Paulo-Secretaria do Meio Ambiente, São Paulo, 2008.
2. CETESB, Relatório de qualidade do ar no estado de São Paulo (2012), Governo do Estado de São Paulo-Secretaria do Meio Ambiente, São Paulo, 2013.
3. Brickus, L. S. R.; Neto, F. R. A.; Quim. Nova1999, 1, 22. 4. Grau-Bové, J.; Strli , M.; Heritage Science 2013, 1, 1.
5. Gysels, K.; Deutsch, F.; Van Grieken, R.; Camuffo, D.; Bernardi, A.; Sturaro, G.; Busse, H. J.; Wieser, M.; Journal of Cultural Heritage 2004, 5, 221.
6. Owen, M. K.; Ensor, D. S.; Sparks, L. E.;Atmos. Environ.1992, 26, 2149.
7. Nazaroff,W. W.; Ligocki, M. P.; Salmon, L. G.; Cass G. R.; Fall, T.; Jones, M. C.; Liu H. I. H.; Ma, T.; Airborne Particles in Museums, The Getty Conservation Institute: Marina del Rey, 1993.
9. Adams, S.; Ford, D.; Atmos. Environ.1999, 29, 33.
10. Schimidt, F.; Bueno, M. I. M. S.; Einzweiler, J.; Resumos do 4° Congresso Brasileiro de Redes Neurais, São José dos Campos, Brazil, 1999.
11. Mouratidou, T.; Samara, C.; Atmos. Environ. 2004, 38, 4593.
12. Cappitelli, F.; Fermo, P.; Vecchi, R.; Piazzalunga, A.; Valli, G.; Zanardini, E.; Sorlini, C.; Water, Air, Soil Pollut.2009,201, 109. 13. Brickus, L. S. R.; Neto, F. R. A.; Quim. Nova1999, 1, 22.
14. Pires, M.; Carvalho, L. R. F.; Quim. Nova1999, 22, 487; Cavalcante, R. M.; Campelo, C. S.; Barbosa, M. J.; Silveira, E. R.; Carvalho, T. V.; Nascimento, R. F.; Atmos. Environ. 2006, 40, 5701; Sodre, E. D.; Correa, M.; Arbilla, G.; Marques, M.; Quim. Nova2008, 31, 249; Godoi, R. H. M.; Avigo Jr., D.; Campos, V. P.; Tavares, T. M.; de Marchi, M. R. R.; Van Grieken, R.; Godoi, A. F. L.; Water, Air, Soil Pollut.: Focus
2009, 9, 171; Siqueira, C. Y. S.; Gioda, A.; Carneiro, F. P.; Ramos, M. D. K. V.; Neto, F. R. A.; J. Braz. Chem. Soc. 2011, 22, 2127.
15. Geraldo, L. P.; Santos, W.; Marques, A. L.; Botari, A.; Radiol. Bras.
2005, 38, 283; Cristale, J.; Silva, F. S.; Zocolo, G. J.; Marchi, M. R.; Environ. Pollut. 2010, 169, 210; Nascimento, G. C.; Master Thesis, Escola de Engenharia de São Carlos da Universidade de São Paulo, Brazil, 2011; Schornobay, E.; Master Thesis, Escola de Engenharia de São Carlos da Universidade de São Paulo, Brazil, 2012; Alves, A. L.; Master Thesis, Escola de Engenharia de São Carlos da Universidade de São Paulo, Brazil, 2013; Rotiroti, A.S.; Master Thesis, Escola de Engenharia de São Carlos da Universidade de São Paulo, Brazil, 2013. 16. Ito, L. X.; Aguiar, M. L.; Indoor Built Environ.2007, 2, 16.
17. Godoi, R. H. M.; Carneiro, B. H. B.; Paralovo, S. L.; Campos, V. P.; Tavares, T. M.; Evangelista, H.; Van Grieken, R.; Godoi, A. F. L.; Sci. Total Environ. 2012, 452-453, 314.
18. Almeida, I. T.; Master Thesis, Escola Politécnica da Universidade de São Paulo, Brazil, 1999.
19. Menon, S.; Hansen, J. E.; Nazarenko, L.; Luo, Y; Science2002,297, 2250
20. Latha, K. M.; Badarinath, K. V.; Atmos. Res.2003, 69, 125.
21. Brito, J.; Rizzo, L. V.; Herckes, P.; Vasconcellos, P. C.; Caumo, S. E. S.; Fornaro, A.; Ynoue, R. Y.; Artaxo, P.; Andrade, M. F.; Atmos. Chem. Phys.2013,13, 20839.
22. Cavicchioli, A.; Neves, C. A.; Paiva, R. I.; Faria, D. L. A.; Sens. Actuators, B 2014, 190, 1014.
23. Cavicchioli, A.; Souza, R. O. C.; Ranieri, G. R.; Fornaro, A.; e-Preserv. Sci.2013, 10, 114.
24. Hopke, P. K.; Xie, Y.; Raunemaa, T.; Biegalski, S.; Landsberger, S.; Maenhaut, W.; Artaxo, P.; Cohen, D.; Aerosol Sci. Technol.1997, 27, 726.
25. Castanho, A. D. A.; Master Thesis, Instituto de Física da Universidade de São Paulo, Brazil, 1999; Castanho, A. D. A.; Artaxo, P.; Atmos. Environ.2001, 35, 4889.
26. Bourotte, C. L. M.; Sanchéz-Ccoyllo, O. R.; Forti M. C.; Meli, A. J.; Rev. Bras. Meteorol. 2011, 26, 419.
27. CETESB, Relatório de Qualidade do ar no estado de São Paulo (2009), Governo do Estado de São Paulo-Secretaria do Meio Ambiente, São Paulo, 2010.
28. Camuffo, D.; Brimblecombe, P.; Van Grieken, R.; Bussed, H. J.; Sturaro, G.; Valentino, A.; Bernardi, A.; Blades, N.; Shooter, D.; De Bock, L.; Gysels, K.; Wieser, M.; Oliver Kim, O.; Sci. Total Environ.1999, 236, 135.
29. Horemans, B.; Cardell, C.; Bencs, L.; Kontozova-deutsch, V.; Wael, K. D.; Van Grieken, R.; Microchem. J.2011, 99, 429.
30. Worobiec, A.; Samek, L.; Krata, A.; Meel, K. V.; Krupinska, B.; Ste-faniak, E. A.; Karaszkiewicz, P.; Van Grieken, R.; Journal of Cultural Heritage2010, 11, 354.
31. Blades, N.; Oreszczyn, T.; Bordass, B.; Cassar, M.; Guidelines on pollution control in heritage buildings, University College of London: London, 2000.