Artigo
*e-mail: [email protected]
EXPERIMENTAL DETERMINATION OF BENZENE UPTAKE RATE IN TENAX TA DIFFUSIVE SAMPLERS
Luci Carla Gheleri Andrietta
Bioagri Ambiental, Rua Aujovil Martini, 201, 13420-833 Piracicaba - SP, Brasil Edson Tomaz* e Ana Claudia Camargo de Lima Tresmondi
Departamento de Processos Químicos, Faculdade de Engenharia Química, Universidade Estadual de Campinas, Cidade Universitária Zeferino Vaz, CP 6066, 13081-970 Campinas - SP, Brasil
Marco Aurélio Cremasco
Departamento de Termoluidodinâmica, Faculdade de Engenharia Química, Universidade Estadual de Campinas, Cidade Universitária Zeferino Vaz, CP 6066, 13081-970 Campinas - SP, Brasil
Recebido em 5/5/09; aceito em 15/1/10; publicado na web em 23/4/10
This paper proposes a methodology to predict benzene uptake rate in ambient air, using passive samplers with Tenax TA. Variations in the uptake rate were found to occur as a function of the sampling time; and were greater at the beginning of sampling. An empirical model was obtained and values for uptake rate agree with literature. Concentration prediction errors can be minimized by using sampling times of 4 to 14 days, thus avoiding the inluence of excessive uptake rates in the initial days and the inluence of back diffusion at the end of the sampling period.
Keywords: benzene; uptake rate; passive sampling.
INTRODUCTION
Diffusive samplers, also known as passive samplers, were irst developed for monitoring air in the workplace and still are very used for this purpose,1,2 but display a great potential for monitoring ambient air quality.3-6
Continuous monitoring of VOC (volatile organic compounds) today is still only feasible for a few compounds, particularly BTEX. On the other hand, active or pumped sampling, though accurate and applicable to a large number of compounds, is costly and time-con-suming, considering the number of tubes and the total time involved in tubes conditioning, ield monitoring and laboratory analysis, and is therefore usually limited to a small number of collection points and short monitoring periods.
Although monitoring with passive samplers is less precise than with active samplers, it is cheaper and less time-consuming, conside-ring the total time involved, once just two or three tubes are left for all period in each monitoring point, allowing for monitoring more sites for longer periods of time and with fewer samplings. However one is complementary to other, and sometimes it is recommended to get a VOC temporal proile using active samplers at least one time in the evaluated point.
The retention rates of diffusive samplers in the workplace are signiicantly different from those obtained in the ambient air due to the differences in levels of concentration, exposure time and envi-ronmental variations among ield samplings.
Theoretical approach
Active sampling consists of pumping a known volume of air through an adsorbent bed. In passive sampling, the adsorbent is exposed to the ambient air without pumping and the analytes are adsorbed at a rate controlled by molecular diffusion.
The differential equation that describes passive sampling can be written as following Equation 1, based on Fick´s irst law:
(1)
where m is the mass of adsorbed compound (g), t is the sampling time (min), A is the area of the sampler’s cross-section (cm2), D is the coeficient of diffusion of the compound in the air (cm2 min-1), L is the length of the stagnant gaseous layer (cm), Co is the ambient concen-tration of the compound in the air (g cm-3), and C
a is the compound’s concentration in the air layer adjacent to the adsorbent’s surface (g cm-3).
To use Equation 1, one starts from the assumption that the compounds are adsorbed immediately upon reaching the layer of air adjacent to the solid adsorbent.5 This hypothesis is based on the assumption that the concentration of analyte in this adjacent layer (Ca) is equal to zero. In addition, one assumes that the ga-seous layer between the entrance to the sampler and the adsorbent surface is stagnant and that the compound’s concentration in the air is constant over time.
According to the above considerations, Equation 1 can be sim-pliied and integrated to obtain:
(2)
The term (D.A)/L is called the uptake rate (U), which is conside-red constant and can theoretically be calculated based on the sampler’s geometry (depends on tortuosity and available area for gaseous phase) and diffusion coeficient free-air. Its unit can be expressed in cm3 min-1, cm3 s-1 or ng ppm-1 min-1.
Substituting the term of the uptake rate (U) in Equation 2, results in: (3)
The above equation will be called the simpliied passive sampling equation.
air are normally highly variable. In addition, the assumption of rapid adsorption and concentrations close to zero in the layer adjacent to the solid is only applicable for adsorbents with a high adsorbing capacity (ideal or strong adsorbents). This is in direct opposition to the need for using adsorbents with low adsorbing capacity (non-ideal or weak adsorbents) that favor thermal desorption, allowing the adsorbents to be reused, as in the case of Tenax.
Weak adsorbents cannot maintain the aforementioned conditions. In other words, with this type of adsorbent, the concentration in the air layer adjacent to the adsorbent is not zero and it increases as the adsorbent becomes saturated, reducing the concentration gradient and hence, the uptake rate.7 Therefore, the simpliied passive sampling equation cannot be applied satisfactorily.
Equation 1 can be rewritten as follows:
(4)
The term is a ratio that represents the uptake rate in relation to the concentration of the compound of interest in the air, herein called modiied uptake rate (U*). The term D.A/L will hereinafter be called the ideal uptake rate.
For strong adsorbents, the modiied uptake rate is close to the ideal uptake rate (D.A/L) and is constant throughout the sampling time, provided there are no variations in temperature and in the ambient air concentration of the sampling object. For weak adsorbents exposed to real atmospheres, the modiied uptake rate varies according to the sampling time, because Ca concentration depends on the adsorbent-adsorbate adsorption equilibrium and the compound’s concentration in the atmosphere. Therefore, the modiied uptake rate is constant and equal to the ideal uptake rate only in cases where Co is constant and Ca is equal to zero.
This paper proposes a methodology and an empirical correlation to predict the uptake rate of passive samplers in ambient air using Tenax TA, obtained through ield tests.
EXPERIMENTAL Samplers
Perkin Elmer adsorption tubes packed with approximately 200 mg of Tenax TA (2,6-diphenylene-oxide) from Supelco were used for the samplings. Tenax TA has a specific surface area of 35 m2 g-1; size in the range of 60 to 80 mesh; density of 0.25 g cm-3 and low affinity for water. These tubes have the following dimensions: external diameter of 6 mm, internal diameter of 5 mm, length of 89 mm, adsorbent bed of 6 cm, and a 1.5 cm length between the tube entrance and the adsorbent surface (length of the stagnant gaseous layer).
Reagents
Methanol Merck (purity>99.9%) and benzene Merck (purity: 99.7%) were used for preparing standard solutions.
Choice of the tracer compound
Among the various existing VOC, our choice in this study fell on benzene due to its toxicity and carcinogenicity,8 its frequent presence in urban air, and because it is a component that interacts weakly with Tenax TA (the adsorbent used in this study).
Selection of the sampling site
The sampling site, denominated site A, was located in an in-dustrial area with benzene emissions in the city of Paulínia, SP (100 km northwest from the city of São Paulo) (coordinates UTM 7481475N/282130E). The terrain is lat with elevations varying from 680 to 690 m. Data obtained in Campinas, a city 18 km from Paulínia, present mean temperature between 18 and 22 °C in the period from May to September and between 22 and 24 °C in the period from October to April. Average annual precipitation is 1470 mm, and about 80% occur in the period from October to March. During the dry season, relative humidity is as low as 15%, mainly in September, causing discomfort to population.9,10
Active sampling
Active sampling was used as the reference method11 to compare to the results of all passive samplings.
The samples were collected using an automatic Perkin Elmer se-quential tube sampler (STS25), which is used for sese-quential sampling of air onto a series of up to 24 ATD sample tubes. It is a portable unit, and can be operated either by battery or 120 /240 v. A low sampling of 34 mL min-1 was employed for 6-h sampling periods, collecting a volume of 12 L. The sampling time and low employed here were deined based on the work of Sousa.12
Passive sampling
This study was performed in the period from november 11 to no-vember 25, 2002, during Spring season in Brazil. Perkin Elmer tubes were used for passive sampling. Samples were collected in duplicate.
In the passive sampling campaign the sampling time was varied, allowing comparison of different sampling periods. Nine tubes were initially exposed (initial sampling) and were replaced after different periods of exposure, allowing various exposure times in different atmospheric conditions. In this way, it was possible to use a total of 15 tubes, which were exposed to different periods (from 1 to 14 days). Due to this methodology of replacing an exposed tube (e.g, 2 days exposure) by a new one, in some cases, as 2,4,6, 10 and 12 days sampling, it was possible to test them in different periods and exposure times.
Analysis of the samples
The samples were analyzed in a PerkinElmer ATD 400 automatic thermal desorber coupled to a PerkinElmer gas chromatograph with lame ionization detector. The analytic column utilized was a capillary PerkinElmer 5MS (30 m x 0.25 mm i.d. x 0.5 µm ilm thickness).
The tubes were desorbed at 300 °C for 30 min and pre-concentrated in a trap containing Tenax TA kept at -30 °C, after which the trap was heated and the analytes injected into the gas chromatographer (GC). The heating ramp applied in the GC was 40 to 240 °C, at a heating rate of 5 °C min-1. The temperature of the detector was 250 °C.
Calibration
The analytical curve was obtained by introducing the standard solu-tions in the Perkin Elmer tubes, the same used for the collection samples.
An injector was manufactured in the laboratory for introducing the solutions inside the tubes. The injector was kept at ambient temperature (20 oC) and a low of nitrogen 5.0 (100 mL min-1) was carried during 5 min. A security tube was connected in row to the injection tube and both were analyzed to certify that benzene hasn’t been lost in the process.
The analytical curve points were analyzed in the same conditions as the samples (desorption and analysis conditions).
Field blanks
A blank value was considered for active sampling and another one was considered for passive sampling, both of them obtained during campaign. The respective value of blank sample was discounted for all the results obtained. The ield blank in passive sampling consisted of taking a tube to ield, opening and closing it in the monitoring place and analyzing it in laboratory. The ield blank for active sampling consisted of a tube that has been left in the STS25 during a complete sampling period and that has not been subject to air pumping. RESULTS AND DISCUSSION
Data obtained from active samplings resulted in an average ben-zene concentration equal to 13.00 µg m-3, maximum equal to 63.55 µg m-3 and minimum equal to zero.
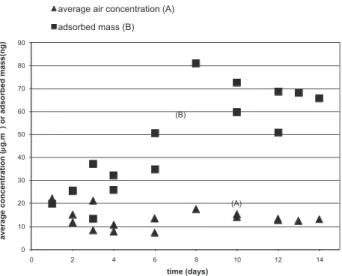
Figure 1 shows the variation in adsorbed mass on the Tenax TA resin (curve B), obtained with passive sampling, as a function of the average concentration in the air (curve A), obtained with active sampling, and the exposure time. Note the increasingly monotonic tendency of the adsorbed mass over the exposure time up to day 8. From the eighth day on, the adsorbed mass showed a tendency to stabilize, probably due to back diffusion. This back diffusion results from the weak interaction of benzene with Tenax TA, hindering the adsorption as the active sites are illed.
In Figure 2 note that there are two different tendencies, depending on the exposure time. In the irst hours of exposure, the uptake rate is high and variable with exposure time. As the exposure progressed, the decrease in the uptake rate became less marked. The decrease was much more marked for short sampling times of up to 4 days.
Based on the results of the mass adsorbed by the passive samplers, the sampling time, and the average concentration for each period of exposure, the uptake rate was determined according to equation 3 for
the data of campaign. All the results obtained are depicted in Figure 2. Note, in Figure 2, that the uptake rate was very high at the beginning of the passive sampling process, reaching a mean value of 108.55 ng ppm-1 min-1 for a sampling time of 6 h (0.25 day).
According to Figure 2, as the exposure progressed, the decrease in the uptake rate became less marked. The decrease was much more marked for short sampling times of up to 4 days.
A comparison of the uptake rate calculated from the data obtai-ned at site in two different periods of 4 days did not show signiicant differences (Table 1).
Based on the experimental data obtained in this study, which incorporate all the environmental variations, especially the varia-tions in benzene concentravaria-tions in the atmosphere, the uptake rate was calculated for each exposure time and adjusted to an empirical correlation, as shown by Equation 5:
U*=m/(Co.t) =c . tα (5)
Figure 3 shows the data represented graphically and the curve adjusted for exposure periods of more than 4 days. The data for exposure periods of less than 4 days were not considered due to the high uptake rate, which might lead to major errors in mean concen-tration estimates.
Thus, we propose the Equation 6 as an empirical model to predict the concentration of benzene in the atmosphere, based on the mass adsorbed in the passive sampling process, using PE tubes with Tenax resin, valid for exposure times of 4 to 14 days:
(6)
where U* is the uptake rate in ng ppm-1 min-1, and t is the sampling time in min. The coeficient of determination (r2) for the adjustment was 0.8582.
Table 2 lists the benzene concentrations predicted according to Equation 6 for the campaign. Calculations for predicted concentra-tion (Co) were obtained using sampling time (t), which represents Figure 1. Variation of adsorbed mass as a function of the benzene average
concentration of air and exposure time obtained at site A
Figure 2. Variation in the benzene uptake rate as a function of sampling time for all the data collected by the passive samplers during campaign
Table 1. Comparison of the uptake rates obtained at site A (industrial area) during a sampling period of 4 days
Sampling period Uptake rate (ng ppm-1 min-1)
Average uptake rate (ng ppm-1 min-1)
nov/11 to nov/15 1.61
1.68 1.59
nov/21 to nov/25 1.69
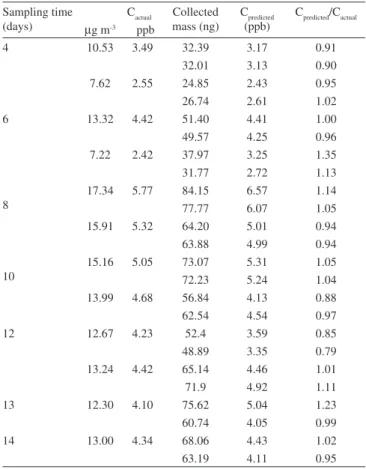
the number of days of campaign converted to minutes, and collected mass (m) obtained during passive sampling. The values were com-pared to actual concentrations (Cactual) which were obtained by active sampling, in the same period and place that passive sampling. The results indicate that only one point fells outside the interval of ± 25%, and 70% of data are inside the interval of ± 10%.
Table 3 shows the U* values obtained by equation 6 and the values reported in the literature for sampling periods of 7 and 14 days.13 A value of U* equal to 1.15 ng ppm-1 min-1 was determined based on the model developed by Tolnai5 while the values in Table 3 were determined experimentally.
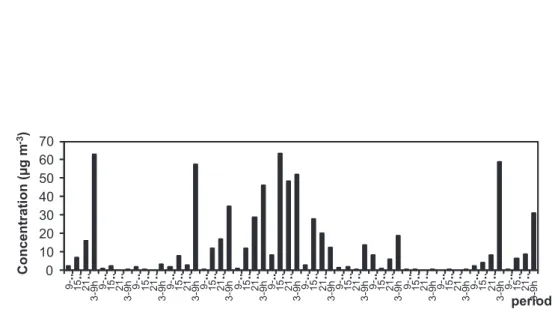
Based on the results of the active samplings (6 h period), it was found that the benzene concentration in the ambient air along the period of exposure underwent major variations that alternated
between high and low concentrations (0 and 63.5 µg m-3). This variation is the result of the spatial and temporal variability of several factors, such as the characteristics of the emission sour-ces, variations in solar radiation, wind direction and speed, and atmospheric stability. There is no legislation about benzene con-centration in outdoor air in Brazil. In European Legislation14 the yearly concentration was established as 5 µg m-3 on December, 2000, with 100% of tolerance, which must be a maximum of 5 µg m-3 by 1 January, 2010. In special situations the limit value can be other, which shall not exceed 10 µg m-3. In our values some are higher than both of these limits but they were obtained for a shorter period of time than one year.
This paper proposed an empirical model to predict the uptake rate based on a large number of data obtained from ield tests in real atmosphere. The use of an empirical model is justiied as an alternative to simpliied models that lead to very signiicant errors. Even the use of strict deterministic models does not overcome the main problem, i.e., the effect of the natural variations in VOC concentrations in the atmosphere.
Equation 6 is valid for sampling periods equal to or greater than 4 days and equal to or less than 14 days for the concentration range normally found in urban atmospheres.
The uptake rates reported in the literature differ from the values determined empirically by the correlation presented here (Equation 6), as indicated in Table 5. This discrepancy between the values is likely due to the different levels of concentration found in each study, since the modiied uptake rate depends on the concentration. The majority of studies reported in the literature were carried out for concentrations in the range of ppm. One study15 worked in the range of 30 to 140 ppb, although their tests were conducted in the laboratory, while another one16 was conducted in a chamber study and in a garage, using 1 to 4 days sampling periods, in low benzene concentrations (12 ppb) and other compounds. The present work was carried out in real atmospheres and concentrations in the ppb range, for different times of exposure (1 to 14 days).
The use of the ideal uptake rate did not lead to good results because the concentration in the layer adjacent to the surface of the adsorbent is not zero due to the weak interaction between benzene and adsorbent. Moreover, the concentration gradient is not constant, since the concentration in the layer adjacent to the adsorbent surface increases as adsorption progresses. The regime is not stationary, since the uptake rate varies as a function of sampling time. The hypotheses do not consider the possibility of the occurrence of back diffusion, which normally results from variations in the concentration in the atmosphere. The concentration of the compound of interest in the atmosphere is not constant, and drastic variations in concentration levels may occur.
In the case of strong adsorbents, the hypothesis that the concen-tration in the layer close to the adsorbent surface tends toward zero, i.e., the transfer of mass is controlled entirely by diffusion, can be accepted. However, the other hypotheses and factors discussed herein still compromise the simpliied model.
Table 2. Comparison of the concentrations predicted by Equation 6 and the actual concentrations at site A
Sampling time (days)
Cactual Collected
mass (ng)
Cpredicted
(ppb)
Cpredicted/Cactual
µg m-3 ppb
4 10.53 3.49 32.39 3.17 0.91
32.01 3.13 0.90
7.62 2.55 24.85 2.43 0.95
26.74 2.61 1.02
6 13.32 4.42 51.40 4.41 1.00
49.57 4.25 0.96
7.22 2.42 37.97 3.25 1.35
31.77 2.72 1.13
8
17.34 5.77 84.15 6.57 1.14
77.77 6.07 1.05
15.91 5.32 64.20 5.01 0.94
63.88 4.99 0.94
10
15.16 5.05 73.07 5.31 1.05
72.23 5.24 1.04
13.99 4.68 56.84 4.13 0.88
62.54 4.54 0.97
12 12.67 4.23 52.4 3.59 0.85
48.89 3.35 0.79
13.24 4.42 65.14 4.46 1.01
71.9 4.92 1.11
13 12.30 4.10 75.62 5.04 1.23
60.74 4.05 0.99
14 13.00 4.34 68.06 4.43 1.02
63.19 4.11 0.95
Table 3. Comparison of the benzene uptake rates calculated from Equation 6 and the uptake rates reported in the literature
Sampling time (days) U (ng ppm
-1 min -1)
Equation 6 Literature
7 1.22 1.45(b)
14 0.76 1.06(b)
0.96(b)
0.86(a,b)
(a) for indoor air. (b) see number 13 of the cited literature.
CONCLUSIONS
The proile of the variation in the uptake rate as a function of exposure times in the range of 0.25 to 14 days was determined experimentally. The uptake rate varied considerably for short expo-sure times, typically of less than 4 days, which may lead to errors in concentration estimates. Therefore, passive sampling at exposure times of less than 4 days is not recommended.
This study also found that the empirical model provides better re-sults than do the simpliied deterministic models. For more meticulous studies, the methodology employed in this study can be applied to obtain speciic models for each region of study, thus incorporating the variation pattern of the VOC concentrations in the local atmosphere.
The empirical correlation of the uptake rate determined in this study can be used in different locations and at different times to determine the benzene uptake rate according to the sampling time required for the sampling. However, this correlation is valid for atmospheres with mean concentrations varying from 2.5 to 6.5 ppb (atmospheres whose daily concentration varies within the range of 0.3 to 30 ppb). The majority of urban and industrial atmospheres fall within this range.
SUPPLEMENTARY MATERIAL
There are two igures in this manuscript included as supplemen-tary material correspondent to a chromatogram for data obtained in passive sampling (Figure 1S) and temporal variation in the benzene concentration along the 14 days of collection (Figure 2S). These igu-res are freely available at http://quimicanova.sbq.org.br, as PDF ile.
REFERENCES
1. Pristas, R.; Am. Ind. Hyg. Assoc. J. 1994, 55, 841.
2. Sunesson, A.; Liljelind, I.; Sundgren, M.; Petterson-Stromback, A.; Levin, J.; J. Environ. Monit. 2002,4, 706.
3. Hafkenscheid, T. H.; Mowrer, J.; Analyst1996, 121, 1249.
4. Uchiyama, S.; Asai, M.; Hasegawa, S.; Atmos. Environ. 1999, 33, 1913. 5. Tolnai, B.; Gelencsér, A.; Gál, C.; Hlavay, J.; Anal. Chim. Acta 2000,
408, 117.
6. Seethapathy, S.; Górecki, T.; Li, X.; J. Chromatogr., A2008, 1184, 234. 7. Nordstrand, E.; Kristentsson, J. A.; Am. Ind. Hyg. Assoc. J.1994, 55,
935.
8. Coutrim, M. C.; Carvalho, L. R. F.; Arcuri, A. S. A.; Quim. Nova2000,
23, 653.
9. http://www.cetesb.sp.gov.br/Ar/relatorios/RelatorioAr2007.zip, access on April, 2010.
10. http://www.cetesb.sp.gov.br/Ar/relatorios/RelatorioAr2006.zip, access on April, 2010.
11. http://www.epa.gov/ttnamti1/iles/ambient/airtox/to-17r.pdf, access on April, 2010.
12. Sousa, K. R. P.; Dissertação de Mestrado, Universidade Estadual de Campinas, Brasil, 2002.
13. Brown, R. H.; J. Environ. Monit.1999, 1, 115.
14. http://ec.europa.eu/environment/air/legis.htm, access on April, 2010. 15. Roche, A.; Thevenet, R.; Jacob, V.; Kaluzny, P.; Ferrari, C.; Baussand,
P.; Foster, P.;. Atmos. Environ.1999, 33, 1905.
Material Suplementar
*e-mail: [email protected]
EXPERIMENTAL DETERMINATION OF BENZENE UPTAKE RATE IN TENAX TA DIFFUSIVE SAMPLERS
Luci Carla Gheleri Andrietta
Bioagri Ambiental, Rua Aujovil Martini, 201, 13420-833 Piracicaba - SP, Brasil
Edson Tomaz* e Ana Claudia Camargo de Lima Tresmondi
Departamento de Processos Químicos, Faculdade de Engenharia Química, Universidade Estadual de Campinas, Cidade Universitária Zeferino Vaz, CP 6066, 13081-970 Campinas - SP, Brasil
Marco Aurélio Cremasco
Departamento de Termoluidodinâmica, Faculdade de Engenharia Química, Universidade Estadual de Campinas, Cidade Univer-sitária Zeferino Vaz, CP 6066, 13081-970 Campinas - SP, Brasil
Figure 1S. Temporal variation in the benzene concentration along the 14 days of collection carried out during campaign obtained with active sampling