N
o
ta
T
é
c
ni
c
a
*e-mail: [email protected]
CHARACTERIZATION OF THE ANTIBIOTIC DORIPENEM USING PHYSICOCHEMICAL METHODS – CHROMATOGRAPHY, SPECTROPHOTOMETRY, SPECTROSCOPY AND THERMAL ANALYSIS
Andreas S. L. Mendez*, Luciano Mantovani, Fábio Barbosa, Carla T. M. Sayago, Cássia V. Garcia, Fávero R. Paula, Fabiana E. B. da Silva e Elton L. G. Denardin
Curso de Farmácia, Universidade Federal do Pampa, BR 472 km 585, Prédio Administrativo, 97500-970 Uruguaiana - RS, Brasil Elfrides E. S. Schapoval
Departamento de Produção e Controle de Medicamentos, Universidade Federal do Rio Grande do Sul, Av. Ipiranga, 2752, 90610-000 Porto Alegre - RS, Brasil
Recebido em 1/11/10; aceito em 14/5/11; publicado na web em 22/7/11
Doripenem was characterized through physicochemical and spectroscopic techniques, as well as thermal analysis. TLC (Rf = 0.62) and HPLC (rt = 7.4 min) were found to be adequate to identify the drug. UV and infrared spectra showed similar profile between doripenem bulk and standard. The 1H and 13C NMR analysis revealed chemical shifts that allowed identifying the drug. Thermal
analysis demonstrated three steps with mass loss, at 128, 178 and 276 oC. The work was successfully applied to qualitative analysis
of doripenem, showing the reported methods can be used for physicochemical characterization of doripenem. Keywords: doripenem; qualitative analysis; physicochemical methods.
INTRODUCTION
Doripenem is a β-methylcarbapenem antibiotic recently approved for clinical use by European Union and United States of America. It shows antibacterial activity against a broad range of Gram-positive and Gram-negative bacteria, as well as a variety of anaerobes,1-3 joi-ning imipenem, meropenem and ertapenem.4,5 The drug is marketed as a crystalline powder for reconstitution and injection, and differently from other carbapenems there is no excipient in the formulation. Observing their chemical structure (Figure 1), different analytical techniques can be chosen to determine the drug in qualitative and quantitative assays, being useful for quality evaluation during han-dling and storage. Doripenem is a (+)-(4R,5S,6S)-6-[(1R)-1-Hydro- xyethyl]-4-methyl-7-oxo-3-[[(3S,5S)-5-[(sulfamoylamino)-methyl]-3-pyrrolidinyl]thio]-1-azabicyclo[3.2.0]hept-2-ene-2-carboxylic acid, with the empirical formula C15H24N4O6S2 and molecular weight of 420.50. It has pKa values of 2.8 and 7.9, and poor lipid solubility (octanol/water partition coefficient = 0.002).6
The literature describes few studies regarding qualitative and quantitative methods applied to identify and quantify doripenem in bulk and pharmaceuticals. Besides, it is not listed in any official code. The main works deal with the evaluation of stability in infusion solutions, using chromathographic analysis by HPLC and derivative UV
spec-trophotometry.7-10 Other studies include the quantitation of doripenem in biological fluids.11,12 For other carbapenems, the works also focus on quantitation by LC, UV spectrophotometry and microbiological assay, applied on stability studies.13-15 For meropenem, Almarsson et al.16 reports the analysis of the drug by proton and 13-carbon NMR coupled with tandem mass spectroscopy, which showed evidence that the structure is stable as CO2 adduct, in solid state and in solution. Nishi-mura et al.17 describes the structural analysis of meropenem by 1H NMR and X-ray diffraction, comparing to other penems and carbapenems.
The present work describes an analytical study applied to charac-terization of the antibiotic doripenem in bulk by different techniques: thin layer chromatography (TLC), HPLC, UV spectrophotometry, infrared spectroscopy, 1H and 13C NMR and thermogravimetric analysis (TGA). The obtained results will allow a complete evaluation of drug identity and also contribute for future quality control studies for carbapenems.
EXPERIMENTAL
Chemicals
Doripenem reference standard (99.4%) and doripenem bulk (mo-nohydrate) were purchased from AK Scientific, Inc. (Mountain View, CA, USA). All chemicals used were of analytical grade and all solvents used for HPLC method were of chromatographic grade. Acetonitrile was purchased from Tedia (Fairfield, CA, USA). Monobasic sodium phosphate, methanol, butyl alcohol, glacial acetic acid and iodine crystals reagent were purchased from Synth (São Paulo, SP, Brazil). Ultrapure water was obtained using a Milli-Q Plus® Millipore (Bedford, MA, USA). TLC plates silica gel 60 (20 x 20 cm) with fluorescent indicator was purchased from Whatman® (Vernon Hills, IL, USA).
Apparatus
For TLC method, the detection was performed by UV 254/365 NH
N H
O2
S NH2
S N
CO2H
O
H CH3
H H3C
OH
3 2 1 5 6
7 3'
2' 5' 4' A
D
B
C
nm lamp Boitton Instruments (Porto Alegre, RS, Brazil). The HPLC method was performed on a prominence liquid chromatograph Shimadzu, equipped with a LC-20AT pump, SIL-20A auto sampler, SPD-20AV UV-Vis detector and CTO-20A column oven (Kyoto, Japan). LC Solution V. 1.24 SP1 system software was used to control the equipment and data analysis. The UV method was developed in a lambda 35 UV/Vis spectrophotometer Perkin Elmer (Norwalk, CT, USA), with 1 cm quartz cells. The infrared spectrometric mea-surements were carried out using Perkin Elmer FT-spectrum BX (Norwalk, CT, USA). NMR experiments were conducted by using a Bruker DPX 400 spectrometer (1H at 400.13 MHz and 13C at 100.62 MHz) (Wissembourg, France). TGA was performed on a SDT Q600 thermogravimetric analyzer TA Instruments (New Castle, DE, USA).
Thin layer chromatography
Doripenem reference standard solution was prepared by dissol-ving 10 mg of drug in 10 mL of methanol to get the concentration of 1.0 mg mL-1. The same procedure was done for bulk. The mobile phase consisted of butyl alcohol:glacial acetic acid:water (4:2:2, v/v/v). Ap-proximately 100 µL of reference standard and bulk doripenem were spotted on the TLC plate, which was transferred to a glass chamber, previously lined with paper and saturated for 15 min with the mobile phase. After development, the plate was dried and examined under UV chamber (254 and 365 nm) and stained with iodine gas.
HPLC
The method was conducted using a reversed-phase technique. Doripenem was eluted isocratically with a flow rate of 1.0 mL min-1 using a mobile phase consisting of 10 mM monobasic phosphate buffer (pH 4.8) and acetonitrile (96:04, v/v). The wavelength of the UV-Vis detector was set to 298 nm. The mobile phase was prepared daily, filtered through a 0.45 µm membrane filter (Millipore) and sonicated before use. A Nucleosil Macherey-Nagel 100-5 C18 column (150 mm x 4.6 mm i.d., 5 µm particle size) (Düren, Germany) was used. The HPLC system was operated at 25 ± 1°C. The injection volume was 20 µL.
For analysis, doripenem reference standard was accurately weighed and dissolved in a 100 mL volumetric flask with purified water to obtain a concentration of 100.0 µg mL-1. This solution was diluted in purified water to yield a final concentration of 20.0 µg mL-1. For bulk, a quantity equivalent of 10 mg of doripenem was transferred to a 100 mL volumetric flask, and the dilution was done according to reference standard. Both bulk and standard solutions were filtered through a 0.45 µm membrane filter (Millipore) before the injection.
UV spectrophotometry
The UV spectrum was obtained in a range of 200-400 nm. For analysis, a quantity equivalent of 10 mg of doripenem bulk and re-ference standard, respectively, was transferred to 100 mL volumetric flasks and dissolved with distilled water to obtain a final concentration of 100 µg mL-1. An aliquot of each solution was diluted with the same solvent until the concentration of 20 µg mL-1, respectively.
Infrared spectroscopy
To obtain the infrared absorption spectra, the spectrometer was coupled to a Miracle ATR Pike Technologies accessory (Waterto-wn, WI, USA), allowing the direct measurement without previous treatment. The spectra were obtained between 4000 and 600 cm-1 at
16 cm-1 resolution. Sixteen successive scans were acquired per sample (reference standard and bulk, respectively).
NMR
Samples for NMR analysis were dissolved either in acetone-d6 at concentration of 0.02-0.05 g mL-1.Each sample was transferred to 5 mm sample tubes and submitted to analysis. Chemical shifts are reported in ppm using tetramethylsilane as an internal standard.
TGA
The analysis was carried out using around 2.5930 mg of the dry samples directly weighed on the platinum pans at a heating rate of 10 ºC min-1. The measurements were performed under nitrogen continuous flow (100 mL min-1) in the temperature range between 25 and 1,000 oC. In order to analyze the obtained thermograms, the least square fit procedure of multigaussian functions was used. The well-known Marquard algorithm for multifunctional fits permitted to analyze the overall degradation process in the partial processes.
RESULTS AND DISCUSSION
Qualitative and quantitative methods have been continuously developed for assay and purity control of drugs. Analytical methods are used to aid in the process of drug synthesis, screen potential drug candidates, support formulation studies, monitor the stability of bulk pharmaceuticals and formulated products, and test final products for release.18 In this way, the use of different techniques in association can be very useful to characterize the drug and to identify impurities or degradation products. In other words, for new pharmaceutical active ingredients under development, sufficient information is required in each phase of an investigation to ensure proper identification, quality, purity, strength, and/or potency.19 Moreover, new analytical approa-ches with high sensitivity are being developed, and their successful performance requires significant testing and validation.20
In this work, a recent parenteral carbapenem antibiotic was qualitatively assayed by different techniques based on its physical-chemical properties. The analysis of doripenem bulk was performed comparing it to a reference standard.
TLC
Aspects such as simplicity and low cost, made TLC used for decades to analyze drugs and impurities. It is considered one of the most effective screening methods, being the simplest of all the widely used chromatographic methods.21 Also, it is considered a very popular technique for the assessment of physicochemical lipophilicity proper-ty in the study of characteristics of drug design.22,23 Nowadays, many works have cited the TLC coupled with densitometry to determine drugs in the presence of impurities or degradations products.24-26 For carbapenems, two works described a TLC assay for analysis of meropenem in degraded sample and pharmaceutical.27,28
HPLC
Nowadays, HPLC is the most widely used analytical technique for determination of drugs, formulations and related impurities. Sample preparation is extremely simple and the errors associated to it are generally kept to a minimum by using HPLC.29 It still remains a method of choice for pharmaceutical analysis, as it is able to sepa-rate quite complicated mixtures of low and high molecular weight compounds, as well as different polarities and acid–base properties in various matrices.30 Besides, HPLC methods should be able to separate, detect, and quantify the various drug-related degradants that can form on storage or manufacturing.31
The HPLC analysis was applied to identify the bulk through comparison to the peak retention time obtained for reference stan-dard, along with other techniques carried out in this work. In order to find the best chromatographic condition, different mobile phase compositions were tested. It was observed that buffer was needed to guarantee a good peak profile. Figure 2 shows the chromatograms for doripenem reference standard and bulk, both with retention time of 7.4 min, which represents a rapid analysis. The system suitability parameters tested can demonstrate the efficiency of the method. The tailing factor observed was 0.95 (RSD of 0.31%), showing the peak symmetry. Theoretical plates of chromatographic separation were 5498.31 (RSD of 1.93%). Capacity factor and theoretical plates per meter were 4.42 and 28969.93, respectively.
UV spectrophotometry
Spectrophotometric methods are the most commonly used te-chniques for drug analysis. The availability of the instrumentation, the simplicity of the procedures, speed, precision and accuracy of the technique still make spectrophotometric methods attractive. Also, spectrophotometric methods of analysis are more economic and simple, when compared to methods such as chromatography and electrophoresis.32,33 In the present work, the UV method was developed in order to provide an alternative technique to identify the antibiotic doripenem. Common solvents were tested, including ethanol, methanol and acetonitrile. However, the higher solubility in water allowed the use of this solvent, which represents a great advantage since the procedure is easy, cheap and fast, not deman-ding residue storage. The spectrum of doripenem in water is shown in Figure 3. A maximum absorption at 298 nm was found for both reference standard and bulk, suggesting that the ultraviolet spectrum can be used for identification of the drug.
Infrared spectroscopy
Infrared spectroscopy is a technique commonly used for iden-tification of drugs as well as for quantitative analysis, being very
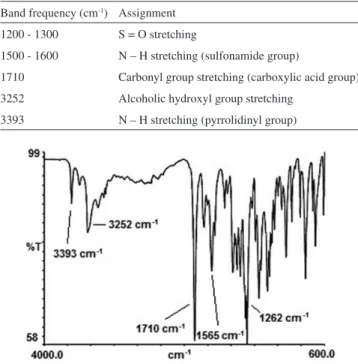
useful to determine structural information about the molecule.21,34-36 Recently, many works have been published describing the use of near-infrared spectroscopy (NIR) in pharmaceutical industry for raw material testing, product quality control and process monitoring.37-40 Doripenem reference standard and bulk were analyzed and the spectral bands were compared peak by peak. The major bands ob-served and their assignments for the molecule are shown in Table 1. The spectrum obtained is illustrated in Figure 4. The bands verified in the spectrum obtained for doripenem bulk correspond in position and relative size to those in the spectrum obtained for reference standard.
NMR
High-resolution NMR spectroscopy is demonstrably one of the most important methods of structure elucidation with an extensive range of biochemical and chemical applications.41 In drug analysis, the characterization of impurities or degradation products is done by using NMR and MS, in association with HPLC.41,42 For carba-penems, mainly meropenem, some works have described the NMR analysis to characterize the antibiotic, the degradation products and impurities.15-17,43
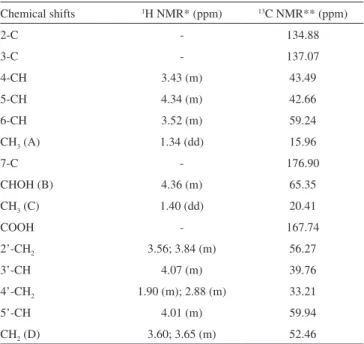
In the present work, the chemical structure of doripenem (Figure 1) was confirmed based on the signals obtained in the spectra. The 1H and 13C NMR data were interpreted and the results are showed in Table 2. The 1H NMR spectrum shows the signal of methyl groups A
Figure 2. Chromatograms of doripenem standard solution (A) and bulk (B)
at 20 µg mL-1 in water. Wavelenght detection: 298 nm
Figure 3. UV spectra of doripenem reference standard (A) and bulk (B) at
20 µg mL-1 in water. Maximum wavelength at 297 nm
Table 1. Infrared frequency assignments of doripenem Band frequency (cm-1) Assignment
1200 - 1300 S = O stretching
1500 - 1600 N – H stretching (sulfonamide group)
1710 Carbonyl group stretching (carboxylic acid group) 3252 Alcoholic hydroxyl group stretching
3393 N – H stretching (pyrrolidinyl group)
and C at δ 1.34 and 1.40 ppm, respectively. The other relevant signal in spectrum is the multiplet at 3.45-3.65 ppm, which is assigned for five protons: H-4 at δ 3.43 ppm and H-6 at δ 3.52 ppm, of penem ring; H-2’ of pyrrolidinyl group at δ 3.56 ppm; and two protons of CH2 (D group, Figure 1) at δ 3.60 and 3.65 ppm. The broad signal at δ 4.60 ppm is due to the proton of aceton-d6, which forms as a result of exchange of deuterium with the NH and OH protons of doripenem. Doripenem showed analogous profile for carbapenem carbon chemical shifts as described in 13C NMR spectrum signals for meropenem.15
TGA
Thermal analytical methods are generally used in the assessment of physico-chemical and thermal properties, analytical composition and material stability.44 Recently, many works have been published describing the application of TGA and DSC techniques for charac-terize different polymers in order to provide information about their stability.45-47 Concerning drugs, many studies are applied to determine their properties when making complexes with transition metal or du-ring investigation about drug release of nanoparticles. 48-53 In the pre-sent study, TGA was applied to characterize the antibiotic doripenem considering its behavior when submitted to heating. The differential and integrated thermogravimetric curves for the drug, obtained with a heating rate of 10 oC min-1 in N
2 atmosphere are shown in Figure 5 and 6, respectively. Analysis of the integrated thermogravimetric curve (Figure 5) shown that the material suffer approximately an 80% degradation in the N2 atmosphere until the temperature of 1,000 oC and different processes were observed, according to Figure 6. It is possible to verify three degradations processes in temperatures of 128, 178 and 276 oC. This behavior suggests higher stability of the solid material until approximately 100 oC.
The data was treated and the mathematical analysis of the di-fferential curves was performed by using the multifunctional fitting procedures. The application of a multi-Gaussian fitting procedure, in the temperature range 25 and 1,000 oC, allowed the determination of well-defined partial degradation processes (Figure 7). These four processes were observed in temperatures of 124, 189, 272 and 307 oC,
respectively. The first three processes observed in Figure 7 are similar to the observed in Figure 6, but the fourth degradation process (307 oC) is not clearly defined in this figure. This process suggests that the degradation of the material starts slowly in temperature near to 75 oC. Evaluating the mass loss (%), the results obtained indicate that the higher material degradation occur in temperature of 307 oC (50.8% mass loss) and smaller at 124 oC (3.99% mass loss), possibly caused by loss of water molecules present in structure of the material. The results obtained suggest that the material suffer modifications during heating, which is possibly related to its stability or the presence of impurities.
CONCLUSIONS
The different physicochemical techniques applied and the mea-surements obtained allowed characterizing the antibiotic doripenem in bulk. The purpose was to provide more detailed information about the drug and to evaluate this behavior during different assays. The chromatographic analysis showed efficiency on separation and iden-tification of doripenem using both TLC and HPLC. The ideniden-tification by UV spectrophotometry and infrared spectroscopy was adequate when the spectra comparison was performed and the same profile Table 2.1H and 13C NMR chemical shift assignment for doripenem. Solvent:
acetone-d6
Chemical shifts 1H NMR* (ppm) 13C NMR** (ppm)
2-C - 134.88
3-C - 137.07
4-CH 3.43 (m) 43.49
5-CH 4.34 (m) 42.66
6-CH 3.52 (m) 59.24
CH3 (A) 1.34 (dd) 15.96
7-C - 176.90
CHOH (B) 4.36 (m) 65.35
CH3 (C) 1.40 (dd) 20.41
COOH - 167.74
2’-CH2 3.56; 3.84 (m) 56.27
3’-CH 4.07 (m) 39.76
4’-CH2 1.90 (m); 2.88 (m) 33.21
5’-CH 4.01 (m) 59.94
CH2 (D) 3.60; 3.65 (m) 52.46
*Measured in 400 MHz. ** Measured in 100 MHz.
Figure 5. Integrated thermogravimetric curve of the doripenem bulk, using
heating rate of 10 oC min-1 and N
2 atmosphere
Figure 6. Derivative thermogravimetric curves of the doripenem bulk, using
heating rate of 10 oC min-1 and N
2 atmosphere
was verified. The 1H and 13C NMR showed chemical shifts that cor-respond to the molecular structure. The thermogravimetric analysis performed demonstrated to be important for future studies involving stability of dried material. It is possible to conclude that the methods proposed complete each other and allow the correct identification of the antibiotic doripenem, also representing a contribution for other carbapenems determination.
REFERENCES
1. Jones, R. N.; Huynh, H. K.; Biedenbach, D. J.; Fritsche, T. R.; Sader, H.
S.; J. Antimicrob. Chemother.2004,54, 144.
2. Jones, R. N.; Sader, H. S.; Fritsche, T. R.; Diagn. Microbiol. Infect. Dis.
2005, 52, 71.
3. Matthews, S. J.; Lancaster, J. W.; Clin. Ther. 2009, 31, 42. 4. Livermore, D. M.; Diagn. Microbiol. Infect. Dis. 2009,63, 455. 5. Paterson, D. L.; Depestel, D. D.; Clin. Infect. Dis.2009, 49, 291. 6. Ortho-McNeil-Janssen Pharmaceuticals Inc.; Doribax® prescribing
information, November 2008 version, Raritan, NJ, USA.
7. Psathas, P. A.; Kuzmission, A.; Ikeda, K.; Yasuo, S.; Clin. Ther.2008,
30, 2075.
8. Berthoin, K.; Le Duff, C. S.; Marchand-Brynaert, J.; Carryn, S.; Tulkens, P. M.; J. Antimicrob. Chemother.2010, 65, 1073.
9. Keel, R. A.; Sutherland, C. A.; Crandon, J. L.; Nicolau, D. P.; Int. J.
Antimicrob. Agents. 2011, 37, 184.
10. Cielecka-Piontek, J.; Jelinska, A.; Spectrochim. Acta, Part A 2010, 77,
554.
11. Sutherland, C.; Nicolau, D. P.; J. Chromatogr., B: Anal. Technol.
Biomed. Life Sci.2007, 853, 123.
12. Ikeda, K.; Ikawa, K.; Morikawa, N.; Kameda, K.; Urakawa, N.; Ohge, H.; Sueda, T.; J. Chromatogr., B: Anal. Technol. Biomed. Life Sci.2008,
867, 20.
13. Sajonz, P.; Natishan, T. K.; Wu, Y.; Williams, J. M.; Pipik, B.; Dimi-chele, L.; Novak, T.; Pitzenberger, S.; Dubost, D.; Almarsson, O.; J. Liq.
Chromatogr. Relat. Technol.2001, 24, 2999.
14. Mendez, A. S. L.; Steppe, M.; Schapoval, E. E S.; J. Pharm.Biomed.
Anal.2003, 33, 947.
15. Mendez, A.; Chagastelles, P.; Palma, E.; Nardi, N.; Schapoval, E.; Int.
J. Pharm.2008, 350, 95.
16. Almarsson, Ö.; Kaufman, M. J.; Stong, J. D.; Wu, Y.; Mayr, S. M.; Petrich, M. A.; Williams, J. M.; J. Pharm. Sci.1998, 87, 663.
17. Nishimura, T.; Igarashi, J.; Sasaki, A.; Sunagawa, M.; Bioorg. Med.
Chem.1998, 6, 367.
18. Chandran, S.; Singh, R. S. P.; Pharmazie2007, 62, 4.
19. FDA - Food and Drug Administration; Analytical Procedures and
Meth-ods Validation, CDER. U.S. Department of Health and Human Services,
2000.
20. O’Kennedy, R.; Townsend, S.; Donohoe, G. G.; Leonard, P.; Hearty, S.; Byrne, B.; Anal. Lett.2010, 43, 1630.
21. Primo, F. T.; Fröehlich, P. E.; Acta Farm. Bonaer. 2005, 24, 421. 22. Lipinski, C. A.; Lombardo, F.; Dominy, B. W.; Feeney, P. J.; Adv. Drug
Delivery Rev.1997, 15, 3.
23. Sherma, J.; Anal. Chem.2000, 72, 9.
24. Kämäräinen, E.; Haaparanta, M.; Siitari-Kauppi, M.; Koivula, T.; Lip-ponen, T.; Solin, O.; Appl. Radiat. Isot.2006, 64, 1043.
25. El-Sherif, Z. A.; El-Zeany, B.; El-Houssini, O. M.; J. Pharm. Biomed.
Anal.2005, 36, 975.
26. Vrakas, D.; Hadjipavlou-Litina, D.; Tsantili-Kakoulidou, A.; J. Pharm.
Biomed. Anal.2005, 39, 908.
27. Mendez, A.; Tese de Doutorado, Universidade Federal do Rio Grande do Sul, Brasil, 2007.
28. Mendez, A.; Dissertação de Mestrado, Universidade Federal do Rio Grande do Sul, Brasil, 2003.
29. Rao, R. N.; Nagaraju, V.; J. Pharm. Biomed. Anal.2003, 33, 335. 30. Nováková, L.; Vlcková, H.; Anal. Chim. Acta2009, 656, 8. 31. Ngwa, G.; Drug. Del. Tech.2010, 10, 56.
32. Ojeda, C. B.; Rojas, F. S.; Anal. Chim. Acta2004, 518, 1. 33. Rojas, F. S.; Ojeda, C. B.; Anal. Chim. Acta2009, 635, 22.
34. Moffat, A. C.; Clarke´s isolation and identification of drugs, Pharma-ceutical Press: London, 1988.
35. Bunaciu, A. A.; Udristioiu, G. E.; Ruta, L. L.; Fleschin, S.; Aboul-Enein, H. Y.; Saudi Pharmac. J.2009, 17, 303.
36. Duri, S.; Majoni, S.; Hossenlopp, J. M.; Tran, C. D.; Anal. Lett.2010,
43, 1780.
37. Reich, G.; Adv. Drug Delivery Rev.2005, 57, 1109.
38. Roggo, Y.; Jent, N.; Edmond, A.; Chalus, P.; Ulmschneider, M.; Eur. J.
Pharm. Biopharm. 2005, 61, 100.
39. EMEA - European Medicines Agency; Guideline on the use of near infrared spectroscopy by the pharmaceutical industry and the data
requirements for new submissions and variations, CHMP - Committee
for human medicinal products, 2009.
40. Pedro, A. M. K.; Ferreira, M. C.; Appl. Spectrosc.2009, 63, 1308. 41. Lindon, J. C.; Nicholsona, J. K.; Wilson, I. D.; J. Chromatogr., B: Anal.
Technol. Biomed. Life Sci.2000, 748, 233.
42. Sun, C.; Wu, J.; Wang, D.; Pan, Y.; J. Pharm. Biomed. Anal.2010, 51,
778.
43. Cai, S.; Hu, C.; J. Pharm. Biomed. Anal. 2005, 37, 585.
44. Pyramides, G.; Robinson, J. W.; Zito, S. W.; J. Pharm. Biomed. Anal.
1995, 13, 103.
45. Cervantes-Uc, J. M.; Cauich-Rodríguez, J. V.; Vázquez-Torres, H.; Licea-Claveríe, A.; Polym. Degrad. Stab.2006, 91, 3312.
46. Golebiewski, J.; Galeski, A.; Compos. Sci. Technol.2007, 67, 3442. 47. Naskar, M.; Chaki, T. K.; Reddy, K. S.; Thermochim. Acta2010, 509,
128.
48. Chetana, P. R.; Siddaramaiah, X.; Ramappa, P. G.; Thermochim. Acta
2005, 425, 13.
49. Zayed, M. A.; Nour El-Dien, F. A.; Mohamed, G. G.; El-Gamel, N. E.
A.; J. Mol. Struct.2007, 841, 41.
50. Sadeek, S. A.; El-Shwiniy, W. H.; J. Mol. Struct.2010, 977, 243. 51. Sadeek, S. A.; El-Shwiniy, W. H.; J. Mol. Struct.2010, 981, 130. 52. Yin, L.; Ding, J.; He, C.; Cui, L.; Tang, C.; Yin, C.; Biomaterials2009,
30, 5691.