NIONI
B
zyxwvutsrqponmlkjihgfedcbaZYXWVUTSRQPONMLKJIHGFEDCBA
Nuclear Instruments and Methods in Physics Research B73 (1993) 85-89
North-Holland Be a m I nt e ra c t ions
w it h M a t e ria ls 8 At om s
Study of oxygen self-diffusion in oxides by ion beam techniques:
comparison between nuclear reaction analysis and SIMS
A.C.S. Sabioni zyxwvutsrqponmlkjihgfedcbaZYXWVUTSRQPONMLKJIHGFEDCBA
Departamento de Fisica, Universidade Federal de Ouro Preto, 35400, Ouro Preto, M C, BrazilF.L. Freire Jr. and C.V. Barros Leite
Departamento de Fisica, Pontificia Universidade Catolica do Rio de Janeiro, Rio de Janeiro, 22453 Rio de Janeiro, RJ, Brazil
B.A. Amami, C. Dolin and C. Monty
Laboratoire de Phy sique des M ateriaux, CNRS, Bellevue, F92195, M eudon, France
F. Millot
Laboratoire des Composes non- Stoechiometriques, ISM A, Universite’ de Paris Xl, F- 91405, Orsay , France
Received 3 August 1992
Oxygen self-diffusion in Fe,_,0 single crystals has been studied by means of the isotope exchange method in Hz/Hz”0 atmospheres. The ‘*O concentration profiles were determined by using two different techniques based on ion beams: secondary ion mass spectrometry (SIMS) and nuclear reaction analysis (NRA); the latter by means of the narrow nuclear resonance reaction ‘“O(p, o)“N at 629 keV, r = 2.1 keV. The diffusion coefficients obtained from the analysis of the measured profiles are in good agreement with those found in the literature. To compare the depth resolution and sensitivity of both techniques, the “0 profiles of implanted Cr,O, single crystals (Erso = 50 keV, fluence = 1.6 X lOI ions/cm’) were also measured.
1. Introduction
Isotopic tracing with 180 is a major tool for studying the microscopic mechanisms of chemical reaction or transport processes involving oxygen. Oxygen self-diffu- sion in ceramics oxides is one of the topics in which the use of isotopic tracing is mandatory.
Among the different techniques for surface charac- terization, two are able to perform depth profile analy- sis with isotopic sensitivity: nuclear reaction analysis (NRA) [l] and secondary ion mass spectrometry (SIMS) [2]. Both techniques are based on the interaction of energetic ions with matter, but in a very different range of energy. The interaction of low-energy heavy ions with the atoms at the surface results in the sputtering of the sample, which produces charged particles that can be analyzed by mass spectrometxy or time of flight
Correspondence too: Dr. F.L. Freire, Jr., Departamento de Fisica, Lab. Van de Graaff, Pontificia Univ. Catolica do Rio de Janeiro, Rio de Janeiro, 22453 Rio de Janeiro, R.J., Brazil.
techniques. A well-known problem of sputter-based analytical techniques is the preferential sputtering. It is especially important in materials containing both low- and high-mass elements as is the case of some ceram- ics. To quantify such measurements the use of stan- dards as close as possible to those of the material studied are necessary. On the other hand, when high- energy light projectiles, such as protons and deuterons, are used as the probe beam, the lack of accuracy of the nuclear cross-sections and the deviation from Bragg’s rule for the electronic stopping power of compound materials are the main limitations for quantitative anal- ysis using nuclear reactions.
The aim of this paper is to compare the study of oxygen self-diffusion in Fe, _*O single crystals by means of SIMS and NRA techniques. In the former, the natural abundance of “0 is used as an internal stan- dard for the “0 concentration depth profiles. The accurate value for the nuclear resonance cross-section 180(p (r)“N at 629 keV measured by Christensen et al. [3]‘was adopted to obtain absolute 180 concentra- tion depth profiles using the NRA technique. To com-
86 A. C.S. Sabioni et al. / Study of oxy gen self- diffusion by ion beam techniques
pare the depth resolution and sensitivity of both tech- niques, the “0 profiles of implanted Cr,O, single crystals were also determined.
2. Experimental procedure
2.1. Sample preparation
High purity single crystals of Fe, _XO and Cr,O, were prepared by conventional techniques. Typically, they had a diameter of 5 mm and were 2 mm thick. The samples were mirror-polished and then annealed in inert atmosphere during 1 h at 1100°C to remove any residual damage caused by the polishing proce- dure.
The “0 diffusion in Fe, _XO crystals was studied by means of the isotope exchange method. The samples were annealed at 700°C in HZ/H,0 (“0 30% rich) atmospheres with the partial pressure of oxygen, deter- mined by the ratio PH20/PHI, ranging from 1.22 X lo-” to 5.15 x 10ez2 atm. Details of this experimental apparatus are published elsewhere [4]. Single crystals of Cr,O, were implanted with 180 ions (energy = 50 keV, fluence = 1.6 X 10¹⁶ ions/cm’) at room tempera- ture. After the implantation and before the oxygen profiling, these samples were annealed at 1400°C dur- ing 1 h in an argon atmosphere to remove the radiation damage.
2.2. SIM S profiling
The depth profiles of ‘so and I60 in Fe,_,0 and Cr,O, crystals were investigated by means of negative secondary-ion mass spectrometry induced by lo-keV Cesium ion bombardment in a Cameca IMS 4F appa- ratus at the Laboratoire de Physique des Materiaux, CNRS, Bellevue. The 160 signals were detected by a Faraday cup which has an efficiency 1200 times smaller than the electron multiplier used to measure the “0 signals. The 56Fe (or 52Cr) signals were also monitored.
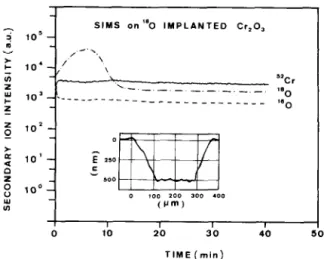
The thickness of the analyzed layer, and so the depth scale calibration, was obtained by measuring the crater depth with a stylus profilometer (DekTak II). A typical result for an “0 implanted Cr,O, crystal is shown in fig. 1. It clearly shows a constant concentra- tion profile for 160 and 52Cr, while the “0 profile has the typical Gaussian shape of implanted species.
The “0 concentration was determined by taking the ratio between Z(“O-) and 1(“0-> +Z(160p>, that is:
Z(‘“O_)
zyxwvutsrqponmlkjihgfedcbaZYXWVUTSRQPONMLKJIHGFEDCBA
n18, =
1(1”0-) +lpom) :
where r(‘aO-) and Z(16Op) are, respectively, the “0
I
I I I I
0 10 20 30 40
TIME(min)
Fig. 1. SIMS profiles on an “0 implanted Cr,O, single crystal. The inset shows the crater profile determined by using
a stylus profilometer.
and 160 intensity signal as a function of the sputtering time. The “0 natural abundance (0.205%) can be used as an internal standard, considering that the difference between the sputtering cross-section of the oxygen isotopes is negligible.
2.3. NRA profiling
The nuclear reaction analyses were performed with the 4 MV Van de Graaff facility at the Departamento de Fisica, PUC-Rio. Two well-known nuclear reaso- nance reactions, 23Na(p, a)20Ne and 27Al(p, yY8Si, were used to establish an absolute energy calibration of the accelerator at 592 and 992 keV, respectively. The energy uncertainty in the results presented here, and thus the surface position, is estimated to be less than 1 keV. The beam energy dispersion is estimated to be of order of 0.7 keV for protons with 630 keV of energy.
The reaction products were recorded by using a 450 mm2 surface barrier detector at 150” from the beam direction (solid angle of 0.102 sr). A 6 pm thick alu- minized mylar absorber was placed in front of the detector in order to stop the backscattered protons. Typically, current beams of order of 30 nA were used. The in-depth “0 concentration profile was deter- mined by increasing the proton energy in steps of 2 keV, which corresponds to a depth resolution of about 14 nm at the surface layer of Fe,_,0 crystals for normal incidence. All the profiles were measured with the beam direction making an angle of 7” with the surface normal to reduce channelling effects.
A.C.S. Sabioni et al. / Study of oxy gen self- diffusion by ion beam techniques 87
3. Results and discussion Table 1
Fig. 2 shows the depth profile of “0 implanted
(&so = 50 keV; fluence = 1.6 x 10¹⁶ ions/cm’) on a Cr,O, single crystal annealed during 1 h at 1400°C in
an argon atmosphere to remove radiation damage.
Besides the SIMS and NR profiles, the oxygen profile simulated by the TRIM-90 code [5], is also shown. In the case of the SIMS analysis, the measured ratio of ‘So nls - see eq. (1) - is converted to oxygen abso-
1ute’con:entration by using the chromium oxide density
(5.21 g/cm3). For this NR profiling, steps of 1 keV for the incident energy were used. The agreement between the profiles obtained with both techniques is excellent. However, despite the fact that the energy straggling was taken into account to convert the a-particle yield
to oxygen depth concentration [l], a systematic devia-
tion with respect to the SIMS profile was observed in the deeper part of the oxygen profile. This fact can be
attributed to deviation of energy straggling from the
adopted Bohr’s values.
The main sources of errors are, in the case of NR profiling, the nuclear reaction cross-section, of order of 5% [3], and the stopping-power, also of order of 5%. Statistical errors are negligible and the absolute mea- surements of proton doses have an accuracy of 3%. For the SIMS profiling, the main source of errors is the
uncertainty in the crater depth measurement, esti-
mated to be of the order of 5%.
Table 1 presents the measured values for the re- tained dose (4>, projected range (R,) and straggling (AR,). The results obtained from the TRIM simula- tion are also quoted. The agreement between experi-
“E 2.60 c
50keV ‘“0 - Cr,O, U
2
m
F4 0 - 195
z F a 1.30 E 2 8 ; 0.65
- TRIM90 SIMULATION 0 SIMS PROFILE
l NR PROFILE _
zyxwvutsrqponmlkjihgfedcbaZYXWVUTSRQPONMLKJIHGFEDCBA
50 100
DEPTH (nm)
Fig 2 ‘“0 profile measured by SIMS and NRA on a Cr,O, . . implanted crystal (E1sO = 50 keV, fluence = 2 X 1OL6 ions/cm2) annealed at 1400°C during one hour. The TRIM
simulation for the implantation profile is also shown.
Retained dose (I#J), projected range (R,) and straggling (AR,) of 50 keV 180-implanted in Cr,O, crystals after annealing
during 1 h at 1400°C in an argon atmosphere. TRIM-90
results are also quoted
f#~ [1016 ions/cm’] R,
bml
AR, bml
SIMS 1.56 k 0.08 59&2 23+2
NRA 1.62kO.11 60*8 25+8
TRIM-90 1.6 67.2 26.4
mental and simulated profiles is good, as the annealing
used to remove radiation damage produced only a
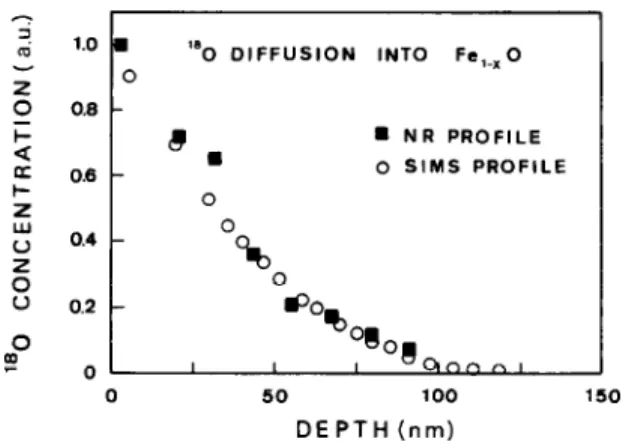
slight redistribution of the implanted species [6]. Fig. 3 compares the 180 diffusion profiles measured in Fe, _XO single crystals by using SIMS and NRA. The diffusion experiment was made by means of the isotope exchange method at 700°C during 1 h at a partial pressure of oxygen equal to 5.15 X lO_” atm (PH,& PHz = 0.602). The experimental data are normalized by
the surface concentration. Again, the agreement be-
tween the SIMS and NR profiles is excellent. However, shallower oxygen diffusion is difficult to be followed by
using NR due to the low depth resolution of this
technique. In fact, for depths smaller than 30 nm, NR profiling makes no sense. On the other hand, for oxygen penetration much deeper than 150 nm, the use of the 629 keV resonance is complicated due to the difficulties in taking into account the off-resonance
contributions to the a-particle yield. For SIMS profil-
ing the major difficulty comes from sample inhomo- geneities, e.g., grain short-circuits for oxygen diffusion, due to the very small beam size, which is of the order of tenths of microns in diameter.
The self-diffusion oxygen coefficients were deter- mined by the solution of Fick’s second law for a
“0 DIFFUSION INTO Fe,_,0
m NR PROFILE 0 SIMS PROFILE
J
0 50 100 150
DEPTH (nm)
Fig. 3. ‘“0 profile measured by SIMS and NRA on a Fe, _1O single crystal annealed 1 h at 700°C in an atmosphere of
A. C. S. Sabioni et al. / Study of oxy gen self- diffusion by ion beam techniques
88
2.0
v) y 1.5 0
I
- 1.0
‘= al
~ 0.5
G
zyxwvutsrqponmlkjihgfedcbaZYXWVUTSRQPONMLKJIHGFEDCBA
r
I I I I
0
zyxwvutsrqponmlkjihgfedcbaZYXWVUTSRQPONMLKJIHGFEDCBA
50 100 150DEPTH(nm)
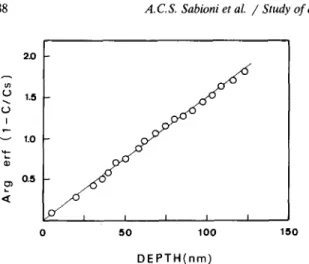
Fig. 4. Arg erf(l- C/C,) as a function of depth for the “0 profile shown in fig. 3. C, is the “0 surface concentration.
semi-infinite medium with constant surface concentra- tion [7]:
1 - C/C, = erf[ x/2( Dt)“.5], (4
where C is the ‘so surface concentration, C is the concentrition of 180 at a depth x, t is the annealing time and D is the diffusion coefficient. The natural abundance of “0 is subtracted in C and C,.
Considering that the argument of the error function is proportional to x as shown in fig. 4, we have:
arg erf(1 - C/C,) = ax, (3)
where
n = 1/[2(Dt)““].
(4)
Then, the determination of the slope of the line in fig. 4 permits the calculation of the diffusion coeffi- cient.
The solution of Fick’s second law described by eq. (2) is valid when the incorporation time of the tracer element at the sample surface is small compared to the diffusion time. In the case of slower incorporation kinetics or sample surface evaporation, more complex solutions should be considered [8,9]. In table 2 we present our experimental diffusion coefficients ob- tained by SIMS and NRA.
Table 2
180 diffusion parameters in Fe,_,0 crystals. The errors in the diffusion coefficients are of order of 10% for SIMS analysis and 15% for RN profiling
T PC1 Po, latml t lsl D [cm*/s]
SIMS RN
700 1.22~ lOW*’ 3.72x lo3 3.2~ lo-l5 700 2.82~ 1O-21 3.6 x lo3 2.1 x lo-‘5
700 5.15~ 1O-22 3.6 x lo3 2.9x lo-‘s 3.5~ lo-l5 zyxwvutsrqponmlkjihgfedcbaZYXWVUTSRQPONMLKJIHGFEDCBA
-10
-11
z -12 “E
0
0 n, -13 0 -
-14
-15
“0 DIFFUSION INTO Fe,,0
OUR RESULTS
Q
6 RNA ,P,z,, I PH1=0.60-2.41 0 SIMS, P. ,,I P. = 0.60 ., 9
0
,”
.
.
0
0 0
REpF&ENCE [lo] cIcl’Pco o 0.56 0 1.00 . 1.74 0 2.74
.
I I I I
7 8 9 10
l$/ T (k-' )
Fig. 5. ‘“0 diffusion coefficient in Fe,_,0 as a function of temperature.
For oxygen self-diffusion in Fe,_,O, the results published by Yamaguchi and Someno [lo] are the only ones that can be found in the literature. They studied the ‘so diffusion in Fe, _XO polycrystalline samples obtained by the oxidation of iron foils. The grain size was of order of 3 mm. The isotopic exchange method was also employed, with the oxygen partial pressure controlled by the gaseous mixture of CO and CO,, the last containing ‘a0. The temperature range was 820°C to 1182°C and the SIMS technique was used to mea- sure the profile of the oxygen isotopic tracer. Their results are presented in fig. 5. When extrapolated to lower temperatures, they are in good agreement with our values obtained using RN and SIMS.
The influence of the oxygen partial pressure on the structure of point defects in the oxygen sublattice and, consequently, on the oxygen diffusivity, will be dis- cussed in another publication [4].
4. Summary and conclusion
The oxygen self-diffusion in Fe,_,0 crystals was studied by means of the isotopic exchange method at 700°C with the ‘*O profiles being determined by SIMS and NR.
A.C.S. Subioni et al. / Study of oxy gen self- diffusion by ion beam techniques 89
analysis can be used with good results, when the reso- nance at 629 keV in the t80(p, a)15N reaction is cho- sen for the determination of the oxygen tracer diffu- sion profile.
Acknowledgements
This work was supported in part by the Brazilian Agencies: SCT, CNPq and CAFES and by the French Agency, CNRS.
References
[l] Cl. Amsel and B. Maurel, Nucl. Instr. and Meth. 218 (1983) 183, and references therein.
[2] P. Williams, in: Applied Atomic Collision Physics, eds. H.S. Massey, E.W. McDaniel and B. Bederson (Academic Press, New York, 1983) vol. 4, p. 327.
[3] N.S. Christensen, F. Jensen, F.B. Besenbacher and I. Stensgaard, Nucl. Instr. and Meth. B.51 (1990) 97. [4] AC. Sabioni, A.M. Hun&, F. Millot and C. Monty,
Philos. Mag. A66 (1992) 351.
[5] J.F. Ziegler, J.P. Biersack and U. Littmark, The Stopping and Range of Ions in Solids, vol. 1 (Pergamon, New York, 1985).
[6] A.C. Sabioni, Ph.D. thesis (1990) Orsay, unpublished. [7] J. Philibert, Diffusion et Transport de Matiere dans les
Solides (Les Editions de Physique, Les Ulis, 1988) p. 7. [8] J. Crank, The Mathematics of Diffusion (Clarendon,
Oxford, 1956).
[9] R.J. Tarento, Rev. Phys. Appl. 24 (1989) 11.