Nota Técnica
*e-mail: [email protected]
#Artigo em homenagem ao Prof. Otto R. Gottlieb (31/8/1920 – 19/6/2011)
A VALIDATED HPLC ANALYTICAL METHOD FOR THE ANALYSIS OF SOLASONINE AND SOLAMARGINE IN
IN VITRO SKIN PENETRATION STUDIES#
Renata F. J. Tiossi, Juliana C. Da Costa, Mariza A. Miranda, Fabíola S. G. Praça, Maria Vitória L. B. Bentley e Jairo K. Bastos*
Faculdade de Ciências Farmacêuticas de Ribeirão Preto, Universidade de São Paulo, Av. do Café, s/n, 14040-903 Ribeirão Preto – SP, Brasil
James D. McChesney
Arbor Therapeutics, LLC, 145 County Road 245, Etta, MS 38627, USA
Recebido em 30/5/12; aceito em 25/8/12; publicado na web em 9/11/12
To assess topical delivery studies of glycoalkaloids, an analytical method by HPLC-UV was developed and validated for the determination of solasonine (SN) and solamargine (SM) in different skin layers, as well as in a topical formulation. The method was linear within the ranges 0.86 to 990.00µg/mL for SN and 1.74 to 1000.00 µg/mL for SM (r = 0.9996). Moreover, the recoveries for both glycoalkaloids were higher than 88.94 and 93.23% from skin samples and topical formulation, respectively. The method developed is reliable and suitable for topical delivery skin studies and for determining the content of SN and SM in topical formulations.
Keywords: solasonine; solamargine; validation.
INTRODUCTION
Solanum lycocarpum A. St.-Hil. (Solanaceae) is commonly kno-wn as “wolf fruit”,1,2 and is native to the Brazilian Cerrado, where
it grows and develops under unfavorable environmental conditions, being capable of supporting sustained period of drought.1
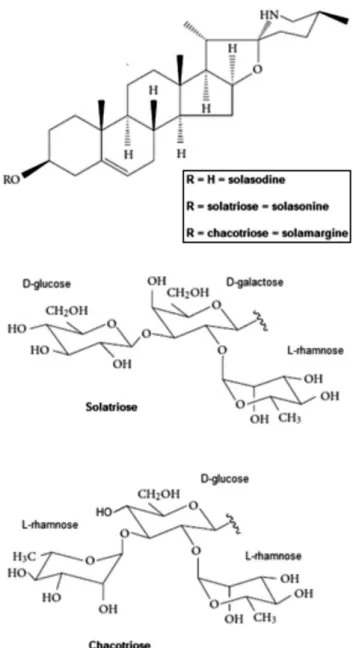
S. lycocarpum bears about 40 to 100 fruits per adult individual, weighing between 400 to 900 g each. The alkaloidal extract (AE) can be obtained from these fruits which yield approximately 1.5% (extract/dried fruits), furnishing a high level of the glycoalkaloids solasonine (SN) and solamargine (SM) (Figure 1), attaining 45.1 and 44.3% (w/w), respectively.3 Structurally, SN and SM share a
common steroidal aglycone, solasodine, which has been used for the production of steroidal drugs.4 Previous studies have shown
that these glycoalkaloids display antifungical,5,6 schistosomicidal,7
antiprotozoal,8 molluscicidal,9 antiviral,10 antimutagenic,11 and
an-tineoplasic activities against a variety of neoplastic cell lines,12-14 as
well as hypoglycemic and gastric emptying inhibitory activities.15
As stated by Gottlieb and collaborators,16 Brazilian biodiversity
is an important source of wealth, and its benefits do not only depend on the use of biodiversity, but also in its sustainability for proper economic exploitation.
Whereas SN and SM exhibit a variety of biological activities and S. lycocarpum produces a significant amount of fruit throughout the year, the glycoalkaloids obtained from these fruits could be used to develop new pharmaceuticals.3 In addition, topical and transdermal
drug delivery provides several potential advantages in comparison to other administration routes, since the first-pass hepatic metabolism is avoided leading to fewer side effects.17
Studies have highlighted the biological potential of the glyco-alkaloids, SN and SM, against topical diseases such as herpes,10
der-matophytes6 and skin cancer.14 Nevertheless, no studies are available
assessing the penetration of these compounds into/through the skin. Consequently, S. lycocarpum extract containing SN and SM,
could be incorporated into a formulation to treat topical diseases. Moreover, it is desirable that topical formulations offer good pene-tration and retention in the skin, with minimal systemic absorption.18
The standard apparatus used to evaluate drug permeation through the skin is the Franz-type diffusion cell, which can provide useful information on topical and transdermal drug delivery. It is also neces-sary to develop a validated analytical method to predict if an adequate amount of the drug is released from the formulation and has reached viable layers of the skin.19,20 In order to analyze complex samples, such
as ointments and creams, high performance liquid chromatography (HPLC) is a good tool not only for separating target compounds, but also for revealing the peaks interfering with the analytes.21 Moreover,
to develop a phytotherapic, it is important to validate an analytical method which presents good performance parameters such as selec-tivity, linearity, accuracy, precision and recovery over the specified range that an analyte is analyzed.22
Therefore, the aim of the present work was to develop and validate an HPLC method to quantify SN and SM in a topical formulation and their respective skin penetration.
EXPERIMENTAL
Reagents and chemicals
HPLC grade acetonitrile (MeCN), methanol (MeOH) and ethanol (EtOH) were obtained from Mallinckrodt Co. (Xalostoc, Mexico); anhydrous disodium hydrogen phosphate was acquired from Carlo Erba Reagents (Brazil) and deionized water was purified by Milli-Q-plus filter systems (Millipore, USA). Analytical grade cetylpyridinium chloride (CP), EtOH, propylene glycol, hydrochloric acid, sodium hydroxide, methylparaben (nipagin) and propylparaben (nipazol) were purchased from Synth (Brazil). Hydroxyethyl cellulose gel (Natrosol®)was purchased from Galena (Netherlands); ethoxydiglycol
(Transcutol CG®) was obtained from Gatefosse (France); and
mono-olein 18-99 K (MyverolTM) was acquired from Quest (Netherlands).
The adhesive tape DurexMR and Durex 500MR was acquired from 3M
by Dr. J. D. McChesney from Ironstone Separations, with purities estimated to be greater than 96% for both compounds.
Skin preparation
Porcine ear skin as a biological membrane model was employed as described by Lopes et al..23 For this method, the skin of the outer
portion of the porcine ear was dissected, dermatomized at a thickness of 500 µm and stored at -20 ºC, before experimentation, respecting the maximum period of 30 days.
Preparation of Solanum lycocarpum extract
The fruits of S. lycocarpum were collected in Cajuru, São Paulo state, Brazil, during the summer season in January 2008 and dried under air circulation in an oven at 45 °C and powdered in a ham-mer mill. Voucher specimens (SPFR: 11638) were deposited at the Department of Botany, Faculdade de Filosofia Ciências e Letras de Ribeirão Preto, University of São Paulo, São Paulo state, Brazil and authenticated by Prof. M. Groppo.
The powder of the dried fruits (1.0 kg) was submitted to acid-base extraction, which entails a selective method to obtain alkaloids. The material was first acidified (pH 2.0) with hydrochloric acid (0.2 M) and then submitted to overnight maceration, followed by filtration. Subsequently, the aqueous acid extract was basified (pH 12.0) using sodium hydroxide (6.0 M) and also submitted to overnight maceration. The following day, the supernatant was removed, the precipitate was centrifuged and the pellet suspended in EtOH with shaking. The EtOH soluble fraction was concentrated under vacuum and lyophilized to furnish 1.6% AE in dry weight, containing 45.09 ± 1.14% of SN and 44.37 ± 0.60% of SM.3
Preparation of formulation
The formulation tested was prepared using the nonionic polymer hydroxyethyl cellulose gel base (2%), propylene glycol (1%), me-thylparaben (0.18%), propylparaben (0.02%), and sodium phosphate buffer (pH 6.5, 0.1 M). The formulation prepared comprised AE (5%) dissolved in propylene glycol (4%) and monoolein (5%) in hydroxyethyl cellulosegel base.
Analytical HPLC conditions
The analytical method was developed and validated on an HPLC apparatus (Shimadzu, Japan) with UV detection (SPD–M10Avp), using a multisolvent delivery system (LC-10AD), autosampler (SIL-10ADvp), controller module (SCL-10Avp) and Class VP 5.02 software to collect and analyze data. A Zorbax SB-C18 analytical reverse phase column (250 x 4.6 mm i.d.; 5 µm particle size) (Agilent Technologies, USA) was used, coupled with a guard column from the same company.
Sodium phosphate buffer (pH 7.2, 0.01 M) (pump A) and MeCN (pump B) were used as mobile phase at gradient flow. The multilinear gradient elution program was employed at a flow-rate of 1.0 mL/min, consisting of: 0-11.5 min (36.5% B, isocratic); 11.5-12 min (85% B, linear gradient); 12-16 min (85% B, isocratic, washing column); 16-17 min (36% B, linear gradient); 17-25 min (36.5% B, column equilibration). After filtering (Millex-LCR-PTFE (Millipore, 0.45 µm) 20 µL of each sample were automatically injected and analyzed with detection at 200 nm.
Validation of HPLC method
Validation was undertaken following the parameters described by the Brazilian Sanitary Vigilance Agency (ANVISA),24 Food and
Drug Administration (FDA)25 and Ribani et al.,26 including linearity,
limits of detection (LOD) and quantitation (LOQ), selectivity, pre-cision (intra-assay and inter-assay), accuracy and recovery. Thus, the analytical method was validated to assay samples obtained from stratum corneum (SC), epidermis plus dermis ([EP + D]) and receptor solution (RS) as well as topical formulation.
Selectivity
The selectivity and search for interfering peaks were performed by comparing the chromatographic profiles of chromatographic stan-dards SN and SM, AE, the topical formulation, as well as the spiked samples of AE at 75 µg/mL in SC, [EP + D] and RS. The RS was composed of sodium phosphate buffer (pH 7.2, 150 µM) plus CP 1%. The resolution (Res) of the peaks was determined using the formula: Res = 2 (tr2 - tr1)/ (Wb1 + Wb2) (1) in which tr = retention time, Wb = width of the base.27
Figure 1. Chemical structures of Solanum lycocarpum glycoalkaloids:
Linearity
The linearity of the analytical standards SN and SM was deter-mined by constructing analytical curves, from which the respective correlation coefficients (r) were determined.
Solutions were prepared in EtOH 80% considering a wide range of glycoalkaloid concentrations from 0.77 to 1000 µg/mL of SN and 0.78 to 990 µg/mL of SM, producing 22 data points for each compound. All analyses were performed in triplicate. The external standard method was employed for quantitation.26
Limit of detection and limit of quantitation
The LOD and LOQ were determined based on the parameters of analytical curves, considering standard deviation of the responses (s) and the slope of the analytical curves (S). Thus, the curves were produced in triplicate and values applied to Equations 2 and 3:28
LOD = 3.3 x s/S (2)
LOQ = 10 x s/S (3)
Precision
The precision parameter was evaluated at two levels of precision, repeatability (intra-assay) and intermediate precision (inter-assays). The intra-assay was undertaken by analyses of 6 repetitions of analyti-cal standards at different concentrations (6.25, 25.00 and 50.00 µg/ mL) on the same day under the same experimental conditions. For the inter-assay evaluation, solutions at the same concentrations were analyzed on two different days. The data obtained were expressed as relative standard deviation (RSD %).26
Accuracy and recovery of glycoalkaloids from skin layers
Accuracy was evaluated through the recovery of glycoalkaloids in skin sections of SC and [EP + D], spiked with AE compared to the control group according to FDA guidelines.25 For this procedure,
skin sections measuring 1.77 cm2 in area were processed to obtain
the SC using adhesive tape by the tape stripping technique, and the remaining skin sections were finely perforated to obtain [EP + D], as described by Lopes et al..23 After this step, these samples were
spiked by adding AE solutions using EtOH 80% (v/v) as the solvent at three levels of concentration: low, medium and high, correspon-ding to 37.5, 75.0 and 100.0 µg/mL, respectively (n = 4), equivalent to 14.75, 29.51 and 39.34 µg/mL of SN and 14.51, 29.02 and 38.69 µg/mL of SM. The control for each level was achieved by addition of the sample volume into an empty tube. After drying the solvent of the solution added, these matrices were extracted using 3 mL of MeOH, stirring for 1 min in a vortex and sonicating in a bath for 30 min. The resultant mixtures were then centrifuged for 10 min at 3125 g, filtrated, and SN and SM were quantified. The results were expressed as mean recovery percentage (R) according to Equation 4:
R1 = (test area of compound)/(control area of compound) x 100 (4)
Accuracy and recovery of glycoalkaloids from topical formulation The recovery of glycoalkaloids was evaluated by spiking 5 mg of AE in 100 mg of formulation, corresponding to 2.26% of SN and 2.22% of SM. Subsequently, an aliquot of 5.3 mg of formulation was solubilized in 3 mL of EtOH 80% (v/v) (n = 4). These solutions were centrifuged for 10 min at 3125 g, filtrated using 0.45 µm mem-branes, and SN and SM then quantified. Accuracy was expressed as the relationship between the experimental concentrations (E) and the theoretical concentrations (T) according to Equation 5:
R2 = (E)/ (T) x 100 (5)
RESULTS AND DISCUSSION
In a topical delivery study, the use of a reliable analytical method for quantification of assayed compounds is mandatory. The analytical method employing an isocratic elution and internal standard method for quantification of SN and SM in plant biomass has been previously reported.3 However, the challenge is even greater for the development
of a method for quantification of glycoalkaloids in complex matrices, such as skin layers and pharmaceutical formulations. Thus, an analyti-cal method employing a multilinear gradient and an external standard was developed and validated for determining these glycoalkaloids in both skin layers, RS, and in topical formulations.
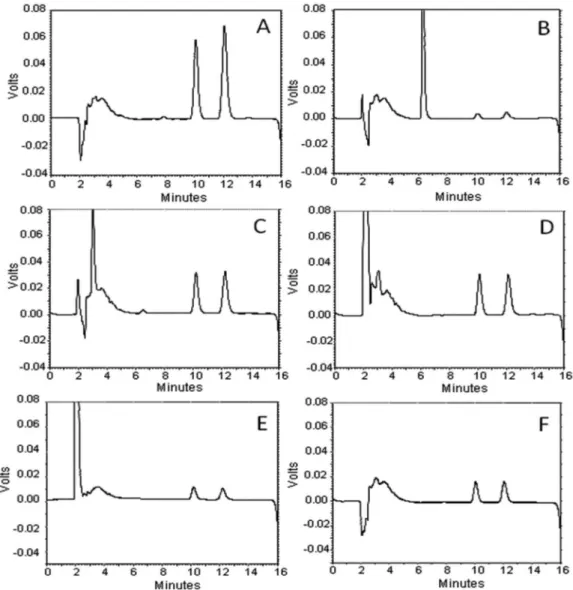
The selectivity of the method was evaluated considering all the samples provided from topical delivery assays: SC, [EP + D], RS and topical formulation. The peaks were identified by comparing with retention times of authentic standards. The retention times obtained for SN and SM were 10.3 and 12.3 min, respectively, with a resolution of 2.92. No interference peaks were found from skin layers, using adhesive tape or topical formulation (Figure 2). It is important to point out that the adhesive tape DurexMR (3M) produced an interfering peak
in the chromatogram, whereas the use of the adhesive tape Durex 500MR (3M) did not interfere with the analysis. In this regard, the
HPLC analytical method provided good selectivity and resolution for the glycoalkaloids assayed.
The analytical curves were constructed for SN and SM by plot-ting peak area ratios against the concentration of standard solutions. Linearities were observed over the concentration ranges 0.86 to 990.00µg/mL for SN and 1.74 to 1000.00 µg/mL for SM, showing a highly significant correlation coefficient (r) of 0.9996 for both glycoalkaloids, as described by Tiossi et al..3 For quantification of
SN and SM, the regression equations of the obtained curves were considered,26 according to Equations 6 and 7:
y = 5603.2 x + 9026 for SN (6)
y = 6433.3 x + 9204 for SM (7)
where y corresponds to the area of the compound and x to the con-centration of the compound in µg/mL.
To determine the LOD and LOQ of the developed method, the method based on parameters of the calibration curve was adopted, since this is more reliable as it does not depend on analyst interpre-tation, as does the visual method.26 The LOD and LOQ obtained
were 0.29 and 0.86 µg/mL for SN, and 0.57 and 1.74 µg/mL for SM, respectively, as described by Tiossi et al.,3 which showed adequate
sensitivity for the analytical assay.
The precision of the method was determined by repeatability (intra-assay) and intermediate precision (inter-assay), and represented as the RSD (Table 1). The intra- and inter-assay precisions displayed RSD values lower than 9.18%, which were satisfactory, considering the limits of 15% recommended by FDA25 and ANVISA.24
To ensure quantification of the analyzed compounds, it is necessa-ry to confirm whether the method of extraction and sample preparation allows accurate quantification of the amount of target compounds in the final matrices.26 Thus, the accuracy and recovery of skin samples,
as well as of topical formulation, were evaluated (Tables 2 and 3). The recovery from skin ranged from 88.94 to 102.19% for SN and 94.75 to 103.56% for SM. For the topical formulation, recovery was 93.23% for SN and 94.14% for SM. The errors and precision obtained for skin samples and topical formulation recoveries were lower than 10.59 and 12.26%, respectively. This represents good analytical recovery, considering accepted values of 80 to 120% for recovery and a limit of 20% for precision.25 Comparing against the
Table 1. Intra-assay and inter-assay precision for HPLC-UV solasonine (SN) and solamargine (SM) determination
Conc. (µg/mL)
Intra-assay (RSD)a Inter-assay (RSD)b
SN SM SN SM
6.25 9.18 2.98 8.40 8.74
25.00 1.99 2.09 8.58 7.91
50.00 6.52 2.15 1.48 6.91
RSD: relative standard deviation; a 6 replicates determination on the same day; b 6 replicates determination on different days.
Table 2. Accuracy and recovery of solasonine (SN) and solamargine (SM) in different skin layers
SC [EP+D]
MR (%) ± SD RSD Error (%) MR (%) ± SD RSD Error (%)
Solasonine
Low 99.89 ± 0.95 0.95 0.11 95.82 ± 10.03 10.46 4.18
Medium 102.19 ± 4.52 4.42 2.19 89.41 ± 6.75 7.55 10.59
High 88.94 ± 4.60 5.17 11.06 90.32 ± 5.53 6.12 9.68
Solamargine
Low 97.76 ± 9.13 9.34 2.24 103.56 ± 12.70 12.26 3.56
Medium 97.08 ± 2.03 2.09 2.92 94.75 ± 3.41 3.59 5.25
High 96.89 ± 3.46 3.57 3.11 95.55 ± 2.03 2.12 4.45
Stratum corneum (SC); epidermis plus dermis [EP + D]; MR: mean recovery (n = 4); SD: standard deviation; RSD: relative standard deviation.
Figure 2. HPLC-UV chromatographic profiles of standards of solasonine (SN) and solamargine (SM) (A), topical formulation (B), samples spiked with alkaloidic
extract (AE): stratum corneum (SC) (C), epidermis plus dermis [EP + D] (D), receptor solution (RS) (E), and AE of Solanum lycocarpum (F)
extract in skin layers,29 our method was more efficient in the recovery
of SN and SM. Furthermore, comparing with the results obtained for SN and SM recoveries from plant biomass by Tiossi et al.,3 it is
clear that the recoveries were similar regardless of the matrices and extraction procedures. Thus, the proposed extraction procedures proved suitable for recovery of SN and SM from the skin, as well as from the topical formulation.
Table 3. Accuracy and recovery of solasonine (SN) and solamargine (SM) in topical formulation Theorical conc.
(%) (w/w)
Experimental conc.
(%) (w/w) MR (%) ± SD RSD Error (%)
Solasonine 2.26 2.11 93.23 ± 2.47 2.65 6.77
Solamargine 2.22 2.12 94.14 ± 0.77 0.82 5.86
Conc.: concentration; MR: mean recovery (n = 4); SD: standard deviation; RSD: relative standard deviation.
developed method can be used not only for formulation development and its ability to deliver the desired compounds into skin, but also as a tool for routine use in the pharmaceutical industry for quality control. CONCLUSION
The performance characteristics of the method proposed proved suitable and reliable for the intended analytical applications. Thus, the method developed could be routinely applied in topical delivery skin studies for SN and SM determination in topical formulations. ACKNOWLEDGMENTS
This work was supported by Fundação de Amparo à Pesquisa do Estado de São Paulo- FAPESP (proc. 2007/57538-1). The au-thors are grateful to Prof. Dr. M. Groppo Jr., Faculdade de Ciências e Letras de Ribeirão Preto-SP for plant identification. We are also thankful to M. Ogasawara, V. Lopes, J. O. Del Ciampo and H. Diniz for technical support.
REFERENCES
1. Clerici, M. T. P. S.; Kallmann, C.; Gaspi, F. O. G.; Morgano, M. A.; Martinez-Bustos, F.; Chang, Y. K.; Food Res. Int. 2011, 44, 2143. 2. Lorenzi, H.; Plantas Daninhas do Brasil, 3a ed., Instituto Plantarum:
Nova Odessa, 2000.
3. Tiossi, R. F. J.; Miranda, M. A.; Sousa, J. P. B.; Praça, F. S. G.; Bentley, M. V. L. B.; McChesney, J. D.; Bastos, J. K.; J. Anal. Methods Chem.
2012, 2012, 8.
4. Soares-Mota, M. R.; Schwars, A.; Bernardi, M. M.; Maiorka, P. C.; Spinosa, H. S.; Exp. Toxicol. Pathol. 2010, 62, 549.
5. Fewell, A. M.; Roddick, J. G.; Weissenberg, M.; Phytochemistry1994, 37, 1007.
6. Pinto, F. C. L.; Uchoa, D. E. A.; Silveira, E. R.; Pessoa, O. D.; Braz-Filho, R.; Quim. Nova 2011, 34, 284.
7. Miranda, M. A.; Magalhães, L. G.; Tiossi, R. F. J.; Kuehn, C. C.; Oliveira, L. G. R.; Rodrigues, V.; McChesney, J. D.; Bastos, J. K.; Parasitology Research2012, 111, 262.
8. Miranda, M. A.; Tiossi, R. F. J.; Silva, M. R.; Rodrigues, K. C.; Kuehn, C. C.; Oliveira, L. G. R.; Albuquerque, S.; McChesney, J. D.; Lezama-Davila; Isaac-Marquezc, A. P.; Bastos, J. K.; Chemistry & Biodiversity (2012), doi:10.1002/cbdv.201200063.
9. Bagalwa, J. J.; Voutquenne-Nazabadioko, L.; Sayagh, C.; Bashwira, A. S.; Fitoterapia2010, 81, 767.
10. Chataing, B.; Buitrago, C. N.; Concepcion, J. L.; Usubilaga, A.; Rev. Fac. Farm. ULA1996,32, 15.
11. Tavares, D. C.; Munari, C. C.; Araújo, M. G. F.; Correa, M. B.; Furtado, M. A.; Gonçalves, C. C.; Tiossi, R. F. J.; Bastos, J. K.; Cunha, W. R.; Veneziani, R. C. S.; Planta Med. 2011, 77, 1489.
12. Cham, B. E.; Res. J. Biol. Sci.2007, 2, 503.
13. Wu, C. H.; Liang, C. H.; Shiu, L. Y.; Chang, L. C.; Lin, T. S.; Lan, C. C. E.; Tsai, J. C; Wong, T. W.; Wei, K. J.; Lin, T. K.; Chang, N. S.; Sheu, H. M.; J. Dermatol. Sci. 2011, 63, 83.
14. Ding, X.; Zhu, F. S.; Li, M.; Gao, S. G.; J. Ethnopharmacol. 2012, 139, 599.
15. Nakamura, S.; Hongo, M.; Sugimoto, S.; Matsuda, H.; Yoshikawa, M.; Phytochemistry2008,69, 1565.
16. Gottlieb, O. R.; Borin, M. R. M. B.; Pagotto, C. L. A. C.; Zocher, D. H. T.; Ciênc. saúde coletiva1998, 3, 97.
17. De Paula, D.; Martins, C. A.; Bentley, M. V. L. B.; Biomed. Chromatogr.
2008, 22, 1416.
18. Zatz, J. L. Em Skin Permeation – Fundamentals and application; Zatz, J. L., ed.; Allured Publishing Corporation: Wheaton, 1993, chap. 1. 19. Lopes, L. B.; Bentley, M. V. L. B.;Braz. J. Pharm. Sci. 2005,41, 477.
20. Vicentini, F. T. M. C.; Georgetti S. R.; Bentley, M. V. L. B.; Fonseca M. J. V.;Braz. J. Pharm. Sci. 2009,45, 357.
21. Casagrande, R.; Baracat, M. M.; Georgetti, S. R.; Verri Jr., W. A.; Vi-centini, F. T. M. C.; Rafael, J. A.; Jabor, J. R.; Fonseca, M. J. V.; Quim. Nova2009, 32, 1939.
22. Sousa, J. P. B.; Brancalion, A. P. S.; Souza, A. B.; Turatti, I. C. C.; Ambrósio, S. R.; Furtado, N. A. J. C.; Lopes, N. P.; Bastos, J. K.; J. Pharm. Biomed. Anal.2011, 54, 653.
23. Lopes, L. B.; Lopes, J. L. C.; Oliveira, D. C. R.; Thomazini, J. A.; Gar-cia, M. T. J.; Fantini, M. C. A.; Collett, J. H.; Bentley, M. V. L. B.; Eur. J. Pharm. Biopharm. 2006, 63, 146.
24. Brasil, ANVISA; Resolution No 899: Guide for validation of analytical
and bioanalytical methods, Agência Nacional de Vigilância Sanitária, 2010.
25. USA, F.D.A.; Guidance for Industry: Bioanalytical Method Validation, US Department of Health and Human Services, Food and Drug Admin-istration, 2001.
26. Ribani, M.; Grespan, C. B.; Bottoli, C. B. G.; Collins, C. H.; Jardim, I. C. S. F.; Melo L. F. C.; Quim. Nova2004, 27, 771.
27. Collins, C. H. Em Fundamentos de cromatografia; Collins, C. H.; Braga, G. L.; Bonato, P. S., eds.; Editora da Unicamp: Campinas, 2006, cap. 1. 28. Ribani, M.; Collins, C. H.; Bottoli, C. B. G.; J. Chromatogr., A2007,
1156, 201.