1288 Brazilian Journal of Physics, vol. 37, no. 4, December, 2007
Study of the Ferrofluid Drying Process for Morphological
and Nanostructutal Characterization
L. F. Gamarraa,b,∗, G. E. S. Britob, W. M. Pontuschkab, J. B. Mamanib, C. A. Moreira-Filhoa, and E. Amaro Jr.a,c
a Instituto de Ensino e Pesquisa, Hospital Israelita Albert Einstein, S ˜ao Paulo 05651-901, Brazil b Instituto de F´ısica, Universidade de S˜ao Paulo, S˜ao Paulo, Brazil and
cFaculdade de Medicina, Universidade de S ˜ao Paulo, S˜ao Paulo, Brazil
Received on 2 October, 2007
A drying method suitable for the study of the morphological and structural properties of colloidal magnetic systems, including a contrast agent used in Magnetic Resonance Imaging (MRI) is described. We tested three
alternative ferrofluid drying methods: drying at 70◦C in nitrogen atmosphere; drying in air at 70◦C; and drying
by liophylization using an MRI marker in the form of a colloidal suspension (EndoremT M- Guebert). X-ray
diffraction (XRD), and transmission electron microscopy (TEM) were applied to each characterization method.
The XRD allowed the observation of the possible physical-chemical changes of the stabilizers and alsoFe3O4
present in the system. The morphology and nanoparticles size distribution was analyzed by TEM. Among the drying methods examined in this study, the liophylization has shown to be the more adequate one for the
nanoparticles (Fe3O4) morphological study and nanostructural characterization, because the structure of the
nanoparticles was maintained the same as in the suspension. The drying procedures performed at 70 ◦C in
the atmospheres of nitrogen and air let to the coalescence and growth of the nanoparticles, as well as some degradation has been noticed in some of the stabilizers.
Keywords: Lyophilization; Ferrofluid; Endorem; Magnetic nanoparticles
I. INTRODUCTION
Magnetic fluids or ferrofluids are concentrated and sta-ble colloidal suspensions usually composed of a dispersed phase of iron oxide magnetic nanoparticles such as the fer-rites. These nanoparticles usually consist of magnetic single-domain phases which are dispersed into an organic (alcohols and alkil-benzene) or inorganic (water) liquid phase. The fer-rofluid has the fluidity of a homogeneous solution of high magnetic susceptibility [1–4].
A ferrofluid is said to be biocompatible when it is stable in physiological conditions, it has a neutral pH and 0.9 % of salinity [5, 6]. This is achieved by covering the nanoparticles by a biocompatible molecular layer in order to prevent the for-mation of large clusters, modifications in the original structure and biodegeneration, when exposed to the biological systems [7, 8].
The magnetic nanoparticles are an alternative class of con-trast agents for magnetic resonance imaging (MRI) since they modulate proton behavior in different tissues [9–12], allow-ing access to structural information of the livallow-ing organ under study based on a biological distribution of the contrast. In or-der to produce a distinct contrast in the MR images, the main property of an ferrofluid particle is the ability to modify the lo-cal magnetic environment: the magnetic susceptibility effect. The magnetic susceptibility of a solution is associated with the nanoparticle size [13]. However, the techniques used to evaluate the morphology of the nanoparticles are still in devel-opment stage and they present advantages and shortcomings [14].
TEM images of the nanoparticles do not represent their ac-tual arrangement when in suspension since the microstructure may be severely distorted on drying [15].
The objective of the present work is to propose an adequate
drying method for ferrofluids which is necessary for their mor-phological and structural characterization, immediately after synthesis. This information is fundamental to maintain a more efficient control over their physical-chemical properties, venting against the coalescence of the nanoparticles, and pre-serving their morphology and structure without decomposi-tion of additives [13].
We used a commercially available component, EndoremT M
[16] to which we applied three drying methods: at 70oC in
nitrogen and air in atmosphere and by liophylization.
XRD methods were used to find evidence of the proba-ble iron oxide phase and to detect possiproba-ble physical-chemical changes at the stabilizers. The morphological and the nanoparticles distribution analyses were carried out by using TEM and compared to the values provided by the manufac-turer [16].
II. EXPERIMENTAL PROCEDURE
EndoremT M (EndoremT M-Guebert, earlier trade name
AMI-25, Laboratoire Guebert, France [16]) is a biocompat-ible ferrofluid used as an MRI marker. It consisted of a sus-pension of 126.500mgofFe3O4superparamagnetic nanopar-ticles contained in 8ml of water. The nanoparticles of av-erage diameter of 10nm size are coated with low-weight dextran (79kDa) [17] of hydrodynamic diameters between 80−150nm. In addition to water, the solvent composition consisted of 60.800mgof dextran, 2.714mgof citric acid, and 490.400mgofβ-D-mannitol (C6H14O6).
L. F. Gamarra et al. 1289
ambient air atmosphere. The drying by liophylization, also known as freeze drying process, was performed at -5◦C on a 10−3mmHgvacuum chamber.
The crystalline phase and the structure of the nanoparticles of the powders obtained after drying were characterized by XRD at the sweeping interval of 10 at 70◦C (2θ) with steps of 0.05◦for each 10s, using a beam ofCu−Kα(1.5418 ˚A) and Si monochromator. To study the morphology of the nanoparti-cles samples of each dried powder were dispersed over copper grids covered with collodium and carbon [18] and then they were examined in a Leo 906E (Zeiss) TEM at 80Kv.
The size poly-dispersity of the nanoparticles was analyzed from the TEM digitized micrographs using an image analysis software (Java version of Image J v 1.33u [19]). Mean di-ameters were obtained by fitting the experimental data with a lognormal distribution function, as suggested by O’Grady and Bradbury [20],
f(DP) =
1 √
2πωPDP
exp(−(ln DP−ln D 0
P)2
2ω2
P
), (1)
with mean diameter<DP>=D0Pexp(ω2P/2)andωP as the
standard deviation aroundln D2P. The standard deviation of the mean diameterσPis
σP=D0P[exp(2ω2P)−exp(ω2P)]1/2. (2)
III. RESULTS AND DISCUSSIONS
For a better understanding of the physical-chemical behav-ior of the ferrofluid during the drying process, we first applied a XRD analysis of the modifications occurred in the stabiliz-ers. The observation of the presence ofFe3O4, as well as the effect of the air atmosphere and its physical-chemical influ-ence on the structure of the nanoparticles were also evaluated. The alterations in the XRD peaks were observed in each dry-ing method, as shown in Figs. 1, 2 and 3, respectively. It should be mentioned that XRD is not sensitive to quantities smaller than 5 % in volume, which is the case of the citric acid, a substance not detectable by this technique.
The powder diffractogram of the drying at 70◦C in nitro-gen atmosphere (Fig. 1) shows a reduction of the stabiliz-ers. This can be due to the breakdown catalytic effect of the high surface energy of the nanometric particles, which makes it more vulnerable to degradations or phase change. This dry-ing process has also favored all the coalescence mechanisms. XRD showed the presence of the β-D-mannitol phase (or-thorhombic structure), providing evidence of phase change. The data were compared with those of the International Cen-ter for Diffraction Data (ICDD), file #22−1797. The diffrac-togram shows evidence ofFe3O4, peaks of low intensity, as already expected.
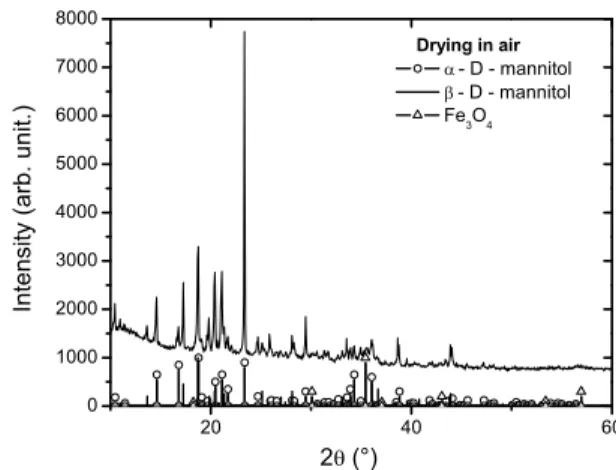
The powder diffractogram of the sample dried at 70◦C in air (Fig. 2) has shown little decomposition of stabilizers, in a situation where all mechanisms leading to the particle coalescence and growth are operating. The XRD analysis
showed evidence of presence of two phases of D-mannitol (α-D-Mannitol andβ-D-mannitol), these data were compared with ICDD files #22−1797 and #22−1793, respectively. We observed traces ofFe3O4, peaks of low intensity, as in similar observations made in the previous drying process.
10 20 30 40 50 60
0 600 1200 1800 2400 3000 3600 4200
Drying in N 2 -D-mannitol Fe 3 O 4
2 (°)
I n t e n sit y ( a r b . u n it . )
FIG. 1: Diffractogram of the powder, dried at 70 ◦C in N
2
at-mosphere, showing evidence ofα-D-mannitol phase, representing
possible reduction of the stabilizers.
20 40 60
0 1000 2000 3000 4000 5000 6000 7000 8000
Drying in air - D - mannitol - D - mannitol Fe 3 O 4 In te n si ty ( a r b . u n it.)
2 (°)
FIG. 2: Diffractogram of the powder dried at 70◦C in air showing
the evidence of both phases of D-mannitol (α-D-mannitol andβ
-D-mannitol).
ob-1290 Brazilian Journal of Physics, vol. 37, no. 4, December, 2007
served as in the previous cases.
20 40 60
0 400 800 1200 1600 2000 2400
Drying for liophylization - D - Manniltol Fe
3 O
4
In
te
n
sity (
a
r
b
. u
n
it.)
2 (°)
FIG. 3: Diffractogram of the powder dried by liophylization.
Ev-idence of the stabilizer preservation and the presence of the β
-D-mannitol peaks are shown.
In all of the three drying methods of this study the weak and broad profiles ofFe3O4could be observed, as expected for nanoparticle powder. Peaks of the stabilizers are seen su-perimposed to these peaks.
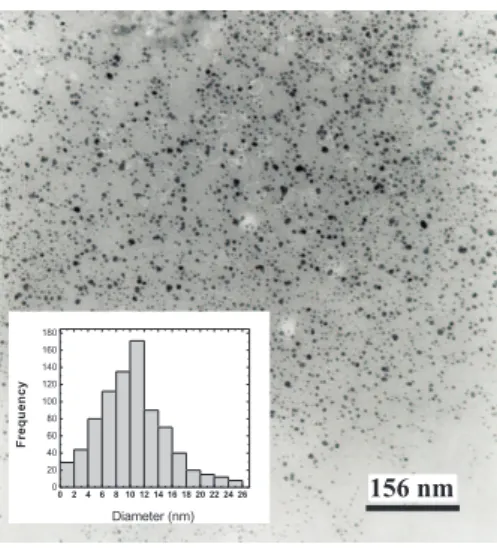
The morphology of the particles and their distribution was analyzed by TEM. Figs. 4 and 5 show the micrographs of the atmospheres of nitrogen and air, respectively. It can be noted that the average diameter of the nanoparticles is about 20nm inN2and 15nmin air. These values are higher than those of 10nmreported in reference [16]. The increased diameters can be explained by the coalescence phenomenon and growth of the nanoparticles, governed by oxolation reaction.
90 nm
FIG. 4: Micrograph of the commercial ferrofluid powder, after
dry-ing at 70◦C in nitrogen atmosphere.
In the micrograph of the lyophilized powder (Fig. 6), the average diameter of the nanoparticles is 10 nm, correspond-ing to the value informed by the manufacturer. The histogram
156 nm
FIG. 5: Micrograph of the commercial ferrofluid powder, after
dry-ing at 70◦C in air.
156 nm
02468 10 12 14 16 18 20 22 24 26
0 20 40 60 80 100 120 140 160 180
F
re
q
u
e
n
c
y
Diameter (nm)
FIG. 6: Micrograph of the commercial ferrofluid powder after dry-ing by liophylization. The inset is a histogram of the distribution of nanoparticles sizes, after lyophilization, obtained by TEM, using the approximation of a log-normal distribution of average diameter
<DP>=10.0nmand standard deviationσP=0.3nm.
shown in the inset of Fig. 6 was obtained from the micro-graph (Fig. 6) using the analysis processing program Im-age J 1.33u [19]. Is shown in the Inset of Fig. 6 the poly dispersity of the nanoparticles size and their distribution, ad-justed to a log-normal distribution [20] with average diameter <DP>=10.0nmand standard deviationσ=0.3nmover a
total number of more than 800 particles. The program could not be applied to Figs. 4 and 5 micrographs because of the lack of representativeness of the particles morphology.
IV. CONCLUSION
L. F. Gamarra et al. 1291
(drying at 70◦C in nitrogen and in air) led to the coalescence and growth of the nanoparticles.
The XRD has provided evidence for the presence of peaks corresponding toβ-D-mannitol stabilizers in the lyophilized sample, with no change of stabilizers phase, in contrast to what was observed in the other drying methods.
Among the three drying methods of this study, the liophyl-ization method has proved to be the more adequate for the colloidal magnetic systems since it preserves the structure and
morphology of the nanoparticles as they are in the suspension form. We have used this drying method in recent investiga-tions [21, 22].
Acknowledgments
This work was supported by Instituto de Ensino e Pesquisa Albert Einstein, CNPq and Instituto do Milˆenio de Fluidos Complexos.
[1] W. Schutt, C. Gruttner, U. Hafeli, M. Zborowski, J. Teller, H.
Putzar, and C. Schumichen, Hybridoma16, 109 (1997).
[2] X. Batlle and A. Labarta, J. Phys. D: Appl. Phys. 35, R15
(2002).
[3] J. Frenkel and J. Dorman, Nature126, 274 (1930).
[4] C. P. Bean and J. D. Livingston, J. Appl. Phys.30, 120 (1959).
[5] Cecilia Albornoz and E. Jacobo Silvia, J. Magn. and Magn.
Mater.305, 12 (2006).
[6] R. Langer, Science249, 1527 (1990).
[7] U. Hafeli, W. Schutt, J. Teller, and M. Zborowski, Scientific and Clinical Applications of Magnetic Carriers. New York, Plenum (1997).
[8] B. Denizot, G. Tanguy, F. Hindre, E. Rump, J. J. Lejeune, and
P. Jallet, Journal Colloid Interface Sci.209, 66 (1999).
[9] T. Bach-Gansmo, Acta Radiol. [Suppl]387, 1 (1993).
[10] P. Reimer and B. Tombach, Eur. Radiol.8, 1198 (1998).
[11] S. Rubnic, A. R. Padhani, P. B. Revell, and J. E. Husband, Am.
J. Roentgenol173, 173 (1999).
[12] Y. X. Ang, S. M. Hussain, and G. P. Krestin, Eur. Radiol.11,
2319 (2001).
[13] C. W. Jung and P. Jacobs, Magn. Reson. Imaging 13, 661
(1995).
[14] Akito Sasaki, The rigaku journal22, 31 (2005).
[15] K. Butter, P. H. H. Bomans, P. M. Frederik, G. J. Vroege, and
A. P. Philipse, Nature Materials2, 88 (2003).
[16] www.guerbt.com.br/portugues/endorem.htm
[17] M. Laniado, A. Chachuat, Vertraglichkeitsprofil von
EN-DOREM, Radiologe35, (Suppl. e), S266 (1995).
[18] B. M. Lacava, R. B. Azevedo, L. P. Silva, Z. G. M. Lacava, K. Skeff Neto, N. Buske, A. F. Bakuzis, and P. C. Morais, Appl.
Phys. Lett.77, 1876 (2000).
[19] W. Rasvand, Image processing and analysis in Java URL http://rsb.info.nig.gov/ij 06-10-2004.
[20] K. O’Grady and A. Bradbury, J. Magn. and Magn. Mater.39,
91 (1983).
[21] L. F. Gamarra, G. E. S. Brito, W. M. Pontuschka, E. Amaro, A.
H. C. Parma, and G. F. Goya, J. Magn. and Magn. Mater.289,
439 (2005).
[22] A. D. Arelaro, A. L. Brandi, E. Lima Jr., L. F. Gamarra, G. E.
S. Brito, W. M. Pontuschka, and G. F. Goya, J. Appl. Phys.97,