Article
J. Braz. Chem. Soc., Vol. 26, No. 1, 14-21, 2015. Printed in Brazil - ©2015 Sociedade Brasileira de Química 0103 - 5053 $6.00+0.00
A
*e-mail: [email protected]
Chemometric Study of Perilla Fatty Acids from Subcritical
n
-Propane Extracted Oil
Claudia M. Silva,a Ana B. Zanqui,a Aloisio H. P. Souza,b Aline K. Gohara,b
Márcia A. Chaves,b Sandra T. M. Gomes,a Lucio Cardozo Filho,c
Nilson E. Souzad and Makoto Matsushita*,a
aDepartment of Chemistry, bCenter of Agricultural Sciences and cDepartment of Chemical
Engineering, State University of Maringá, Av. Colombo, 5790, 87020-900 Maringá-PR, Brazil
dFederal Technological University of Parana, Av. Pioneiros, 3131, 86036-370 Londrina-PR, Brazil
O óleo de perilla (Perilla frutescens) foi extraído utilizando n-propano subcrítico e também pela metodologia oficial de Soxhlet, para efeito de comparação. Objetivou-se avaliar a influência dos fatores temperatura e pressão sobre a composição dos ácidos graxos (FA), através de um fatorial 22 completo em triplicata com ponto central. Ambos os fatores analisados contribuíram
significativamente para o rendimento dos FA extraídos. As superfícies de resposta indicaram que o aumento da pressão e temperatura permitiu maior extração de ácidos graxos omega-3 e poli-insaturados (PUFA), e uma melhor razão entre PUFA e ácido graxos saturados (SFA). Através da função de desejabilidade, a melhor condição de extração com n-propano foi temperatura de 80 °C e pressão de 8 MPa. A análise multivariada distinguiu a condição ótima no grupo de maior
conteúdo de PUFA, com destaque para o ácido alfa-linolênico, enquanto a metodologia de Soxhlet caracterizou-se com elevado teor de SFA.
Oil from perilla (Perilla frutescens) was extracted using subcritical n-propane and also the Soxhlet official methodology, for comparison. This work aimed at assessing the influence of the temperature and pressure factors on the composition of fatty acids (FA), using a full 22 factorial
design in triplicate with central point. Both factors were significant for increasing the yield of extracted FA. The response surfaces showed that increasing pressure and temperature allowed the extraction of higher levels of n-3 and polyunsaturated fatty acids (PUFA) and greater ratio values of PUFA and saturated fatty acids (SFA). According to the desirability function, the best condition of extraction using n-propane was 80 °C for temperature and 8 MPa for pressure. In multivariate
analysis the optimum condition was characterized by a higher content of PUFA, especially alpha-linolenic fatty acid, while the Soxhlet methodology was characterized by high level of SFA.
Keywords: subcritical fluid extraction, fatty acids, Perilla frutescens, response surface methodology, principal component analysis
Introduction
Perilla (Perilla frutescens Linn, Britton) is a herbaceous plant native to Asia that belongs to the family Lamiaceae.1 The grains are approximately 51% total lipids and 17% crude protein.2 Perilla oil has a high content of polyunsaturated fatty acids, with 48-60% alpha-linolenic fatty acid (LNA, 18:3n-3) and 13-16% linoleic acid (LA, 18:2n-6).3 These fatty acids play important roles in metabolic processes. Through desaturase enzymes and elongases, they act in the production of other eicosanoid fatty acids from the omega-3 (n-3) and
omega-6 (n-6) series such as eicosapentaenoic acid (EPA, 20:5n-3), docosahexaenoic (DHA, 22:5n-3) and arachidonic acid (AA, 20:4n-6).4
SFE is characterized by the use of a solvent with intermediate properties between liquid and gas. Fluid characteristics, such as high density, diffusivity and low viscosity, provide it with an excellent solvating capacity. These characteristics may be controlled by the conditions of temperature and pressure, thereby improving the selectivity and solubility of compounds.7,8 Some researchers have investigated the application of experimental design in the optimization of this process. This application allows assessing the influence of factors on the expected response and defines the optimum condition.9-13
Carbon dioxide (CO2) is the most widely used solvent and its extraction time can vary from 330 to 1380 minutes; however studies indicate that n-propane offers greater solvating power, which results in faster extraction in 40-85 min and the oil extracted has the same fatty acid profile when compared to CO2 extraction.5,14-17
The objective of this study was to extract lipids from perilla using n-propane as a solvent in the subcritical state, assess the influence of the factors temperature and pressure on the composition of the fatty acids in the total lipids by chemometric methods, and compare the results obtained to the official Soxhlet method.
Experimental
Sample preparation
Three batches of 5 kg of perilla grains were purchased in the local market of Maringá-PR, Brazil. The grains were ground in a Wiley mill to obtain a fine flour that was sieved, using the fraction that passed through a 14 mesh Tyler series sieve (WSTyler, USA). Later, the sample was homogenized and vacuum packed in polyethylene bags and frozen at –18 °C.
Experimental design
A full 22 factorial design in triplicate with center point was applied to investigate the influence of the factors temperature and pressure in the subcritical extraction on the composition of fatty acids, as shown in Table 1. These factors were chosen in accordance with studies reported in
the literature which have evaluated the extraction of lipids from oilseeds using subcritical n-propane as solvent at constant flow.15-17 The responses analyzed were the yields of saturated fatty acids (SFA), monounsaturated fatty acids (MUFA), polyunsaturated fatty acids (PUFA) and the ratios PUFA/SFA and n-6/n-3.
Procedure for subcritical fluid extraction
The experiments were performed in a laboratory-scale unit, as described by Souza et al.,18 using n-propane (White Martins, 99.5% purity) as solvent. For each extraction the extraction column was filled with 25.0 g of ground and sieved perilla grains. The solvent flow rate was constant at 1.0 cm3 min-1. Total lipids were extracted and collected at regular time intervals of 10 min in a glass tube and the mass was determined gravimetrically. The total time of each extraction was 90 min. The extraction yield was calculated as the percentage of the extracted oil mass divided by the mass of sample introduced into the extraction column.
Extraction of total lipids by the official method
Total lipids were extracted in a Soxhlet extractor (Nova Etica, Brazil). Approximately 4.0 g of ground and sieved perilla grains were extracted in a Soxhlet extractor using a mixture of ethyl ether-petroleum ether (1:1 v/v) as solvent, for 16 h at 65 °C in accordance with the procedure described by Instituto Adolf Lutz.19
Determination of fatty acids
The composition of fatty acids was determined by converting the total lipids into fatty acid methyl esters (FAME) according to the methylation method described by Hartman and Lago.20 The FAME were separated in a CP-3380 gas chromatograph (Varian, USA) fitted with a flame ionization detector following the conditions used by Souza et al..21
Retention times were compared to methyl ester standards (Sigma, USA). The methyl ester of tricosanoic acid was used as an internal standard for quantification of the fatty acids (Sigma, USA). The peak areas were determined with Star 5.0 software (Varian, USA). According to Joseph and Ackman22 (equation 1), correction factors for individual fatty acids (FA) in FAME with a flame ionization detector were used and their concentrations expressed in mg FA g-1 of total lipids.
(1)
Table 1. Factors and levels investigated in the experimental design for subcritical extraction with n-propane
Factor Unit Symbol Type Level
–1 0 1
Temperature °C T Numeric 40 60 80
where Mx is the mass of fatty acid X in mg g-1 of sample; Mp is the internal standard mass in mg; MA is the sample mass in g; AX is the area of fatty acid X; Ap is the internal standard area; FCT is a theoretical correction factor; and FCEA is the methyl ester correction factor for the fatty acid.
Indices of nutritional quality of the lipids
A better approach to the nutritional evaluation of fat is the utilization of indices based on the functional effects of fatty acid composition. These indices are available as the index of atherogenicity (IA) and index of thrombogenicity (IT) by Ulbricht and Southgate,23 as well as the hypocholesterolemic/hypercholesterolemic fatty acid ratio (HH) according to Santos-Silva et al..24
Statistics and multivariate analyses
Initially, the results for individual fatty acids obtained from experimental conditions of subcritical extraction were subjected to analysis of variance (ANOVA). Subsequently, the values of the principal and interaction coefficients were calculated for the factorial design data. All variables had their normality and homogeneity of variance evaluated by residues. Then, analysis of variance (ANOVA between groups) was performed for all responses. Response surface methodology was applied to evaluate the coefficients of independent variables on the responses and establish the optimum region. The basic mathematical model used to fit the data was (equation 2):
Ŷi= b0 + b1x1 + b2x2 + b12x1x2 (2)
where Ŷiis the expected response, b0, b1, b2 and b12 are the regression coefficients of the regression model and x1and
x2 are the levels of the independent variables.25
With the models, the equations were arranged in a global response using a desirability function. The results obtained for the sums of polyunsaturated, monounsaturated and saturated fatty acids were used to estimate the global response. This procedure involved a transformation of each response (Ŷi) estimated for an individual value of
desirability (di), in which 0 ≤di≤ 1, according to Derringer
and Suich.26
If the objective or target T to the response Ŷi is a maximum value, then equation 3 should be used.
(3)
If the objective or target to the response Ŷi is a minimum value, then equation 4 should be used.
(4)
where L and U are minimum and maximum limits, respectively.
The convenience function is linear when the weight r is equal to 1. If r > 1 there is more emphasis on targeting the closest value. Using 0 < r < 1 makes this less important.
Individual values of desirability (di) were arranged through a geometric average to form a global desirability value (D), which will attend to satisfy all response simultaneously. This single value of D [0,1] gives a global assessment of convenience and the arranged response levels, and D will increase at the same time that the properties balance becomes more favorable.
Principal component analysis (PCA) consisted of using the sums and ratios of fatty acids (loadings). For this analysis, the eighteen tests’ averages were separated into groups (scores): A (tests 1 to 3), B (tests 4 to 6), C (tests 7 to 9), D (tests 10 to 12), E (tests 13 to 15), and F (Soxhlet, tests 16 to 18; n = 3). Averages were autoscaled, so that whole variables showed the same weight. In this way, PCA bidimensional graphics were obtained. All the statistical analyses were done using Statistica software version 8.0,27 adopting the 5% significance level for rejection of the null hypothesis (p < 0.05).
Results and Discussion
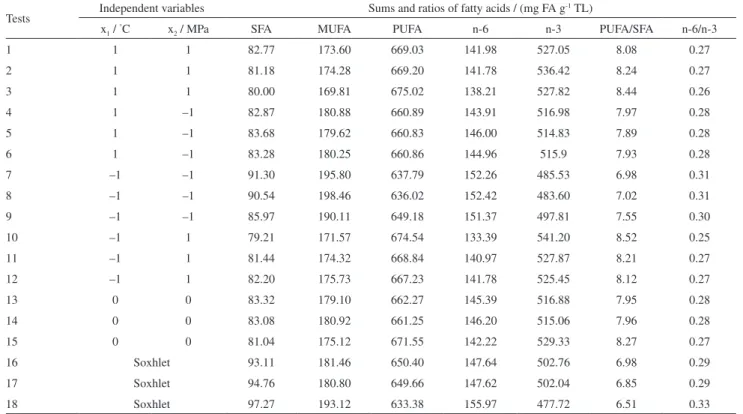
It was possible to quantify a total of six fatty acids, which were palmitic (16:0), stearic (18:0), oleic (18:1 n-9), linoleic (18:2 n-6), alpha-linolenic (18:3 n-3) and arachidic (20:0) acids. These results were similar to those found by other authors.2,28,29 The difference in fatty acid composition may be influenced by edaphoclimatic, genetic and aging factors, conditions of extraction, and others.3 Alpha-linolenic acid was majoritarian in all the experiments, followed by oleic and linoleic acids. The sums and ratios of fatty acids are shown in Table 2.
rate was higher in the first 50 min, and then there was a stabilization of yields.
The total lipid content of perilla by the Soxhlet method was 40.46%; this content may be due to the extraction of other non-lipid compounds that are soluble in the mixture of ethyl ether and petroleum ether used in this extraction.30,31
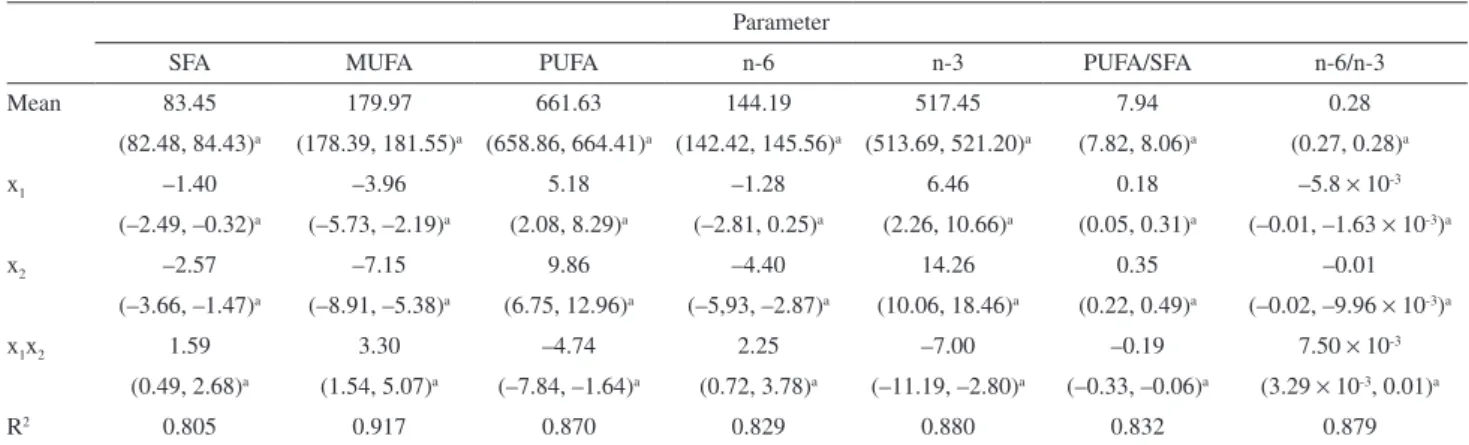
The regression coefficients for each one of the models, their confidence interval and coefficients of determination
(R2) are shown in Table 3. Values of R2 close to 1 indicate a good correlation between experimental and predicted data.32 Pagamunici et al.33 found coefficients of determination of 0.85 for instrumental data vs. sensory analysis as a function of time and the models were well fitted. In this study, the values were greater than 0.80, which means that the linear model explained more than 80% of the data variability. The residual plots for each response showed normality, and homogeneity of variance was explained satisfactorily.
The limits of confidence intervals for the first-order term (x1) in the sum of n-6 fatty acid series showed values with opposite signs (Table 3). All values are possible within a confidence interval, therefore it is possible that this value is zero. This fact demonstrates that there was a linear correlation between the variables, so there is no statistical evidence to keep this term in the model. Nevertheless, its permanence was preferred to preserve the mathematical hierarchy.34
According to Table 3, the interaction coefficients for fatty acids from the n-3 series, PUFA and the PUFA/SFA ratio were negative, however data show that increased levels of principal coefficients contributed to improve the yield of these fatty acids.
Table 2. Quantification of sums and ratios of fatty acids extracted by subcritical fluid and the official method (Soxhlet) from perilla oil
Tests Independent variables Sums and ratios of fatty acids / (mg FA g
-1 TL)
x1 / °C x
2 / MPa SFA MUFA PUFA n-6 n-3 PUFA/SFA n-6/n-3
1 1 1 82.77 173.60 669.03 141.98 527.05 8.08 0.27
2 1 1 81.18 174.28 669.20 141.78 536.42 8.24 0.27
3 1 1 80.00 169.81 675.02 138.21 527.82 8.44 0.26
4 1 –1 82.87 180.88 660.89 143.91 516.98 7.97 0.28
5 1 –1 83.68 179.62 660.83 146.00 514.83 7.89 0.28
6 1 –1 83.28 180.25 660.86 144.96 515.9 7.93 0.28
7 –1 –1 91.30 195.80 637.79 152.26 485.53 6.98 0.31
8 –1 –1 90.54 198.46 636.02 152.42 483.60 7.02 0.31
9 –1 –1 85.97 190.11 649.18 151.37 497.81 7.55 0.30
10 –1 1 79.21 171.57 674.54 133.39 541.20 8.52 0.25
11 –1 1 81.44 174.32 668.84 140.97 527.87 8.21 0.27
12 –1 1 82.20 175.73 667.23 141.78 525.45 8.12 0.27
13 0 0 83.32 179.10 662.27 145.39 516.88 7.95 0.28
14 0 0 83.08 180.92 661.25 146.20 515.06 7.96 0.28
15 0 0 81.04 175.12 671.55 142.22 529.33 8.27 0.27
16 Soxhlet 93.11 181.46 650.40 147.64 502.76 6.98 0.29
17 Soxhlet 94.76 180.80 649.66 147.62 502.04 6.85 0.29
18 Soxhlet 97.27 193.12 633.38 155.97 477.72 6.51 0.33
FA: fatty acids; TL: total lipids; x1: temperature; x2: pressure; SFA: total saturated fatty acids; MUFA: total monounsaturated fatty acids; PUFA: total polyunsaturated fatty acids; n-6: total fatty acids from the omega-6 series; n-3: total fatty acids from the omega-3 series; PUFA/SFA: ratio between polyunsaturated and saturated fatty acids; n-6/n-3: ratio between fatty acids from the omega-6 and omega-3 series.
Tables 4 and 5 showed the results obtained by ANOVA for each factor studied in the model response. The pressure factor influenced the increased levels of n-6 series fatty acids, MUFA and the PUFA/SFA ratio the most, with contributions of 61.65, 60.27 and 53.71%, respectively (Table 4).
The values of F-test (Table 5) demonstrate the significance of regression coefficients and lack of fit. In general, if the calculated F value exceeds the tabulated F value, the term is considered significant at the defined level of confidence.35 The interaction coefficient for the n-6 series fatty acids response was significant statistically, while the main coefficient of
Table 3. Regression coefficient, confidence interval and coefficients of determination of the responses applied to the response surface methodology
Parameter
SFA MUFA PUFA n-6 n-3 PUFA/SFA n-6/n-3
Mean 83.45 179.97 661.63 144.19 517.45 7.94 0.28
(82.48, 84.43)a (178.39, 181.55)a (658.86, 664.41)a (142.42, 145.56)a (513.69, 521.20)a (7.82, 8.06)a (0.27, 0.28)a
x1 –1.40 –3.96 5.18 –1.28 6.46 0.18 –5.8 × 10⁻³
(–2.49, –0.32)a (–5.73, –2.19)a (2.08, 8.29)a (–2.81, 0.25)a (2.26, 10.66)a (0.05, 0.31)a (–0.01, –1.63 × 10-3)a
x2 –2.57 –7.15 9.86 –4.40 14.26 0.35 –0.01
(–3.66, –1.47)a (–8.91, –5.38)a (6.75, 12.96)a (–5,93, –2.87)a (10.06, 18.46)a (0.22, 0.49)a (–0.02, –9.96
× 10-3)a
x1x2 1.59 3.30 –4.74 2.25 –7.00 –0.19 7.50 × 10⁻³
(0.49, 2.68)a (1.54, 5.07)a (–7.84, –1.64)a (0.72, 3.78)a (–11.19, –2.80)a (–0.33, –0.06)a (3.29
× 10-3, 0.01)a
R2 0.805 0.917 0.870 0.829 0.880 0.832 0.879
aConfidence interval of coefficients at 95% confidence; x
1: temperature; x2: pressure; R2: coefficient of determination; SFA: total saturated fatty acids; MUFA:
total monounsaturated fatty acids; PUFA: total polyunsaturated fatty acids; n-6: total fatty acids from the omega-6 series; n-3: total fatty acids from the omega-3 series; PUFA/SFA: ratio between polyunsaturated and saturated fatty acids; n-6/n-3: ratio between fatty acids from the omega-6 and omega-3 series.
Table 4. Results of ANOVA,sum of squares of the responses obtained in full 22 factorial design in triplicate with central point
Source Sum of squares
DF SFA MUFA PUFA n-6 n-3 PUFA/SFA n-6/n-3
x1 1 23.74 188.42 322.71 19.63 501.04 0.38 4.08 × 10-4
x2 1 79.26 613.61 1166.04 232.41 2441.31 1.52 2.41 × 10-3
x1x2 1 30.34 131.27 270.27 60.79 588.00 0.45 6.75 × 10⁻⁴
Residual 11 32.38 84.83 262.29 64.15 480.145 0.48 4.82 × 10⁻⁴
Lack of fit 1 3.59 9.49 43.09 0.64 33.18 0.05 1.50 × 10⁻⁵
Pure error 10 28.78 75.34 219.2 63.51 446.96 0.42 4.67 × 10⁻⁴
Total SS 14 165.72 1018.14 2021.33 376.99 4010.49 2.83 3.97 × 10-2
x1: temperature; x2: pressure; SS: sum of squares; DF: degree of freedom; SFA: total saturated fatty acids; MUFA: total monounsaturated fatty acids; PUFA: total polyunsaturated fatty acids; n-6: total fatty acids from the omega-6 series; n-3: total fatty acids from the omega-3 series; PUFA/SFA: ratio between polyunsaturated and saturated fatty acids; n-6/n-3: ratio between fatty acids from the omega-6 and omega-3 series.
Table 5. Results of ANOVA, F-test and the responses obtained for the full 22 factorial design in triplicate with central point
Source F-test
DF SFA MUFA PUFA n-6 n-3 PUFA/SFA n-6/n-3
x1 1 8.25 25.01 14.72 3.09 11.21 9.06 8.75
x2 1 27.53 81.45 53.19 36.59 54.62 35.75 51.61
x1x2 1 10.54 17.43 12.33 9.57 13.15 10.64 14.46
Lack of fit 1 1.25 1.26 1.97 0.10 0.74 1.23 0.32
Residual 11
Pure error 10 Ftab95%,regression/residual(1,11) = 4.84 Ftab95%,lackoffit/pureerror(1,10) = 4.96
temperature was not significant. The yield of these fatty acids depended on the contribution of the coefficients: pressure (61.65%), interaction (16.13%) and temperature (5.21%), in this order (Table 4), and the greatest result was found at 40 oC and 8 MPa. These effects can be noted in the response surface models (Figure 2). The lack of fit of the models were not significant compared to the pure error.
The extraction by the official Soxhlet method showed a high yield of SFA, while the concentration of n-3 fatty acids was low. This indicates that the heating used during extraction in this method may have contributed to the degradation of the n-3 fatty acids, as these are more prone to hydrolysis, oxidation and polymerization at high temperatures.4
Principal component analysis (PCA, Figure 3) showed the distribution of three distinct groups. Principal component 1 (PC 1) explained 58.29% of data variance, and loadings indicated that n-3 fatty acids, total PUFA and the PUFA/SFA ratio were responsible for the formation of group 1. This was due to higher values of these items in experiments A, B, D and E. These effects can be noted in the response surface models (Figures 2c, d and f).
In PC 2 there was a negative contribution by SFA in the lower left quadrant, causing the separation of group 3 (Figure 3). The high contribution of MUFA to the left upper quadrant promoted the separation of group 2 due
to the greater concentration of this sum in the subcritical condition of 40 °C and 8 MPa (Figure 3, condition C). This principal component was responsible for 11.71% of the data variance.
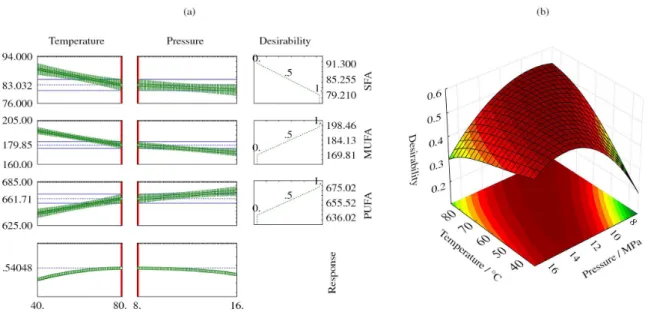
Figure 4a shows the desirability function for the following restrictions: maximum value of total PUFA and MUFA; minimum value of total SFA. The maximum convenience achieved was 0.54 which corresponds to 83.03, 179.85 and 661.71 mg g-1 of total lipids for SFA, MUFA e PUFA, respectively (Figure 4b). The highest level of temperature and low level of pressure were described as a point of major desirability (condition B) in favor of the process of extraction by subcritical fluids using n-propane. This result corroborates the separation of condition B in the group with the highest content of PUFA fatty acids, especially alpha-linolenic acid, by PC 1 (Figure 3). Figure 4b provides the response surface for the optimal region. The optimal extraction conditions of perilla oil (Figure 4) allowed us to obtain atherogenicity and thrombogenicity indexes equal to 0.08 and 0.05, respectively, and the HH ratio was 13.32. On the other hand, the official method presented IA: 0.08, IT: 0.06 and HH: 11.89, and did not compromise the quality of the oil. These indexes and ratios are important from a nutritional standpoint; in addition, lower IA and IT with higher HH values may attenuate the risk of cardiovascular diseases.23,24,36 The incorporation of perilla oil in food processing seems to be promising, just like the use of flaxseed oil.21,33,37-39
Conclusions
The factorial design showed that the temperature and pressure factors were significant for the yield of fatty acids. All regression models were highly significant and the lack of fit was not significant. The response surfaces indicated that increased pressure and temperature allowed more n-3
Figure 2. Response surfaces for the sums and ratios of fatty acids extracted by subcritical fluid extraction. (a) SFA: total saturated fatty acids; (b) MUFA: total monounsaturated fatty acids; (c) PUFA: total polyunsaturated fatty acids; (d) total fatty acids from the omega-3 series; (e) total fatty acids from the omega-6 series; (f) ratio between polyunsaturated and saturated fatty acids; (g) ratio between fatty acids from the omega-6 and omega-3 series.
fatty acids and PUFA to be extracted and a better PUFA/ SFA ratio to be obtained. The main effect of the temperature was not significant for n-6 and this was due to the high significance of the interaction effect. PC 1 distinguished the conditions A, B, D and E due to the high contribution by the loadings: n-3 fatty acids, PUFA and PUFA/SFA. The desirability function that allowed us to determine the best conditions of lipid extraction with subcritical n-propane were 80 °C and 8 MPa. Multivariate analysis characterized this extraction condition in the group with the highest content of PUFA, especially alpha-linolenic fatty acid.
Acknowledgments
To Capes, CNPq, Araucária Foundation for financial support and for the scholarship offered. To the State University of Maringá for making the resources and technology available to support the development of this research.
References
1. Nitta, M.; Lee, J. K.; Ohnishi, O.; Econ. Bot. 2003, 57, 245. 2. Longvah, T.; Deosthale, Y. G.; J. Am. Oil Chem. Soc. 1991, 68,
781.
3. Lee, D. S.; Noh, B. S.; Bae, S. Y.; Kim, K.; Anal. Chim. Acta. 1998,358, 163.
4. Martin, C. A.; Almeida, V. V.; Ruiz, M. R.; Visentainer, J. E. L.; Matsushita, M.; Souza, N. E.; Visentainer, J. V.; Rev. Nutr. 2006,
19, 761.
5. Reverchon, E.; de Marco, I.; J. Supercrit. Fluids. 2006, 38, 146. 6. Lang, Q.; Wai, C. M.; Talanta2001,53, 771.
7. Temelli, F.; J. Supercrit. Fluids2009, 47, 583.
8. Passos, C. P.; Silva, R. M.; Silva, F. S.; Coimbra, M. A.; Chem. Eng. J.2010, 160, 634.
9. Follegati-Romero, L. A.; Piantino, C. R.; Grimaldi, R.; Cabral, F. A.; J. Supercrit. Fluids2009, 49, 323.
10. Nyam, K. L.; Tan, C. P.; Lai, O. M.; Long, K.; Che Man, Y. B.;
Food Bioprod. Process2010, 88, 239.
11. Leitão, N. C. M. C. S.; Prado, G. H. C.; Veggi, P. C.; Meireles, M. A. A.; Pereira, C. G.; J. Supercrit. Fluids2013, 78, 114. 12. Santos, O. V.; Correa, N. C. F.; Carvalho Jr., R. N.; Costa,
C. G. F.; Lannes, S. C. S.; J. Food Eng.2013, 117, 499. 13. Ruttarattanamongkol, K.; Siebenhandl-Ehn, S.; Schreiner, M.;
Petrasch, A. M.; Ind. Crops Prod. 2014, 58, 68.
14. Garcia, V. A. S.; Silva, C.; Filho, L. C.; Acta Sci., Technol. 2013,
35, 499.
15. Corso, M. P.; Fagundes-Klen, M. R.; Silva, E. A.; Filho, C. L.; Santos, J. N.; Freitas, L. S.; Dariva, C.; J. Supercrit. Fluids 2010,
52, 56.
16. Nimet, G.; da Silva, E. A.; Palu, F.; Dariva, C.; Freitas, L. S.; Neto, A. M.; Filho, L. C.; Chem. Eng. J. 2011, 168, 262. 17. Pederssetti, M. M.; Palu, F.; da Silva, E. A.; Rohling, J. H.;
Cardozo-Filho, L.; Dariva, C.; J. Food Eng. 2011, 102, 189. 18. Souza, A. T.; Benazzi, T. L.; Grings, M. B.; Cabral, V.; da Silva,
E. A.; Cardozo-Filho, L.; Antunes, O. A. C.; J. Supercrit. Fluids 2008,47, 182.
19. Instituto Adolfo Lutz; Métodos Químicos e Físicos para Análise de Alimentos, 5a ed.; Imesp: São Paulo, 2005.
20. Hartman, L.; Lago, R. C. A.; Lab. Pract. 1973, 22, 475. 21. Souza, A. H. P.; Gohara, A. K.; Rodrigues, A. C.; Souza, N. E.;
Visentainer, J. V.; Matsushita, M.; Acta Sci., Technol. 2013, 35, 757. 22. Joseph, J. D.; Ackman, R.; J. Am. Oil Chem. Soc. 1992, 75, 488. 23. Ulbricht, T. L. V.; Southgate, D. A. T.; Lancet1991, 338, 985.
24. Santos-Silva, J.; Bessa, R. J. B.; Santos-Silva, F.; Livest. Prod. Sci. 2002, 77, 187.
25. Granato, D.; Bigaski, J.; Castro, I. A.; Masson, M. L.; Food Chem. 2010, 121, 899.
26. Derringer, G.; Suich, R.; J. Qual. Technol. 1980, 12, 214. 27. StatSoft, Inc.; Statistica: Data Analysis Software System, version
8.0; StatSoft: Tulsa, 2007.
28. Kim, H. K.; Choi, H.; Life Sci.2005, 77, 1293.
29. Kim, J. K.; Park, S. Y.; Na, J. K.; Seong, E. O.; Yu, C. Y.; J. Agric. Food Chem. 2012, 60, 2257.
30. Su, C. H.; Fu, C. C.; Chang, Y. C.; Nair, G. R.; Ye, J. L.; Chu, I. M.; Wu, W. T.; Biotechnol. Bioeng. 2008, 99, 1034. 31. Brum, A. A. S.; Arruda, L. F.; Regitano-d’Arce, M. A. B.; Quim.
Nova 2009, 32, 849.
32. Pujari, V.; Chandra, T. S.; Process Biochem. 2000, 36, 31. 33. Pagamunici, L. M.; Souza, A. H. P.; Gohara, A. K.; Silvestre,
A. A. F.; Visentainer, J. V.; Souza, N. E.; Gomes, S. T. M.; Matsushita, M.; Cienc. Tecnol. Aliment. 2014, 34, 127.
34. Neto, B. B.; Scarminio, I. S.; Bruns, R. E.; Como Fazer Experimentos: Pesquisa e Desenvolvimento na Ciência e
Indústria, 2a ed.; Editora da Unicamp: Campinas, 2001. 35. Teófilo, R. F.; Ferreira, M. M. C.; Quim. Nova 2006, 29, 338. 36. Ratnayake, W. M.; Galli, C.; Ann. Nutr. Metab. 2009, 55, 8. 37. Pagamunici, L. M.; Gohara, A. K.; Souza, A. H. P.; Bittencourt,
P. R. S.; Torquato, A. S.; Batiston, W. P.; Gomes, S. T. M.; Souza, N. E.; Visentainer, J. V.; Matsushita, M.; J. Braz. Chem. Soc. 2014, 25, 219.
38. Souza, A. H. P.; Gohara, A. K.; Pagamunici, L. M.; Visentainer, J. V.; Souza, N. E.; Matsushita, M.; Acta Sci., Technol. 2014,
36, 157.
39. Fuchs, R. H. B.; Ribeiro, R. P.; Matsushita, M.; Tanamati, A. A. C.; Bona, E.; Souza, A. H. P.; LWT--Food Sci. Technol. 2013, 54, 440.
Submitted: July 11, 2014