Statistical and Wavelet Analysis of the Solar Wind Data
Maur´ıcio Jos´e Alves Bolzan
Laborat´orio de F´ısica Atmosf´erica e Solar, Instituto de Pesquisa e Desenvolvimento, Universidade do Vale do Para´ıba, UNIVAP Received on 11 March, 2004. Revised version received on 15 October, 2004
We perform statistical and wavelet analysis of three time series based on the solar wind velocity of the year 2000, the original time series and two filtered components. We use the Haar Wavelet Transform to separate this annual time-series into two parts, corresponding to high and low frequencies. We then calculate the kurtosis and skewness parameters for the three time-series. The results show that these parameters present high values in the low-pass filtered time-series, indicating that the intermittence level is superior at large scales (low-frequencies) if compared with the small scales of the turbulence. It is possible to conjecture that the Coherent Structures are responsible for this behavior. The use of the Morlet Wavelet Transform is presented to understand this behavior in terms of the gradient and nonlinear interaction of energy between scales.
I. INTRODUCTION
The study of geomagnetic indices, solar wind velocity and proton density in solar-terrestrial relations and magne-tospheric physics is very important due to several activities on Earth, as data transmission by satellite, working of power lines, and many others. Thus, the study of the statistical prop-erties of geomagnetic indices and their relations to the solar wind has attracted a growing interest [1,2]. According to Hnat [3], statistical properties of velocity field fluctuations recorded in wind tunnels or obtained from solar wind observations ex-hibit striking similarities. The common feature in these fluc-tuations is the statistical intermittence. The intermittence phe-nomena opened up an interesting research area. Kinney and collaborators [4], investigating the phenomenology of magne-tohydrodynamic turbulence through of direct numerical simu-lations, have established the existence of Coherent Structures (CS) called coherent magnetic vortices. These vortices control the turbulent cascade of indirect current sheets generated dur-ing close encounters between the vortices. Furthermore, the energy spectra have a time dependence at early times, which is associated with coalescence events of the CS. Hussain [5] de-fined the CS in turbulent variables (velocity, temperature, den-sity and others) that have high self-correlation or other vari-ables in the determined time scale. The structures are strongly associated with energy dissipation of the turbulent flows and also a source of instability at least in some scales. In this work, we will use the statistical analysis to study the intermit-tence and the CS that are present in experimental data. We will calculate the skewness, which is a less explored parame-ter in magnetohydrodynamics turbulence, and the kurtosis for high-pass and low-pass filtered time series of the solar wind velocity. In order to filter the time series, we will use the Haar Wavelet Transform to decompose it in all possible frequen-cies. Furthermore, we will apply the Morlet Wavelet Trans-form and Global Wavelet Spectrum in order to understand the behavior of energy between large and small scales.
This paper is organized as follows. Section two is devoted to the theoretical background of statistical and wavelet analy-sis. Section three is concerned with the measurements and the experimental site. In the fourth Section, we present some re-sults and discuss their consequences. Finally, in last Section, we present some conclusions.
II. THEORETICAL BACKGROUND
A. Statistical Analysis
Due to the difficulties to study turbulence in computer sim-ulations, statistical analyses as the Probability Density Func-tions (PDF) are useful tools to understand the phenomena that occur in any turbulent system, involving hydrodynamic [6,7] or magnetohydrodynamic [8,9] flows. Two statistical para-meters that have been used to accomplish this objective, the skewness and kurtosis parameters.
According to Frisch [10], the kurtosis is a measure of inter-mittence in flows and is the parameter that controls the shape of PDF. This parameter is calculated from the relation
Kr=
<v4r > <v2
r >2
, (1)
whereris the increment scale andvr(x) =v(x+r)−v(x). The skewness parameter was used to investigate the trans-port asymmetry in hydrodynamics turbulence, specifically in Convective Boundary Layer (CBL) in atmosphere [11]. In recent years, there are many works demonstrating the impor-tance of the study of the skewness parameter in magnetohy-drodynamics turbulence data obtained in laboratory [12] and experimental sites [13].
B. Wavelet Analysis
The Fast Fourier Transform (FFT) is a useful tool to study the power spectrum of stationary time series. A distribution of spectral density identifies the energy associated with the frequencies, but does not give any information about temporal localization in the time series. In other words, FFT is a global transform. For a signalx(t), the Fourier transform is given by
X(f) =
Z ∞
−∞x(t)e
−2jπf t
dt. (2)
form of small waves created by dilations,Ψ(t) =Ψ(2t), and translations,Ψ(t) =Ψ(t+1), from of simple generator func-tion,Ψ(t), which is called mother-wavelet. Mathematically, the wavelet function with a scaleaand at positionbis given by
Ψa,b(t) =a−1/2Ψ µ
t−b a
, (3)
wherea andbare real anda>0. The Wavelet transform is defined by
(WΨf)(a,b) = 1
a1/2
Z
f(t)Ψ µ
t−b a
dt, (4)
where the temporal function f(t)is any time series.
Exist two types of wavelet functions, the continuous and discrete wavelets. The most famous discrete wavelet families are, Haar wavelet [15], Meyer and Daubechies [16], while the most famous wavelet families are, Morlet [17] and the mexican-hat [18].
In this work, we used the two types of wavelet function, the Morlet wavelet applied to a time series for investigating the dominant period, and the Haar wavelet, for filtering the time series into two parts, one part with high frequencies only, and another one with low frequencies only.
III. DATA
In this work we used data of solar wind from SOHO satellite obtained in the public internet address htt p :
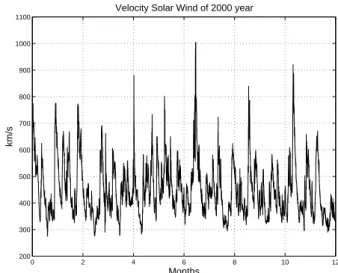
//umto f.umd.edu/pm/crn/[19]. Data were obtained during the year 2000, with a sampling rate of one measurement by hour (approximately 2.78×10⁻⁴Hz). This paper deals with the analyses of the solar wind records in this year. Graphs in Fig. 1 show the data set for 12 months of this year.
The curve represents a characteristic scenario in the evolu-tion of the solar wind, notably the rapid change of the magni-tude of solar wind velocity in July, where the increase in mag-nitude is associated with the very strong solar disturbance that occurred in this year. Kov´acs [1] illustrated that if one disre-gards the real reason for the evolution of the geomagnetic dis-turbances (storms, or substorms), the fluctuating nature of the field can be interpreted in the present context as the manifesta-tion of turbulent phenomena that take place within the plasma of the magnetosphere. It has long been accepted that turbu-lence evolves through cascade processes that involve a hier-archy of coherent vortex structures belonging to a wide range of spatial scales. Kolmogorov [20] proposed the inhomoge-neous flow down (cascade) of the energy from system-size scales to dissipative (Kolmogorov) ones. The inhomogene-ity involves the singular behavior of the energy distribution in physical space resulting in strong gradients, or intermittence in the time-series of the energy related to physical quantities of the system, e.g. velocity [21], temperature [7] or magnetic fields [1,2]. Thus, we used the approach of this Kolmogorov-ian scenario to study this data.
0 2 4 6 8 10 12
200 300 400 500 600 700 800 900 1000 1100
km/s
Months
Velocity Solar Wind of 2000 year
FIG. 1: Solar wind velocity time-series obtained by SOHO satellite at year 2000.
0 1 2 3 4 5 6 7 8 9 10
200 400 600 800 1000 1200
km/s
Original Signal, Solar Wind, 2000 year
0 1 2 3 4 5 6 7 8 9 10
−400 −200 0 200 400
km/s
High Frequencies
0 1 2 3 4 5 6 7 8 9 10
200 400 600 800 1000 1200
km/s
Low Frequencies
Months
FIG. 2: Decomposition of time-series of solar wind in two parts through of the Haar wavelet transform.
IV. RESULTS AND DISCUSSIONS
In order to perform a more detailed investigation of inter-mittence and coherent structures we decompose the time se-ries into two parts. The first time sese-ries presents high frequen-cies only. The other time series presents low frequenfrequen-cies only. For this purpose, we used the Haar Wavelet Transform, with a cut-off frequency of 2.17×10⁻⁶Hz. This frequency choice was obtained from the visual aspect of all of the frequencies that are present in the time series. Fig. 2 shows the results of this decomposition.
100 101 102 103 104 100
101 102
Kurtosis
Scale (r) Solar Wind, 2000 year
Original High Frequencies Low Frequencies
FIG. 3: Kurtosis parameter calculated in 30 increment scales to three time-series, velocity solar wind, high-pass filtered velocity so-lar wind and low-pass filtered velocity soso-lar wind.
[10], the kurtosis is a measure of intermittence in flows. Large values of the kurtosis has also been observed in strongly non-Gaussian Probability Density Functions (PDFs)[3,4,6,7,8,9]. In Fig. 3, we observe that the intermittence level grows with decreasing values of ther increments for the three time se-ries. Forr→0, the values of kurtosis parameter grow expo-nentially, reaching maximum values in the low-pass filtered time series. Furthermore, we observe that the three time series are self-similar [9] at large scales, i.e., the kurtosis parameter shows constant values for determinedrintervals. The results for low-pass filtered time series are in contrast with results ob-tained by Ramos [23] for data referring to the Amazon forest. In this work, the high-pass filtered data showed an increase of the kurtosis parameter, exposing the intermittent character of high frequencies. In the present work, this result shows that the intermittence and coherent structures are present in the large scales of the time-series, contrary to the results of Ramos [23]. However, it is important to note that the actual re-sults and the rere-sults obtained by Ramos [23] are different from the point of the used data, since the data of Ramos [23] were obtained in a situation of hydrodynamic turbulence while the data used in this work were obtained under magnetohydrody-namic turbulence. Also, according to Biskamp and Schwarz [24], although both kinds of turbulent flows have similar cas-cade properties, they do not always display the same statistical behavior.
According to the behavior studied above, it would be pos-sible to conjecture that the differences between both time se-ries can be directly associated with the large number of solar storms in 2000. Thus, with the purpose of analyzing this dif-ference between both filtered time series, we applied the Mor-let WaveMor-let Transform for constructing a periodogram. The periodogram is a tridimensional graph in which the x-axis de-notes the current time of duration of the time series, and the
y-axis denotes the frequencies or periods in the time series; the gray scale bar represents the third dimension of the pe-riodogram, and denotes the energy associated with each fre-quency or period. In Fig. 4a, we show the periodogram ob-tained for a high-pass filtered time series, and in Fig. 4b we show the periodogram obtained for a low-pass filtered time series. Figs. 4c and d show the Global Wavelet Spectrum (GWS) [25] for each time series. From the analysis of the periodograms, we note that the high-pass filtered time-series, Fig. 4a, presents more defined and compact structures than the low-pass filtered time-series, Fig. 4b. This behavior can be interpreted according with to the Heisenberg uncertainty principle, i.e., in the high-frequency region we observe that the structures concentrate in a small time interval (x-axis) but are dispersed in terms of periods (y-axis). This behavior is the opposite of Fig. 4b, in which we observe that structures are dispersed at large time intervals, but are concentrated in a few period intervals. Thus, we write the Heisenberg principle as ∆t∆P∼constant, where∆t is the time interval (x-axis) and ∆Pis the period interval (y-axis). The constant in this relation can be associated with the energy of each structure. This re-sults has important physical features. At high frequencies, the structures associated with intermittent events try to dissipate energy at all possible frequencies, according of Kolmogorov’s cascade. It should be pointed out that this conclusion is just a new form of definition of intermittence.
Analyzing the energy of both time-series through of GWS, Figs. 4c and 4d, we note that the energy of the high-pass filtered time series has a small contribution to the time series as compared with the low-pass filtered time series, Fig. 4d. These results show that the energy from large scales can be useful for the creation of the coherent structures at large scales (low frequencies). The larger values of the kurtosis parameter at the large scales may be an indication of the intermittence phenomena caused by the CS.
In order to study the CS, we used the skewness parameter. The histogram of solar wind velocity presents a strong skew-ness [26], centered at 400kms−1, as shown in Fig. 5. This fact
Period (months)
Months Solar Wind, year 2000
0 2 4 6 8 10 12
0.002 0.003 0.006 0.012 0.023 0.047 0.094 0.19 0.36 0.75 1.5 3
0 5 10
x 105 Power (km/s)2 Global Wavelet Spectrum
Period (months)
0 2 4 6 8 10 12
0.002 0.003 0.006 0.012 0.023 0.047 0.094 0.19 0.36 0.75 1.5 3
0 1 2 3 4 5 6
0 5 10
x 105 Power (km/s)2
(a)
(b)
(c)
(d)
FIG. 4: a) Periodogram of Morlet Wavelet Transform applied to time-series of solar wind of the year 2000 high-pass filtered; b) Periodogram for time-series low-pass filtered; c) Global Wavelet Spectrum for time-series high-pass filtered and; d) Global Wavelet Spectrum for time-series low-pass filtered.
200 300 400 500 600 700 800 900 1000 1100
0 200 400 600 800 1000 1200
Velocity Wind (km s−1)
Velocity Wind, 2000 year
FIG. 5: Histogram of velocity solar wind, year 2000.
V. CONCLUSIONS
In this work, we used the annual time series of the solar wind velocity, measured by the SOHO satellite in the year 2000, in order to study the presence of Coherent Structures and intermittence phenomena. We used the Haar Wavelet Transform to separate this annual time series of the solar wind velocity into two parts, one part of high frequencies and an-other one of low frequencies. We then used a statistical analy-sis for calculating the kurtoanaly-sis and skewness parameters.
Results for the kurtosis have shown larger values in the low-pass filtered time-series as compared with other time-series with therinterval between 100and 102, showing the higher level of the intermittence in the large scales of the flow. This result shows that the intermittence level is higher at the large scales as compared with the small scales of the turbulence. It is possible to conjecture that the source of this intermittence are the Coherent Structures at the large scales.
100 101 102 103 104 −0.5
0 0.5 1 1.5 2 2.5 3 3.5 4
Skewness
Scale (r) Solar Wind, 2000 year
Original High Frequencies Low Frequencies
FIG. 6: Kurtosis parameter calculated in 30 increment scales to three time-series, velocity solar wind, high-pass filtered velocity so-lar wind and low-pass filtered velocity soso-lar wind.
low-pass filtered time-series showed strong energy at the large scales.
These results lead to the following physical conjecture. The high energy at the large scales of the magnetohydrodynamics turbulence, due the high solar activity in 2000, contributes to creation of Coherent Structures in the time series. Further-more, based on the results for the kurtosis and skewness analy-ses, we conclude that the solar wind velocity presents a space gradient along the distance between the Sun and the Earth, and that this gradient can be associated with the solar activ-ity. These conclusions are consistent with the results from statistical and wavelet analysis for hydrodynamics turbulence performed by Katul [27].
Acknowledgements
We thank the referees for fruitful comments and sugges-tions.
[1] P. Kov´acs, V. Carbone, and Z. Voros. Planetary and Space Sci-ence,49, 1219 (2001).
[2] A. T. Y. Lui. Journal of Atmospheric and Solar-Terrestrial Physics,64, 125 (2002).
[3] B. Hnat, S. C. Chapman, and G. Rowlands. Intermitency, scal-ing and the Fokker-Planck approach to fluctuations of the solar wind bulk plasma parameters as seen by wind. Phys. Rev. E,67, 5 (2003).
[4] R. Kinney and J. C. McWilliams, Physic of Plasmas,210, 3623 (1995).
[5] A. K. M. F. Hussain. Physics of Fluids,26, 10, 303 (1983). [6] F. M. Ramos, R. R. Rosa, C. Rodrigues Neto, M. J. A. Bolzan,
and L. D. A. S´a . Physica A,295, 250 (2001).
[7] M. J. A. Bolzan, F. M. Ramos, L. D. A. S´a, C. Rodrigues Neto, C.; R. R. Rosa. Journal of Geophysical Research, 107, D20, 30-1-30-7 (2002).
[8] L. F. Burlaga, A. F.-Vi˜nas. Geophysical Research Letters,
31L16807, doi:10.1029/2004GL020715 (2004).
[9] M. J. A. Bolzan, Y. Sahai, P. R. Fagundes, R. R. Rosa, F. M. Ramos, and J. R. Abalde. Journal of Atmospheric Solar-Terrestrial Physics, (2005) in press.
[10] U. Frisch. Turbulence, Cambridge University Press, Cam-bridge, (1995), 296 pp.
[11] J. C. Wyngaard and J. C. Weil. Physics of Fluids A,3(1), 155 (1991).
[12] N. V. Antonov, J. Honkonen, A. Mazzino, and P. Muratore-Ginanneschi, Phys. Rev. E,62, 5 R5891-R5894, (2000). [13] L. F. Burlaga, A. Forman, Miriam, Journal of Geophysical
Re-search (Space Physics),107A11, SSH 18-1, (2002).
[14] Y. Meyer,Ondelettes - Ondelettes et op´erateurs. I. Hermann, Paris, (1990), 215 p.
[15] W. Gao and B. L. Li, Journal of Applied Meteorology,3211, 1717 (1993).
[16] I. Daubechies. Ten lectures on wavelets, SIAM, (1992), p. 278-285.
[17] H. Y. Weng, K. M. Lau, Journal of the Atmospheric Sciences,
5117, 2523 (1994)
[18] M. Farge, N. Kevlahan, V. Perrier, and E. Goirand. Wavelets and turbulence.Proceedings of the IEEE,844, 639 (1996). [19] MTOF/PM Data by Carrington Rotation.
http://umtof.umd.edu/pm/crn/, (2004).
[20] A. N. Kolmogorov. C. R. Acad. Sci., USSR30, 301 (1941). [21] F. M. Ramos, R. R. Rosa, C. Rodrigues Neto, M. J. A. Bolzan,
and L. D. A. S´a . Nonlinear Analysis,47, 3521 (2001). [22] R. Bruno, V. Carbone, L. Sorriso-Valvo, and B. Bavassano.
Radial evolution of solar wind intermittency in the inner he-liosphere.astro-ph/0303578, 2003.
[23] F. M. Ramos, M. J. A. Bolzan, R. R. Rosa, and L. D. A. Sa. Physica D - Nonlinear Phenomena,193, 278 (2004).
[24] D. Biskamp, E. Schwarz. Physics of Plasmas,87, 3282 (2001). [25] G.-M. Le, J.-L. Wang. Chinese Journal of Astronomical and
Astrophysical,3, 391 (2003).
[26] J. K. Hargreaves.The Upper Atmosphere and Solar-Terrestrial Relations, (1979).