Universidade Nova de Lisboa
Faculdade de Ciências Médicas
Northeastern University
College of Professional Studies
CLINICAL RESEARCH MASTER
C
ONCEPTION AND FIRST RESULTS OF A CROSS
-
SECTIONAL NATIONAL
STUDY ON THE DEMOGRAPHY
,
DISEASE CHARACTERISTICS AND
SOCIOECONOMIC STATUS OF THE
P
ORTUGUESE PATIENTS WITH
M
ULTIPLE
S
CLEROSIS
–
THE
PORT-MS
STUDY
Master's Dissertation | Dissertação de Mestrado
Paulo Jorge Marcelino Serrano Alegria
Under the guidance of | Sob orientação de Professor Doutor Armando Sena
Index
Figure index ...4
Table index ...6
Abbreviations list ...8
Acknowledgements ...9
Abstract | Resumo ...10
Introduction and background...12
Methods ...17
Results ...21
General aspects of the database ...21
General characteristics of the patients and of their disease ...21
Gender ...28
Place of birth ...28
Ethnicity ...29
Analysis of age at first symptoms across the last decades, across clinical types of disease and across genders...29
Analysis of time from first symptoms to diagnosis across the last decades, across clinical types of disease and across genders ...32
Analysis of age at diagnosis across the last decades, across clinical types of disease and across genders...35
Analysis of total follow-up after first symptoms and after diagnosis across clinical types of disease and across genders (includes progression to SPMS) ...38
Analysis of age at inclusion across clinical types of disease and across genders (includes progression to SPMS) ...41
Analysis of the proportions between clinical types of MS across the last decades in time, across different ages at diagnosis and across genders ...43
Analysis of gender across the last decades in time, across different ages at diagnosis and across clinical types of disease ...45
EDSS ...48
Treatment ...51
Level of education ...60
Economic activity and status of employment ...63
Pregnancy ...72
Familial MS ...74
Other data ...75
Conclusions ...84
Summary of contributions ...86
Future research ...87
References ...88
Appendices ...93
Complete study protocol ...93
Constitution of the PORT-MS Study Group ...94
Public presentations of results of the PORT-MS study ...96
Figure index
Figure 1. Geographical localization of the 7 participating centers in phase 1 of the PORT-MS
study. ...18
Figure 2. Example of approval of the PORT-MS study by a local ethic committee (in this case corresponding to the Hospital Beatriz Ângelo). ...20
Figure 3. Clinical type of MS at disease onset (after excluding cases with still ambiguous profile)...23
Figure 4. Decade of life at the time of first symptoms. ...23
Figure 5. Clinical type of MS at diagnosis (after excluding cases with still ambiguous profile). .24 Figure 6. Decade of life of patients at diagnosis. ...25
Figure 7. Patients that reached SPMS by time of CRF filling, having been diagnosed in RRMS phase at diagnosis. ...26
Figure 8. Distribution by clinical type of MS at the day of inclusion in the study. ...26
Figure 9. Current decade of life of patients (at inclusion). ...27
Figure 10. Proportions of current decade of life of patients (at inclusion). ...27
Figure 11. Decade of birth of birth of patients included in the PORT-MS study. ...28
Figure 12. Mean age at first symptoms for diagnosis occurring in each decade in time. ...30
Figure 13. Age at first symptoms by clinical type of MS (RRMS versus PPMS). ...31
Figure 14. Age at first symptoms of PPMS without relapses, male versus female gender. ...32
Figure 15. Time elapsed from first symptoms to diagnosis in RRMS versus PPMS cases. ...33
Figure 16. Mean age at diagnosis for diagnosis ocurring in each decade. We have relatively few cases corresponding to the pre CT scan / MRI era. ...35
Figure 17. Age at diagnosis of group “RRMS at diagnosis” vs PPMS (without relapses)...35
Figure 18. Age at diagnosis by gender for PPMS. ...37
Figure 19. Time of evolution after diagnosis for patients initially diagnosed in RRMS that remained in RRMS at inclusion (left or “Não”) versus those that evolved to SPMS in the meanwhile (right or “Sim”). ...39
Figure 20. Age at inclusion for patients initially diagnosed in RRMS that remained in RRMS at inclusion (left or “Não”) versus those that evolved to SPMS in the meanwhile (right or “Sim”). ...42
Figure 21. Proportion of RRMS versus PPMS in diagnosis occurring in each decade in time. ....44
Figure 22. Proportion of patients diagnosed with PPMS versus RRMS in diagnosis occurring in each decade of life. ...44
Figure 23. Proportion of male to female by decade of birth of patients (highlighted in red the four decades where we have a more representative number of patients). ...46
Figure 24.Proportion of male to female by decade in time at which the diagnosis occurred. ...46
Figure 25.Proportion of male to female by decade of life at which the diagnosis occurred. ...46
Figure 26. Analysis of distribution of gender in each type of disease...47
Figure 27. Distribution of 465 cases of our population with exact EDSS available. ...48
Figure 28. Distribution of patients by classes of EDSS in May 2014. ...48
Figure 29. Relation between the median EDSS and age at the day of CRF filling, and mean age of the patients for each EDSS category. ...49
Figure 31. Distribution of patients by EDSS classes according to decade of birth. Older patients are more frequently distributed in higher classes of EDSS. ...50 Figure 32. Distribution of RRMS and PPMS cases in terms of EDSS. ...50 Figure 33. Distribution of RRMS and PPMS through these the (predefined) classes of EDSS (the sum of the bars of each type of MS completes 100% of patients for that type). ...51 Figure 34. Distribution of types of DMT in our total population, not excluding those not on DMT. ...56 Figure 35. Distribution of types of DMT in our total population that is on DMT. ...57 Figure 36. Distribution of treatments all the population that remains in RRMS phase (not excluding those not on DMT). ...57 Figure 37. Distribution of types of DMT in our population of currently in RRMS that is on DMT. ...58 Figure 38. Distribution of treatments in SPMS population who were on RR phase by time of diagnosis (n=48). ...58 Figure 39. Distribution of treatments of all patients in SPMS at inclusion on our study and on DMT in May 2014 (patients not on DMT excluded). ...59 Figure 40. Distribution of DMT in the total population of PPMS patients (with or without relapses). ...59 Figure 41. Distribution of DMT in the total population of PPMS patients (with or without relapses) that are under DMT. ...60 Figure 42. Number of years of school per gender, total population of our database. ...60 Figure 43. Mean years at school per year of birth of patients (left) and per year in time at which diagnosis occurred (right)...61 Figure 44. Mean number of years at school that patients that were diagnosed at each specific age accomplished. ...62 Figure 45. Number of total years at school is different in RRMS and PPMS but these
populations have different ages at present time. ...62 Figure 46. Distribution of our total population in terms of economic activity. ...63 Figure 47. Distribution of our total economically active population in terms of employment / unemployment. ...63 Figure 48. Comparison of EDSS (in May 2014) between economically active and non-active patients. ...67 Figure 49. EDSS (May 2014) of all employed and all unemployed patients...69 Figure 50. Distribution of the employed population in terms of the employment status (for their main job, as part of patients had several jobs). ...70 Figure 51. Types of contract in the mane job. ...71 Figure 52. Distribution of all Non-Active population by subtypes of economic situation. ...71 Figure 53. Percentage of MS patients by disease type at each study time, in the World.
Table index
Table 1. MS registries in Europe. (Adapted from: Multiple Sclerosis Journal 2014, Vol. 20(11)
1523– 1532.) ...16
Table 2. Identification of the MS Centers that participated in the PORT-MS study (phase 1). ...17
Table 3. Clinical type of MS onset and diagnosis. ...22
Table 4. Clinical type of MS at disease onset (after excluding cases with still ambiguous profile). ...22
Table 5. Clinical type of MS at diagnosis (after excluding cases with still ambiguous profile). ...24
Table 6. Distribution by clinical type of MS at the day of CRF filling. ...26
Table 7. Place of birth of the 40 patients (7,1% of our total patients) that were not born in Portugal. ...29
Table 8. Age at first symptoms for each of the clinical subtypes. ...30
Table 9. Age at first symptoms for male and female gender in selected clinical subtypes. ...31
Table 10. Time elapsed from first symptoms to diagnosis for diagnoses occurring in each decade in time...32
Table 11. Time from symptoms to diagnosis ion each clinical type of disease. ...34
Table 12. Time from symptoms to diagnosis ion gender for selected clinical types of disease. .34 Table 13. Age at diagnosis for the different clinical groups. ...36
Table 14. Age at diagnosis for each of the genders in each clinical group. ...37
Table 15. Evolution of disease departing from first symptoms and from diagnosis for each clinical course. ...38
Table 16. Proportion of patients in RRMS at diagnosis that evolved to SPMS according to time after diagnosis. ...39
Table 17 ...40
Table 18 ...40
Table 19. Age at inclusion for the various clinical courses. ...41
Table 20. Age at inclusion for males and females. ...42
Table 21. Proportion of RRMS versus PPMS by decade of birth of the patients. ...43
Table 22. Proportion of each clinical type of disease in each of the genders. ...45
Table 23.Proportion of females to males in each clinical course...47
Table 24. Proportion of patients under disease modifying treatment (DMT) in May 2014 for the total population of the database and for each subgroup of clinical type of MS. ...51
Table 25. Comparison of the main characteristics of all patients under disease modifying treatment (DMT) versus all patients that were not under DMT (in May 2014)...52
Table 26. Comparison of the main characteristics of patients currently in RRMS that were under disease modifying treatment (DMT) versus those not under DMT (in May 2014). ...53
Table 27. Percentage of patients currently on DMT and that had (other) DMT before in each interval of disease evolution time. ...54
Table 28. Comparison of the main characteristics of patients currently in progressive forms that were under disease modifying treatment (DMT) versus those not under DMT (in May 2014). ...55
Table 29. Proportion of patients on DMT in each EDSS category for each clinical type of disease. ...56
Table 30. Proportion of economically active and the unemployment rate (in the week before inclusion) for selected categories of our sample and for RRMS at inclusion. ...64
Table 32. Comparison of the main characteristics of Active and Non-Active populations. ...66
Table 33. Comparison of the main characteristics of Active and Non-Active currently RRMS populations. ...67
Table 34. Comparison of employed vs unemployed populations (both part of the active population). ...68
Table 35. Comparison between employed RRMS patients and unemployed RRMS ones. ...69
Table 36. Percentage of women with and without live births after diagnosis per decade in time at diagnosis. ...72
Table 37. Distribution of patients with positive family history by relative degree. ...75
Table 38. Summary table of the main PORT-MS study results. ...85
Abbreviations list
Abbreviation English Portuguese
CRF Case Report Form
DMT Disease Modifying
Treatment
EDSS Expanded Disability Status
Scale
EM [Multiple Sclerosis] Esclerose Múltipla
EMSP [Secondary Progressive
Multiple Sclerosis]
Esclerose Múltipla Secundária Progressiva
EMSR [Relapsing Remitting
Multiple Sclerosis]
Esclerose Múltipla Surto Remissão
GA Glatiramer Acetate
ISCE-93 International Classification by Status in Employment (ICSE) 1993
MMF Mycophenolate mofetil
MS Multiple Sclerosis
PP Primary Progressive Primária Progressiva
PPMS Primary Progressive Multiple
Sclerosis
PRMS Progressive Relapsing
Multiple Sclerosis (PPMS with relapses)
RR Relapsing Remitting
RRMS Relapsing Remitting
SP Secondary Progressive Secundária Progressiva
SPMS Secondary Progressive
Multiple Sclerosis
Acknowledgements
I thank Dr José Vale and Professor Maria José Sá for the stimulus and valuable help in the conception and implementation of this study.
I thank very especially the other members of the Coordinating Committee of the study and PI at each of their centers: Dr João Ferreira, Dr João Sequeira, Dr José Tomás, Dr Miguel Grilo, Dr Raquel Samões, and Dr Sara Varanda. They collected all the data from their centers and I share particularly with them the “ownership” of this data. Our work will continue and it is for me a great pleasure to coordinate this very active team.
I thank the heads of the Multiple Sclerosis outpatient clinics of the 7 centers for having permitted the recruitment of their patients and use of their data (Dr José Vale and Professor Maria José Sá already mentioned, and also Professor João Cerqueira, Professor Ana Martins da Silva, Dr Livia Sousa, Professor João de Sá, Dr Rui Pedrosa).
Abstract |
Resumo
Background/aims: In Portugal, there wasn’t a multicentric study on the general characteristics (demography, disease milestones, DMT, socioeconomic status) of Multiple Sclerosis patients.
Methods: Patients fulfilling McDonald 2010 criteria were sequentially recruited from May to November 2014 in 7 centers and data was systematically collected.
Results: 561 patients included. First symptoms occurred at 30,2±10,5 years-old (RRMS 29,2±10, PPMS 39,4±11,7, p<0,001); diagnosis 3,2±5,3 years later (RRMS 3,0±5,1, PPMS 4,9±2,5, p=0,002); 9,4±7,2 years elapsed since diagnosis (similar for those is RRMS at diagnosis and PPMS); current age 42,9±12,4 years-old (group RRMS at diagnosis 42,0±12,1, PPMS 52,5±11,3, p<0,001); current EDSS 2,5 (RRMS 2.0, PPMS 6.0); females to males 2,5:1 (RRMS similar, PPMS 1,1:1, p<0,05); at diagnosis RRMS 90,6%, SPMS 0,9%, PPMS 8,6%; 9,5% of RRMS reached SP at inclusion (those older at diagnosis, in actuality, or with longer follow-up). PPMS more frequent in patients diagnosed at older ages (p<0,001), also slight increase in females. Along the last decades: new cases have showed stable proportions of gender and disease types; age at first symptoms and diagnosis slightly increased, time between them slightly decreased. Proportion on DMT (May 2014): 84,5% of all; 90,4% of currently in RRMS; 70,8% of SPMS; 36,8% of PPMS; 48% of progressive forms together. Type of DMT, all patients: interferons 56,5%, Glatiramer Acetate 18,4%, Natalizumab 11,6%, Fingolimod 9,7%. Economically active 61,5% of all, unemployment 13,5%, 74,1% of non-active are retired due to disease. Females pregnant after diagnosis 15%. Positive family cases in 7,8%.
Discussion/Conclusions: 10% of the national MS population collected. Data generally consistent with international reports. Proportion under DMT relatively high in all disease types, but second line therapies underrepresented. Young patients with mild disease have an active economic life. Those not active are essentially retired due to disease.
Introdução e objetivos: Não existia um estudo multicêntrico que descrevesse as características
Métodos: Doentes McDonald 2010 positivos foram sequencialmente recrutados em 7 centros entre Maio e Novembro 2014. Aplicou-se um Caderno de Recolha de Dados incidindo na
demografia, doença, educação e emprego (estudo PORT-MS).
Resultados: 561 doentes incluídos. Primeiros sintomas aos 30,2±10,5 anos (RRMS 29,2±10, PPMS 39,4±11,7, p<0,001); diagnóstico 3,2±5,3 anos depois (RRMS 3,0±5,1, PPMS 4,9±2,5, p=0,002); tempo de doença após diagnóstico 9,4±7,2 anos (semelhante RRMS no diagnóstico e PPMS); idade atual 42,9±12,4 anos (grupo RRMS no diagnóstico 42,0±12,1, PPMS 52,5±11,3, p<0,001); EDSS atual 2,5 (RRMS 2.0, PPMS 6.0); proporção feminino:masculino é 2,5:1 (RRMS
semelhante, PPMS 1,1:1, p<0,05); no diagnóstico RRMS 90,6%, SPMS 0,9%, PPMS 8,6%; 9,5% dos RRMS encontravam-se em SP na inclusão (nomeadamente os com mais idade no diagnóstico e/ou atualidade ou tempo de doença mais prolongado). PPMS mais frequente em doentes diagnosticados mais tardiamente (p<0,001), onde aumenta também ligeiramente a proporção
de mulheres na PPMS. Nas últimas décadas: novos casos mostram estabilidade na proporção de géneros e tipos de doença; idade nos primeiros sintomas e no diagnóstico aumentou ligeiramente, tempo entre eles diminuiu ligeiramente. Proporção sob DMT (Maio 2014): global 84,5%; atualmente RRMS 90,4%; SPMS 70,8%; PPMS 36,8%; progressivas agregadas 48%. Tipo
de DMT, amostra global: interferões 56,5%, GA 18,4%, Natalizumab 11,6%, Fingolimod 9,7%. Global: economicamente ativos 61,5%, desemprego 13,5%, 74,1% dos não activos estão reformados por doença. Gravidezes após diagnóstico em 15% mulheres. Casos com história familiar positiva 7,8%.
Discussão e conclusões: Incluída cerca de 10% da população portuguesa. Resultados congruentes
Introduction and background
Surveys and registries are essential instruments to gather data on multiple aspects of a disease, including: its epidemiology; its clinical course (especially in the long-term); the provision of treatments, services and supplies for it within a given region; the effectiveness, efficiency (cost-effectiveness) and safety of treatments or other interventions (namely in the long-term); the implementation of guidelines relating to care and treatment; and its quality of life, burden of symptoms and socioeconomic aspects from the patient’s perspective, just to name a few (Flachenecker 2008, Flachenecker 2014). The information provided by these studies is useful not only to ameliorate the quality of care of patients, but also for society in more general terms, by increasing the understanding and knowledge about diseases and allowing authorities and relevant parties to make better informed, more effective, decisions about them. Surveys and registries are also especially important when rare, complex and/or costly diseases, Multiple Sclerosis (MS) belonging to the group that satisfies these three conditions, are concerned. In MS, a number of well-known registries exists in the developed world. Many of them, or all of them if we consider them globally, have been extremely important to understand this complex disease in many ways. They clarified many aspects of the natural history, certain long-term effects of treatments, and also the standards of care. In this, as in other diseases, registries are also increasingly becoming instruments that health authorities use (at the same time as investigators) to plan and control many aspects of the health care. In certain countries, authorities determine the obligatory introduction of patients in registries for certain diseases (one example is the Danish MS Treatment Registry) (Flachenecker 2014).
self-reported diagnoses of registry participants are compared to physician-reported diagnoses and with those based on reviews of medical records. Apart from the NARCOMS Registry, several small and uncoordinated MS registries and databases are available within the United States, but one national harmonized data collection system does not exist (Flachenecker 2008, Hurwitz 2010).
Some studies follow local cohorts prospectively with a high level of detail in information collected (London, Ontario database; British Columbia MS database; New York State MS Consortium database; Department of Veterans Affairs registry; North American Research Committee on MS) ( Hurwitz 2010). The majority of the databases have a prospective follow-up, although some important studies were transversal studies (New Zealand’s cross-sectional national prevalence study of 2006).
of healthcare services; and quality of life, the burden of symptoms and socioeconomic aspects
from the patient’s perspective.
No reference is made to Portugal in this study. There is not, in our country, at least at a multicentric level, a registry or even a wide cross-sectional characterizations of the state of this disease, these patients and their treatment. In fact, demographic, epidemiological or clinical data about MS at a regional or national level is scarce in Portugal. A population-based prospective study conducted over a period of five years and published in 2006 revealed a prevalence of 46.3/100 000 in the district of Santarém (De Sá 2006, De Sá 2010), and in 2010 a national transversal study using a survey determined a self-reported MS prevalence in continental-Portugal, among adults of 54/100 000 and an estimated number of patients of 4287 (varying between 2700 and 5875) (EMCode, DGS). We did not find other relevant publications of national level about general aspects of the disease in our country.
Having this in mind, the author of this dissertation, coordinating a group of other investigators, set up the here presented PORT-MS study with the primary objective of knowing the characteristics of the Portuguese MS population in terms of demography, main disease milestones, present clinical state, general aspects of treatment and socioeconomic status, including education and employment data. Secondary objectives of this study were: to identify any eventual focus of high or low prevalence in the Portuguese territory; to collect data on pregnancy in female MS patients; to collect data on familial cases of MS; to know the proportion of patients that has participated in interventional trials; to identify any possible asymmetries in demography, clinical characteristics, milestones of the disease or standards of diagnosis and care between Portugal and other countries and contribute to the explanation or correction of these asymmetries; to foster the development of a prospective national registry and eventually contribute to a European database.
Table 1. MS registries in Europe. (Adapted from: Multiple Sclerosis Journal 2014,
Methods
The complete protocol of this study is presented in the Appendices section of this document. Study rationale and objectives, design and procedures, population and sample, informed consent and regulatory aspects, CRF and publication policy are detailed there. Here I present only a brief summary and documentation or data produced after protocol submission (authorizations from competent parties).
Participants
MS patients fulfilling McDonald 2010 criteria in seven participating centers (Table 2 and Figure 1) were sequentially recruited in the outpatient clinics, day-hospital and Neurology wards, from May 2014 until November 2014 (this constitutes the “phase 1” of this project). In order to avoid selection bias, participating physicians were encouraged to include all patients with MS seen in their practice.
Table 2. Identification of the MS Centers that participated in the PORT-MS study (phase 1).
Serviço de Neurologia, Hospital de Braga, Braga, Portugal
Serviço de Neurologia, Centro Hospitalar de São João, Porto, Portugal
Serviço de Neurologia, Centro Hospitalar do Porto – Hospital de Santo António, Porto, Portugal
Serviço de Neurologia, Centro Hospitalar Universitário de Coimbra, Coimbra, Portugal
Serviço de Neurologia, Hospital Beatriz Ângelo, Loures, Portugal
Serviço de Neurologia, Centro Hospitalar de Lisboa Norte – Hospital de Santa Maria, Lisboa, Portugal
Collected Data
A systematized Case Report Form (CRF) collecting retrospective and present data directly from
the clinical file, the patient and the patient’s physician was applied (cross-sectional study). Date and place of residency at birth, at first symptoms and at diagnosis of MS, gender, migrations abroad during life, disease clinical course, current (May 2014) treatment and EDSS, education (International Standard Classification of Education - ISCED 2011), status of employment in the week preceding the CRF filling (International Classification of Status of Employment - ICSE 1993), need for a caregiver, involvement in clinical trials, familial MS and pregnancy.
Data sets were coded using a unique key designed to allow us to identify repeated cases due to simultaneous follow-up in different hospitals.
Statistical analysis
Phase 1 of this study, which occurred between the mentioned dates, was expected to include 500 patients, which was accomplished.
We used SPSS software for Windows, version 20 (SPSS Inc., Chicago, IL, USA) to calculate descriptive and inferential statistics. Parametric and Non-Parametric tests were used. Comparisons were labeled as statistically significant at the conventional p-value of less than 0.05.
Ethics and other approvals
According to the Portuguese law concerning the treatment of healthcare data and clinical investigation, this study was submitted to the [National Committee for Data Protection] (CNPD, Comissão Nacional de Proteção de Dados) and approved by this organization. The corresponding file number is 5288/2014 and the approval number is the 6761/2014. This data is public and
available at the CNPD’s internet site.
Although this study is not a Clinical Trial, according to the Portuguese law on clinical investigation (Law number 21/2014, dated the 16th April 2014), this study was submitted to the local ethics
committee of each of the hospitals (CES, Comissão de Ética para a Saúde, in the Portuguese acronym and designation) where this study run (and is still running), and approved by each of them. Figure 2 shows one example of these approvals for the sake of proof.
Figure 2. Example of approval of the PORT-MS study by a local ethic committee (in this
Results
General aspects of the database
The MS centers of seven hospitals collaborated to this database (Table 2 and Figure 1). These hospitals are distributed throughout the northern, central and southern coastal side of the Portuguese continental territory. Six of them are University hospitals, one of them is not. Five
of these University hospitals are classified as “tertiary” or “central” hospitals, and they hold the
five biggest MS centers in Portugal. The other two hospitals are considered more like “regional” hospitals. Together, these institutions may follow more than half of the Portuguese MS patients, but the number included until now in this database is partial in each of them, globally equilibrated between institutions but reflecting, at the same time, the total number of patients each of them has on follow-up.
The patients that eventually refused to participate in the study were not registered but we are not aware of any, so they must have been exceptional at most (in view of the number of investigators involved, we theoretically admit that the coordinating investigators of the study might have missed some exceptional cases).
The first CRF was filled in May 2014, the last one in November of the same year. No repeated patients were detected in the 568 patients initially included but seven patients were excluded due to incomplete data in six cases and incongruent data in one case.
561 patients were confirmed as fulfilling the minimum requirements in terms of data available and congruency of data. Considering the estimated total number of 5000 to 6000 patients with MS in Portugal, this database contains around 10% of the Portuguese patients.
General characteristics of the patients and of their disease
certain clinical profile at disease onset (first symptoms) is, in the great majority of patients,
based in the anamnesis. We didn’t ask specifically if a patient that was assumed to start as a
progressive relapsing form was still having relapses at diagnosis. We opted for distinguishing progressive relapsing patients from not relapsing ones to more accurately identify a group of progressive patients with less bias.
The clinical type of MS at disease onset and diagnosis is shown in Table 3.
Table 3. Clinical type of MS onset and diagnosis.
The clinical type of disease at disease onset (first symptoms), derived from the previous table, is shown in Table 4 and Figure 3 (we excluded a few patients that were still not definitively classified at inclusion).
RR 91,9%
PP w/o relapses 6,8% PP w/ relapses 1,3%
Figure 3. Clinical type of MS at disease onset (after excluding cases with still ambiguous profile).
First symptoms of disease occurred at the age of 30,2±10,5 years-old. (min 5; max 70). The first symptoms were reported to have occurred between November 1964 and May 2014 (median December 200).
Figure 4. Decade of life at the time of first symptoms.
91,9%
6,8%
1,3%
RR
PP w/o relapses
Time elapsed from first symptoms to diagnosis was 3,2±5,3 years in our sample.
The clinical type of disease at diagnosis is shown in Table 5 and Figure 5 (we excluded a few patients that were still not definitively classified at inclusion).
RR 91,0%
SP 0,9%
PP w/ or w/o relapses 8,1%
Table 5. Clinical type of MS at diagnosis (after excluding cases with still ambiguous profile).
Figure 5. Clinical type of MS at diagnosis (after excluding cases with still ambiguous profile).
Mean age at diagnosis was 33,4±11,1 years-old (min: 5; max: 70). The diagnosis of MS occurred between June 1978 and September 2014 (median February 2007).
91,0%
0,9% 8,1%
RR
SP
Figure 6. Decade of life of patients at diagnosis.
The time of disease evolution from diagnosis to inclusion for our total sample is 9,4±7,2 years (min: 0; max: 36,2; median: 7,5 years).
Total time of disease evolution from first symptoms to inclusion of patients in our sample is 12,6±9,2 years (min: 0,2; max: 49,8 years).
Time from diagnosis to inclusion of group “RRMS at diagnosis” is 9,6±7,3 years, and of PPMS patients it is 8,1±6,4 years (p=0,2, Independent-samples Mann-Whitney U test).
Figure 7. Patients that reached SPMS by time of CRF filling, having been diagnosed in RRMS phase at diagnosis.
The clinical types of MS at inclusion (or current type of MS or, type of MS at present time) is shown in table Table 6 and Figure 8.
RR 82%
SP started after diagnosis 8,6% SP already at diagnosis 0,9% PP w/ or w/o relapses 8,0%
doubtful 0,5%
Table 6. Distribution by clinical type of MS at the day of CRF filling.
Figure 8. Distribution by clinical type of MS at the day of inclusion in the study. 82,0%
8,6% 0,9%
8,0% 0,5%
RR
The age of the total patients in our sample at inclusion is 42,9±12,4 years-old (min: 17; max: 76 years).
Figure 9. Current decade of life of patients (at inclusion).
Figure 10. Proportions of current decade of life of patients (at inclusion).
Figure 11. Decade of birth of birth of patients included in the PORT-MS study.
Gender
70,8% (n=397) of patients of our sample are female (29,2% male, n=164), which is equivalent to a proportion of 2,5 females to 1 male.
Place of birth
Table 7. Place of birth of the 40 patients
(7,1% of our total patients) that were
not born in Portugal.
Ethnicity
98,9% of the patients in the database are white, five patients are black (0,9%), and one case is of south Asian ethnicity (0,2%).
Analysis of age at first symptoms across the last decades, across clinical
types of disease and across genders
Figure 12. Mean age at first symptoms for diagnosis occurring in each decade in time.
Age at first symptoms of group “RRMS at diagnosis” was 29,3±10 years-old (n=508, CI95%: [28,5;30,2]) versus 39,4±11,7 years-old (n=38, CI95%: [35,6;43,3]) in PPMS patients (p<0,001, Independent-samples Mann-Whitney U test) (Table 8, Figure 13Figure 13. Age at first symptoms by clinical type of MS (RRMS versus PPMS).). From the group of patients RRMS at diagnosis, those that were already in SPMS at inclusion had started the disease at the same age than those that remained in RRMS at inclusion.
N Age at first symptoms
(years-old)
All 561 30,2±10,5
RRMS at diagnosis 508 29,3±10
PPMS
(w/o relapses) 38 39,4±11,7
PPMS w/ relapses 7 42,1±9,7
PPMS together 45 39,9±11,3
SPMS at diagnosis 5 28,6±8,5
SPMS at inclusion
(RRMS at diagnosis) 48 30,62±10,6
RRMS at inclusion 458 29,22±9,9
All SPMS at inclusion 53 30,4±10,4
Figure 13. Age at first symptoms by clinical type of MS
(RRMS versus PPMS).
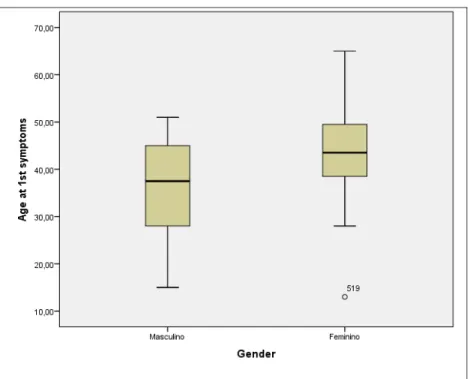
Men reported first symptoms at an earlier age than women. Although small, this difference attains statistical significance when we analyze the whole sample or only RRMS at diagnosis. The difference is more marked in PPMS (without relapses), but here statistical significance is not attained, probably due to our small number of patients (Table 9,Figure 14).
Male (N) age at first
symptoms
Female (N) age at first
symptoms
p
All (164) 28,6±9,4 (396) 30,9±10,9
0,021 (Independent-samples Mann-Whitney U test)
RRMS at diagnosis (144) 27,6±8,9 (363) 30,0±10,3
0,015 (Independent-samples Mann-Whitney U test) PPMS
(w/o relapses) (18) 35,8±11,2 (20) 42,7±11,3
Figure 14. Age at first symptoms of PPMS without relapses, male versus female gender.
Analysis of time from first symptoms to diagnosis across the last decades,
across clinical types of disease and across genders
If we only consider from 1991 onwards (we have only 30 patients diagnosed before that date in our database), time from first symptoms to diagnosis seems to has slightly reduced throughout these last decades. There is no significant statistical difference between groups, though (Independent-Samples Kruskal-Wallis test) (Table 10).
Table 10. Time elapsed from first symptoms to diagnosis for
Time from first symptoms to diagnosis of “RRMS at diagnosis” cases was 3,0±5,1 years (n=508,
CI95%: [2,6;3,5]) versus 4,9±2,5 years (n=38, CI95%: [2,8;7,0]) in PPMS patients. There is a statistically significant difference between these groups (p=0,002, Independent-samples Mann-Whitney U test) (Figure 15).
Figure 15. Time elapsed from first symptoms to diagnosis in RRMS versus PPMS cases.
Those that were considered to have started in RRMS form but were already in SPMS at diagnosis reported a much higher lapse of time between first symptoms and diagnosis than patients that were still in RRMS at diagnosis (p=0,03, Independent-samples Mann-Whitney U test).
N First symptoms to diagnosis (years)
All 561 3,2±5,3
RRMS at diagnosis 508 3,0±5,1
PPMS
(w/o relapses) 38 4,9±2,5
PPMS w/ relapses 7 4,3±3,3
PPMS together 45 4,8±6,1
SPMS at diagnosis 5 9,98±6,1
SPMS at inclusion
(RRMS at diagnosis) 48 7,3±8,3
RRMS at inclusion 458 2,5±4,4
All SPMS at inclusion 53 7,6±8,1
Table 11. Time from symptoms to diagnosis ion each clinical type of disease.
There are no statistical differences in the elapsed time from first symptoms to diagnosis between genders (Table 12).
Male (N) from first symptoms to diagnosis (years)
Female (N) from first symptoms to diagnosis (years)
p
All (164) 3,1±5,1 (396) 3,3±5,4
n.s. (Independent-samples Mann-Whitney U test)
RRMS at diagnosis (144) 3,0±5,3 (363) 3,0±5,1
n.s. (Independent-samples Mann-Whitney U test)
PPMS
(w/o relapses) (18) 3,4±3,5 (20) 6,3±8,1
Analysis of age at diagnosis across the last decades, across clinical types of
disease and across genders
Age at diagnosis (Erro! A origem da referência não foi encontrada.) is slightly higher in these last decades (p=0,035, Independent-Samples Kruskal-Wallis test).
Figure 16. Mean age at diagnosis for diagnosis ocurring in each decade. We have relatively few cases
corresponding to the pre CT scan / MRI era.
Age at diagnosis of “RRMS at diagnosis” cases was 32,3±10,4 years-old (n=508, CI95%: [31,4;33,2]) versus 44,2±11,6 years-old (n=38, CI95%: [40,4;48,1]) in PPMS patients (p<0,001, Independent-samples Mann-Whitney U test) (Figure 17).
Inside patients in “RRMS at diagnosis”, those that later developed SPMS before inclusion were already diagnosed at a later age than the rest of the group “RRMS at diagnosis”, that’s to say, than “RRMS at diagnosis” that remained in RRMS at inclusion (38,0±10,4 vs 31,8±10,3, p<0,001, Independent-samples Mann-Whitney U test) . As a matter of fact, they have been diagnoses at the same age than a small group of patients that have been diagnosed already in the SPMS form.
N Age at diagnosis
(years-old)
All 561 33,4±11,1
RRMS at diagnosis 508 32,3±10,4
PPMS
(w/o relapses) 38 44,2±11,6
PPMS w/ relapses 7 46,4±11,9
PPMS together 45 44,6±11,6
SPMS at diagnosis 5 38,4±9,99
SPMS at inclusion
(RRMS at diagnosis) 48 38,0±10,4
RRMS at inclusion 458 31,8±10,3
All SPMS at inclusion 53 38,0±10,3
Table 13. Age at diagnosis for the different clinical groups.
Male (N) Age at diagnosis
(years-old)
Female (N) Age at diagnosis
(years-old)
p
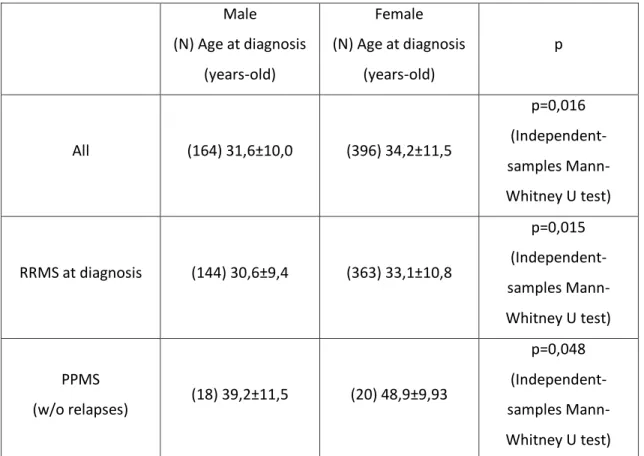
All (164) 31,6±10,0 (396) 34,2±11,5
p=0,016 (Independent-samples Mann-Whitney U test)
RRMS at diagnosis (144) 30,6±9,4 (363) 33,1±10,8
p=0,015 (Independent-samples Mann-Whitney U test)
PPMS
(w/o relapses) (18) 39,2±11,5 (20) 48,9±9,93
p=0,048 (Independent-samples Mann-Whitney U test) Table 14. Age at diagnosis for each of the genders in each clinical group.
Analysis of total follow-up after first symptoms and after diagnosis across
clinical types of disease and across genders (includes progression to SPMS)
Time from diagnosis to inclusion of group “RRMS at diagnosis” is 9,6±7,3 years, similar to that of PPMS patients, which is 8,1±6,4 years (p=0,2, Independent-samples Mann-Whitney U test).
Mean time of evolution from diagnosis to inclusion of patients that evolved to SPMS after diagnosis is the double of those who did not (16,5±7,2 years versus 8,8±6,9 years) (Erro! A origem da referência não foi encontrada.). We had seen before that, although these patients
had presented the first symptoms at the same age as others “RRMS at diagnosis”, they already
had more time of interval between first symptoms and diagnosis and had been diagnosed at a later age.
N
First symptoms to inclusion
(years)
Diagnosis to inclusion
(years)
All 561 12,6±9,2 9,4±7,2
RRMS at diagnosis 508 12,6±9,3 9,6±7,3
PPMS
(w/o relapses) 38 12,98±8,4 8,1±6,4
PPMS w/ relapses 7 13,0±7,4 8,8±8,5
PPMS together 45 12,98±8,2 8,2±6,7
SPMS at diagnosis 5 19,5±8,7 9,5±8,2
SPMS at inclusion
(RRMS at diagnosis) 48 23,8±10,98 16,5±7,2
RRMS at inclusion 458 11,3±8,1 8,8±6,9
All SPMS at inclusion 53 23,4±10,8 15,9±7,5
Table 15. Evolution of disease departing from first symptoms and from diagnosis for each clinical course.
Table 16 gives us a perspective of the proportion of patients that progresses to SPMS along the evolution time after diagnosis.
Time after diagnosis
Corresponding number of patients we have in our database
Proportion of patients that reached SPMS in the meanwhile
≤5 years N=171 2,3%
≤7 years N=237 3%
≤10 years N=302 3,3%
≤15 years N=? 5%
≤20 years N= 458 6,6%
All N=508 9,5%
Table 16. Proportion of patients in RRMS at diagnosis that evolved to SPMS according to time after diagnosis.
Figure 19. Time of evolution after diagnosis for patients initially diagnosed in RRMS that remained in RRMS at inclusion (left or “Não”) versus those that evolved to SPMS in the meanwhile (right or “Sim”).
Male (N) First symptoms
to inclusion (years)
Female (N) First symptoms
to inclusion (years)
p
All (164) 12,8±9,1 (396) 12,6±9,2
n.s. (Independent-samples Mann-Whitney U test)
RRMS at diagnosis (144) 12,8±9,2 (363) 12,5±9,3
n.s. (Independent-samples Mann-Whitney U test) PPMS
(w/o relapses) (18) 11,6±7,2 (20) 14,2±9,3
n.s. (Independent-samples T test) Table 17
Male (N) Diagnosis to
inclusion (years)
Female (N) Diagnosis to
inclusion (years)
p
All (164) 9,7±6,9 (396) 9,3±7,4
n.s. (Independent-samples Mann-Whitney U test)
RRMS at diagnosis (144) 9,8±6,95 (363) 9,5±7,4
n.s. (Independent-samples Mann-Whitney U test)
PPMS
(w/o relapses) (18) 8,2±6,1 (20) 7,9±6,9
Analysis of age at inclusion across clinical types of disease and across
genders (includes progression to SPMS)
Age at inclusion is considerably higher for PPMS than for group “RRMS at diagnosis” (52,5±11,3 years-old versus 42,0±12,1 years-old, respectively, p<0,001, Independent-samples Mann-Whitney U test) or for group “RRMS at inclusion” (52,5±11,3 old versus 40,7±11,6 years-old, respectively, p<0,001, Independent-samples Mann-Whitney U test) (Table 19).
Patients “RRMS at diagnosis” that remain in “RRMS at inclusion” are 40,7±11,6 years-old at
inclusion, whereas “RRMS at diagnosis” that evolved to SPMS at inclusion are 54,5± 10,1
(p<0,001) (Figure 20).
N Age at inclusion
(years-old)
All 561 42,9±12,4
RRMS at diagnosis 508 42,0±12,1
PPMS
(w/o relapses) 38 52,5±11,3
PPMS w/ relapses 7 55,1±10,6
PPMS together 45 52,9±11,1
SPMS at diagnosis 5 47,8±9,9
SPMS at inclusion
(RRMS at diagnosis) 48 54,5± 10,1
RRMS at inclusion 458 40,7±11,6
All SPMS at inclusion 53 53,9±10,2
Figure 20. Age at inclusion for patients initially diagnosed in RRMS that remained in RRMS at inclusion (left or “Não”) versus those that evolved to SPMS in the meanwhile (right or “Sim”).
Men with PPMS (without relapses) included in our sample are younger than women (Table 20). We have seen before that they started first symptoms are a slightly younger age (statistically n.s.) and that they also were diagnosed at an earlier age than their female counterparts. Time from first symptoms to diagnosis and follow-up from diagnosis to inclusion is the same, though (statistically). We have a little number of patients in these categories and this data should be conformed with a larger numbers of patients.
Male (N) Age at inclusion
(years-old)
Female (N) Age at inclusion
(years-old)
p
All (164) 41,5±11,2 (396) 43,6±12,9
n.s. (Independent-samples Mann-Whitney U test)
RRMS at diagnosis (144) 40,4±10,8 (363) 42,6±12,6
n.s. (Independent-samples Mann-Whitney U test)
PPMS
(w/o relapses) (18) 47,6±11,5 (20) 56,95±9,4
Analysis of the proportions between clinical types of MS across the last
decades in time, across different ages at diagnosis and across genders
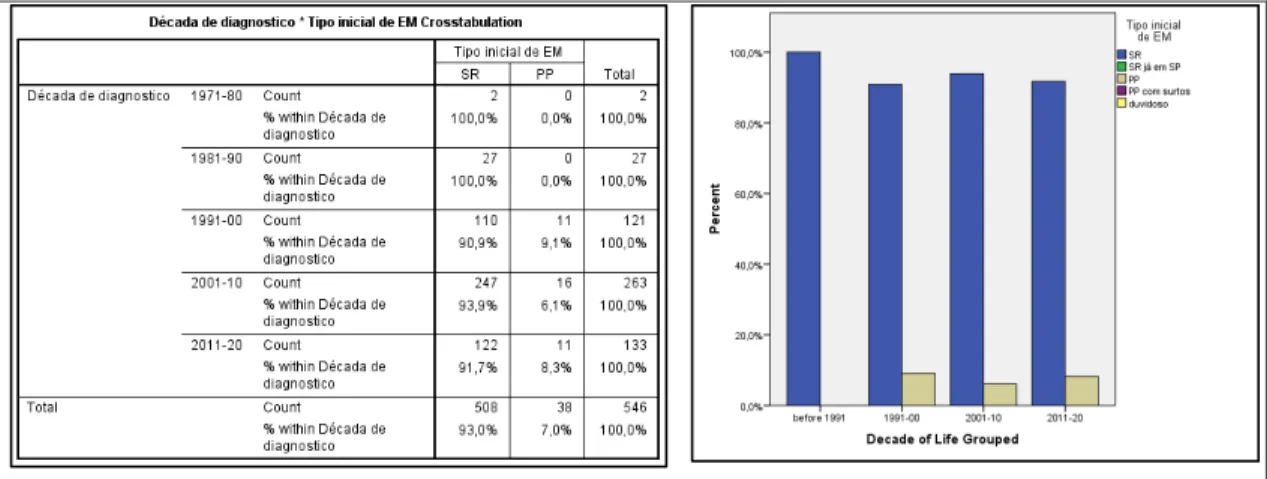
The number PPMS (without relapses) compared to RRMS (we have very few patients diagnosed
in the groups “RR already in SPMS” and “PPMS with relapses”), at diagnosis, is higher in patients
born is more distant decades (then, older patients) that in patients born more recently as is shown in Table 21.
Table 21. Proportion of RRMS versus PPMS by decade of birth of
the patients.
Figure 21. Proportion of RRMS versus PPMS in diagnosis occurring in each decade in time.
The apparent dissociation of the two precedent results is explained by the fact that the proportion of patients with PPMS is higher in patients diagnosed later in life (p<0,001, Pearson Chi-Square test, Cochran criteria verified after joining together the first and second decades of life, and excluding the 7th decade of life, due to low number of patients in those groups) (Erro! A origem da referência não foi encontrada.).
Figure 22. Proportion of patients diagnosed with PPMS versus RRMS in diagnosis occurring in each decade of life.
Males Females Proportion of RMMS
at disease onset 88,4% 92,7%
% of PPMS (w/o relapses) at disease
onset
11% 5%
Proportion of RRMS at diagnosis that had progressed to SPMS at
inclusion
8,4% 9,9%
Table 22. Proportion of each clinical type of disease in each of the genders.
Analysis of gender across the last decades in time, across different ages at
diagnosis and across clinical types of disease
The proportion of male to female seems globally stable when we analyze it by decade of birth of patients (p=0,08, Pearson Chi-Square test, Cochran criteria verified after joining together the first 2 decades, where we have relatively few cases) (Figure 23).
It’s also stable when we analyze it by decade in time at which the diagnosis occurred (see Figure 24, where we should look essentially to the last 3 decades, where we have a more representative number of patients).
Figure 23. Proportion of male to female by decade of birth of patients (highlighted in red the four decades where we
have a more representative number of patients).
Figure 24.Proportion of male to female by decade in time at which the diagnosis occurred.
The analysis of distribution of gender in each type of disease shows a proportion of 2,5 females to 1 male in “RRMS at diagnosis” and an almost equilibrated representation of both sexes in PPMS (without relapses), with 1,1 females to 1 male (p<0,05, Pearson Chi-Square, Cochran criteria verified) (Figure 26).
Figure 26. Analysis of distribution of gender in each type of disease.
The proportion of females to males in each clinical group of our sample is shown in Table 23.
Females:Males
All 2,5:1
RRMS at diagnosis 2,5:1
PPMS
(w/o relapses) 1,1:1
PPMS w/ relapses Low number of patients
PPMS together 1,4:1
SPMS at diagnosis Low number of patients SPMS at inclusion
(RRMS at diagnosis) 3:1
RRMS at inclusion 2,5:1
EDSS
The exact value of EDSS in May 2014 was possible to obtain for 465 patients (83% of the total patients). Median EDSS for the 465 patients with exact EDSS available is 2,5 (P25: 1,0; P75: 5,0). Distribution of patients according to the exact EDSS is shown in Figure 27.
Figure 27. Distribution of 465 cases of our population with exact EDSS
available.
The class of EDSS was obtained for all patients as predefined in the CRF and essentially taking ability to walk in consideration. Distribution of patients by these classes of EDSS is shown in Figure 28.
For the 465 patients for whom we have an exact value of EDSS available, the relation between the current median EDSS and the year of birth (or current age), and between current median EDSS and both time of disease evolution since first symptoms and time of disease evolution since diagnosis, is shown in Figure 29and Figure 30 respectively. Older patients show a tendency
to higher EDSS values (rho=0,44, p<0,001, Sperman’s correlation), as do patients with longer
elapsed times since first symptoms (rho=0,45, p<0,001, Sperman’s correlation), or diagnosis (rho=0,40, p<0,001, Sperman’s correlation).
Figure 29. Relation between the median EDSS and age at the day of CRF filling, and mean age of the patients for
each EDSS category.
Figure 30. Relation between the median EDSS and the time of evolution since first symptoms and the time of
For the whole population of our database, the distribution by EDSS classes according to decade of birth renders similar results (Figure 31), as older patients show higher representations of higher EDSS categories.
Figure 31. Distribution of patients by EDSS classes according to decade of birth. Older patients are more
frequently distributed in higher classes of EDSS.
Although “RR at diagnosis” and PP types have about the same time of evolution after diagnosis
in our database, we verify that EDSS, at present time, is different between the two groups, as shown in Figure 32 and Figure 33 . Analyzing patients in our database for whom we have exact EDSS, we ascertain, for the RRMS group (n= 420), a median EDSS of 2,0 (P25: 1,0; P75: 4,0) and median EDSS for PPMS patients (n= 31) of 6,0 (P25: 5,0; P75: 7,0).
Figure 33. Distribution of RRMS and PPMS through these the (predefined) classes of EDSS (the sum of the bars of each type of MS completes 100% of patients for that type).
Treatment
84,5% of our total population of patients were under Disease Modifying Treatment (DMT) in May 2014 (Table 24). Patients currently in RRMS form are under DMT in 90,4% of cases, as are more than half of patients currently in progressive forms (especially those in SPMS).
Population N Under DMT (May 2014)
All patients 561 84,5%
RRMS at diagnosis (independently of current clinical type) 508 88,4%
Currently in RRMS 459 90,4%
RRMS at diagnosis that evolved to SPMS 48 70,8%
SPMS at diagnosis 5 80%
All currently in SPMS together 53 71,6%
PPMS (with or without relapses) 45 44,4%
All progressive forms together 98 59,2%
Table 24. Proportion of patients under disease modifying treatment (DMT) in May 2014 for the total population of
Taking all the population of our database together, patients not under treatment differ from those under DMT in that they have been diagnosed at a somewhat older age, they are currently older, their disease is slightly longer, but above all in that half of them have progressive forms (Table 25). This last fact also means that half of the non-treated patients are in RRMS form, which theoretically should be under DMT (see under). Half of the non-treated patients have, been treated before.
ALL PATIENTS
Under DMT (May 2014) N= 474 (84,5%)
No DMT (May 2014)
N=87 (15,5%) p
Age at diagnosis
(years-old) 32,6 (±10,7) 38,3 (±12,0) p<0,001
Disease evolution time
(years) 9,1 (±6,9) 11,3 (±8,5) n.s.
Current Age (years-old) 41,7 (±11,9) 49,6 (±13,2) p<0,001
% Females 71,3% 67,8% n.s.
% Progressive forms 12,2% 46% p<0,001
EDSS (median) 2.0 4.0 – 4.5 p<0,001
No DMT = Patient’s
decision Not applicable 13,3% -
Were previously on
(other) DMT 51% 50% n.s
Table 25. Comparison of the main characteristics of all patients under disease modifying treatment (DMT) versus all
patients that were not under DMT (in May 2014).
The 10% (n=44) of patients currently in RRMS are not under treatment been diagnosed at a slightly older age and they are currently also slightly older than the 90% treated patients, also in
part because they have the disease at a longer time, but these differences don’t seem too
15% of the non-treated patients chose not to be treated (n=7). The remaining are not under treatment due to medical decision, then. Our data also shows that another 15% of all non-treated RRMS (n=7) have a very recent diagnosis (2 months or less) which can be an
explanation per se. We also know that another situation where a substantial part of RRMS are not on DMT is when the diagnosis has 20 or more years (Table 27). Then, globally, patients with RRMS not treated, in Portugal, they are either in the first 3 months of disease or they have more than 10 years of disease. We have no other data to explain the other cases. Nevertheless, 75,7% of all these non-treated patients were women, men and women have about the same age (45,1±13,8 years-old), they have 11,5±9,2 years of disease evolution after diagnosis and their EDSS is distributed from 0,0 to 8,0 in a relatively equilibrated fashion without significant differences.
CURRENTLY RRMS (N=459)
Under DMT (May 2014) N= 415 (90,4%)
No DMT (May 2014)
N=44 (9,6%)* p
Age at diagnosis
(years-old) 31,6 (±10,2) 33,5 (±11,1) n.s.
Disease evolution time
(years) 8,7 (±6,6) 10,5 (±8,8) n.s.
Current Age (years-old) 40,3 (±11,3) 43,9 (±13,4) n.s.
% Females 71,3% 72,7% n.s.
EDSS (median) 2.0 2.5 n.s.
No DMT = Patient’s
decision Not applicable 15% -
Were previously on
(other) DMT 49% 47,7% n.s.
* Of these, 7 cases (15%) had less than 3 months of diagnosis (none of them coinciding with the 15% that refused treatment).
Table 26. Comparison of the main characteristics of patients currently in RRMS that were under disease modifying
treatment (DMT) versus those not under DMT (in May 2014).
even 20 years of disease evolution, always stayed of the first DMT. The remaining 20% change DMT somewhere in the middle. As stated before, it’s in the second decade of disease evolution that some RRMS patients quit DMT, which is even more pronounced after the 20th year of
disease after diagnosis. This table must, of course, be interpreted in the particular context of the availability of therapies. This availability is homogenous in Portugal because almost all patients are treated in public hospital with very similar availability (some discrepancies exist in practice due to different administrative procedures to have access to some (more expensive) therapies). In 2014, in Portugal, despite approval by the EMA of drugs like dimethyl fumarate, teriflunomide and alemtuzumab, none of these is widely available in Portuguese public hospitals.
PATIENTS THAT REMAIN IN RRMS
Years after diagnosis N Under DMT …of which had been on other DMT before (%)
<=1 35* 80% 0%
1-2 36 88,9% 15,6%
2-3 28 96,4% 44,4%
3-4 29 100% 41,4%
4-5 39 94,9% 51,4%
5-10 125 93,6% 56,4%
10-15 74 86% 60,8%
15-20 50 96% 62,5%
>20 30 63,3% 59,1%
* All the patients not under DMT in this group (7 patients, 20% of the group) had less than 3 months of diagnosis.
Table 27. Percentage of patients currently on DMT and that had (other) DMT before in each interval of disease
evolution time.
CURRENTLY PROGRESSIVE (N=98)
Under DMT (May 2014) N= 58 (59,2%)
No DMT (May 2014)
N=40 (40,8%) p
Age at diagnosis
(years-old) 39,5 (±12) 43,3 (±10,1) n.s
Disease evolution time
(years) 12,2 (±8,3) 12,4 (±7,9) n.s.
Current Age (years-old) 51,8 (±11,0) 55,8 (±9,5) n.s.
% Females 70,7% 62,5% n.s.
EDSS (median) 6.5 6.0 n.s.
No DMT = Patient’s
decision Not applicable 10,8% -
Were previously on
(other) DMT 65% 55% n.s.
Table 28. Comparison of the main characteristics of patients currently in progressive forms that were under disease
modifying treatment (DMT) versus those not under DMT (in May 2014).
EDSS category N On DMT
ALL PATIENTS
<= 4.0 404 88,9%
4.5-6.0 95 76,8%
>=6.5 62 67,7%
CURRENTLY IN RRMS
<= 4.0 388 90,5%
4.5-6.0 57 89,5%
>=6.5 14 92,9%
CURRENTLY IN PROGRESSIVE FORMS
<= 4.0 13 53,8%
4.5-6.0 37 59,5%
>=6.5 48 60,4%
Table 29. Proportion of patients on DMT in each EDSS category for each clinical type of disease.
The proportion of our total population (progressive patients included) in each type of treatment is shown in Figure 34 (not excluding patients not under DMT) and Figure 35 (after excluding patients that where not on DMT in May 2014). 74,9% (approximately) of our treated patients were under first line DMT (interferons and GA), 21,3% were under 2nd line DMT (natalizumab or fingolimod), (around) 3,7% were on “other therapies” (these are explained under, for each clinical type).
Figure 35. Distribution of types of DMT in our total population that is on DMT.
From the total population classified as RRMS at diagnosis (n=508), then excluding those cases that were diagnosed as “RRMS already on SP” at diagnosis, we observe that 88,4% were under treatment in May 2014, independently of having reached SPMS in the meanwhile (which actually happened in 9,4% of these patients). 90,4% (n=415) of RRMS patients that were considered not
to have reached SP phase (n=459), that’s to say of patients “currently in RRMS”, were under
DMT in May 2014. The distribution of their treatments is shown in Figure 36and Figure 37. Interferons and GA together (first line therapies) totalize 76,6% of cases, Natalizumab and Fingolimod togeteher (2nd line therapies) totalize 21,5% of cases. “Other therapies” in Figure 37
include mycophenolate mofetil, azathioprine and human immunoglobulin.
Figure 37. Distribution of types of DMT in our population of currently in RRMS that is on DMT.
In total there were 53 patients with SPMS by inclusion: 38 were in RRMS at diagnosis, 5 were already in SPMS by diagnosis (Figure 38). Considering all patients in SPMS under DMT (Erro! A origem da referência não foi encontrada.), interferons and GA together complete 63.2% of
cases, Natalizumab and Fingolimod together complete 26.3%, “other therapies” include
ocrelizumab, mycophenolate mofetil and azathioprine.
Figure 39. Distribution of treatments of all patients in SPMS at inclusion on our study and on DMT in May 2014 (patients not on DMT excluded).
Figure 40 and Figure 41 show the distribution of DMT in the PPMS population. The 6 patients
under “other drugs” represent: ocrelizumab (3 patients), azathioprine (2 patients)) and MMF (1 patient)
Figure 41. Distribution of DMT in the total population of PPMS patients (with or without relapses) that are under DMT.
Level of education
The mean number of years at school of the total population is 12±4,5 years (P25: 9; P75: 16 years; min: 0; max: 27 years). If we only analyze patients older than 20 or 30 year-old, in an effort to exclude those cases that could still have their education incomplete by time of analysis, the result is about the same (in part this is due to the fact that we have only eight patients 20 years-old or younger and 102 patients 30 years-years-old or younger, but this could also mean that by time of diagnosis the overwhelming majority of patients have their education complete or interrupt it).
There is no difference between male and female patients (Figure 42).
There is a weak, although significant, correlation between year of birth (or age) and years of education (r=0,34, p<0,001, Pearson correlation), with older patients showing lower levels of education. If we only analyze patients older than 20 or 30 year-old in an effort to exclude those cases that could still have their education incomplete by time of analysis, the result is about the same (reasons pointed out above).
Similarly, patients diagnosed more recently have generally higher levels of education (weak correlation) (Erro! A origem da referência não foi encontrada.).
Figure 43. Mean years at school per year of birth of patients (left) and per year in time at which diagnosis occurred (right).
Figure 44. Mean number of years at school that patients that were diagnosed at each specific age accomplished.
The number of total years at school is different in our populations of RRMS and PPMS (Figure 45). As we showed before, these populations have different ages at present time: PPMS were born a longer time ago. External social factors not related to MS could then interfere with this result. An analysis controlled for age at present time or for year of birth will have to be performed.
Economic activity and status of employment
Considering the week immediately before inclusion, and according to ICSE-93, 61,5% (n= 345) of our total sample is classified as “economically active population” (Figure 46). 86,51% of these have un employment (or various), 13,49% are unemployed (Figure 47).
Figure 46. Distribution of our total population in terms of economic activity.
Figure 47. Distribution of our total economically active population in terms of employment / unemployment.
In Table 30we show the proportion of economically active and the unemployment rate for all
our sample and for the group “RRMS at inclusion”. Data is shown for a selection of categories of
Older patients, patients with higher EDSS and women show a smaller proportion of economic activity.
Patients currently in RRMS have also a higher proportion of economically active than the whole sample (which, as stated, includes progressive forms). We had seen before that progressive
forms are older at inclusion and have higher EDSS than patients in group RRMS at “inclusion”. This difference in the proportion of economically active patients between the 2 groups is, though, apparent even inside the same age category. This could be related with higher EDSS of patients in progressive forms even inside the same age category.
Rates of unemployment seem higher in women, higher EDSS and higher ages, all classes that already have less economic activity.
All sample RRMS at inclusion
Group N Economically
active Unemployed N
Economically
active Unemployed
All 561 61,5% 13,5% 459 71% 12,7%
All males 164 68,9% 8,9% 131(*) 80,2% 9,3%
All females 397 58,4% 15,7% 328(*) 67,4% 15,7%
All EDSS <=
4.0 404 74,3% 12,5% 388 75,5% 12,4%
All EDSS
4.5-6.0 95 34,7% 12,1% 57 45,6% 11,5%
All EDSS
>=6.5 62 19,4% 45,5% 14 50% 33,3%
Current
Age 20-29 85 82,4% 20,3% 83 83,1% 19,1%
Current
Age 30-39 164 85,4% 14,4% 150 88,7% 13,6%
Current
Age 40-49 131 68,7% 9,0% 113 74,3% 8,4%
Current
Age 50-59 111 31,5% 5,7% 73 41,1% 3,3%
Current
Age 60-69 55 16,4% 22,2% 30 30% 22,2%
(*) RRMS at inclusion females: age 41,2±12,1 years-old, median EDSS 2.0; RRMS at inclusion males: age 39,2±10,1 years-old, median EDSS 2.0.
Table 30. Proportion of economically active and the unemployment rate (in the week before inclusion) for selected categories of our sample and for RRMS at inclusion.
All SPMS at inclusion All PPMS at inclusion Group N Economically
active Unemployed N
Economically
active Unemployed
All 53 17% 44,4% 45 17,8% 12,1%
All males 13 23,1% 0% 19 26,3% 0%
All females 40 15% 66,7% 26 11,5% 33,3%
All EDSS <=
4.0 1 - - 12 41,7% 20%
All EDSS
4.5-6.0 22 18,2% 25% 15 20% 0%
All EDSS
>=6.5 30 16,7% 60% 18 0% -
Current
Age 20-29 1 - - 1 - -
Current
Age 30-39 5 60% 33,3% 7 28,6% 50%
Current
Age 40-49 11 27,3% 33,3% 7 42,9% 0%
Current
Age 50-59 20 10% 50% 17 17,6% 0%
Current
Age 60-69 14 0% - 11 0% -
In view of the low number of patients in many categories, this table should only be interpreted as a general perspective on the subject.
Table 31. Rates of economic activity and uenmployment in SPMS and PPMS patients.
All economically active population
All economically
non-active pop. p
N 345 216 -
Age at inclusion 38,27±9,2 50,4±13,3
p<0,001 (Independent-samples Mann-Whitney U test)
% of females 67,2% 76,4%
p=0,021 (Pearson Chi-Square test, Cochran criteria
verified)
% of RRMS 95% 62,3%
p<0,001 (Pearson Chi-Square test, Cochran criteria
verified).
Years of education 13,57±3,6 9,59±4,7
p<0,001 (Independent-samples Mann-Whitney U test)
Median EDSS (May 2014)
1,5 (P25: 1,0; P75: 3,0)
5,0 (P25: 3,0; P75: 6,0)
p<0,001 (after grouping EDSS into categories, Pearson Chi-Square test, Cochran criteria
Figure 48. Comparison of EDSS (in May 2014) between economically active and non-active patients.
In Table 33 we compare the main characteristics of Active and Non-Active RRMS at inclusion patients. Non active RRMS patients are older, they are more frequently female, they are less educated and they have higher EDSS than their economically active counterparts. More than half of them are under 50 years-old though, a good part of them have a mild to moderate EDSS.
RRMS economically active
RRMS economically
non active p
N 326 134 -
Age at inclusion 38±9,2 47,2±14
p<0,001 (Independent-samples Mann-Whitney U test)
% of females 67,8% 80,5%
p=0,006 (Pearson Chi-Square test, Cochran criteria
verified)
Years of education
(mean) 13,6±3,6 vs 10,1±4,5
p<0,001 (Independent-samples Mann-Whitney U test)
Median EDSS (May
2014) 1,5 3,5
p<0,001 (after grouping EDSS into categories,
Pearson Chi-Square test, Cochran criteria