Low body weight/thinness, overweight and obesity of children and
adolescents from a Brazilian region of low economic status
Baixo peso corporal/magreza, sobrepeso e obesidade de crianças e adolescentes de uma região brasileira de baixo desenvolvimento econômico
Bajo peso corporal/delgadez, sobrepeso y obesidad de niños y adolescentes de una región brasileña de bajo desarrollo económico
Dartagnan Pinto Guedes1, Francisléia Nascimento Almeida2, Jaime Tolentino M. Neto3, Maria de Fátima de M. Maia3, Thatiana Maia Tolentino2
Instituição:Universidade Norte do Paraná (Unopar), Londrina, PR, Brasil
1Centro de Pesquisa em Ciências da Saúde da Unopar, Londrina, PR, Brasil 2Secretaria Municipal de Juventude, Esporte e Lazer de Montes Claros,
Montes Claros, MG, Brasil
3Universidade Estadual de Montes Claros (Unimontes), Montes Claros,
MG, Brasil ABSTRACT
Objective: To assess the prevalence of low body weight/
thinness, overweight and obesity in a representative sample of children and adolescents from a Brazilian region with low economic development.
Methods: A total of 982 girls and 986 boys, aged seven
to 17 years old and assisted by Segundo Tempo Program, from Montes Claros, Minas Gerais, Brazil, were included in the study. Low body weight/thinness, overweight and obesity were defined based on body mass cut-off indexes recommended by the International Obesity Task Force. The prevalence of the nutritional status according to sex and age was compared by chi-square test.
Results: In girls, the frequency of low body
weight/thin-ness, overweight and obesity was 4.1, 18.4 and 3.8%, respec-tively; in boys, these percentages were 6.3, 13.2 and 2.9%, respectively. The low body weight/thinness for girls raised from 2.7% (7–10 years old) to 5.5% (15–17 years old); the body weight excess (overweight and obesity) decreased from 30.1 to 16.2% for the same age groups. In boys, the corre-sponding trends were from 3.2 to 9.4% for low body weight/ thinness, and from 23.4 to 9.2%, for body weight excess.
Conclusions: The data indicate that, even in a region
with low economic status, the body weight excess was the main problem associated with nutritional health. The high
overweight and obesity prevalence rates indicate the need of public policies for promoting healthy feeding behaviors and physical activity.
Key-words: anthropometry; body mass index; nutritional
status; child; adolescent.
RESUMO
Objetivo: Analisar a prevalência de baixo peso corporal/
magreza, sobrepeso e obesidade em amostra representativa de crianças e adolescentes de uma região brasileira de baixo desenvolvimento econômico.
Métodos: Amostra constituída por 982 moças e 986 rapazes,
de sete a 17 anos, assistidos pelo núcleo do Programa Segundo Tempo de Montes Claros, Minas Gerais. Definiram-se baixo peso corporal/magreza, sobrepeso e obesidade pelo índice de massa corpórea, adotando-se os pontos de corte recomendados pela
International Obesity Task Force. Compararam-se as prevalências de sexo e idade pelo teste do qui-quadrado.
Resultados: Nas moças, as prevalências de baixo peso
corpo-ral/magreza, sobrepeso e obesidade foram de 4,1, 18,4 e 3,8%, respectivamente; nos rapazes, foram de 6,3, 13,2 e 2,9%. Nas moças, o índice de baixo peso corporal/magreza aumentou de 2,7 para 5,5% para as faixas etárias de 7–10 e de 15–17 anos, respectivamente; já o excesso de peso corporal (sobrepeso e
Endereço para correspondência: Dartagnan Pinto Guedes
Rua Ildefonso Werner, 177 – Condomínio Royal Golf CEP 86055-545 – Londrina/PR
E-mail: [email protected]
Fonte financiadora: o primeiro autor é bolsista de Produtividade Científica do Conselho Nacional de Desenvolvimento Científico e Tecnológico (CNPq) Conflito de interesse: nada a declarar
obesidade) diminuiu de 30,1 para 16,2%, respectivamente para essas faixas etárias. Nos rapazes, as tendências correspondentes foram de 3,2 para 9,4% para o baixo peso corporal/magreza, e de 23,4 para 9,2% para o excesso de peso corporal.
Conclusões: Os dados apontam que, mesmo em uma
região de baixo desenvolvimento econômico, o excesso de peso corporal foi o principal problema associado ao estado nutricional. A elevada prevalência de sobrepeso e obesidade alerta para a necessidade de políticas públicas direcionadas às práticas de alimentação saudável e de atividade física.
Palavras-chave: antropometria; índice de massa corporal;
estado nutricional; criança; adolescente.
RESUMEN
Objetivo: Analizar la prevalencia de bajo peso corporal/
delgadez, sobrepeso y obesidad en una muestra representa-tiva de niños y adolescentes de una región brasileña de bajo desarrollo económico.
Métodos: Muestra constituida por 982 muchachas y 986
muchachos, de siete a 17 años, por el núcleo del Programa Segundo Tiempo de Montes Claros, Minas Gerais. Se definie-ron bajo peso corporal/delgadez, sobrepeso y obesidad por el índice de masa corporal, adoptándose los puntos de corte reco-mendados por la International Obesity Task Force. Se compararon las prevalencias de sexo y edad por la prueba de chi-cuadrado.
Resultados: En las muchachas, las prevalencias de bajo
peso corporal/delgadez, sobrepeso y obesidad fueron de 4,1, 18,4 y 3,8%, respectivamente; en los muchachos, fueron de 6,3, 13,2 y 2,9%. En las muchachas, el índice de bajo peso corporal/delgadez aumentó de 2,7 para 5,5% para las franjas de edad de siete a 10 y de 15 a 17 años, respectivamente; el exceso de peso corporal (sobrepeso y obesidad), a su vez, redu-jeron de 30,1 para 16,2%, respectivamente, para esas franjas de edad. En los muchachos, las tendencias correspondientes fueron de 3,2 para 9,4% para bajo peso corporal/delgadez, y de 23,4 para 9,2% para el exceso de peso corporal.
Conclusiones: Los datos señalan que, aunque en una
re-gión de bajo desarrollo económico, el exceso de peso corporal fue el principal problema asociado al estado nutricional. Las elevadas prevalencias de sobrepeso y obesidad alertan para la necesidad de políticas públicas dirigidas a las prácticas de alimentación sana y de actividad física.
Palabras clave: antropometría; índice de masa corporal;
estado nutricional; niño; adolescente.
Introduction
Nutrition transition describes the process in which changes are observed over time with regard to dietary and physical activity patterns. Although currently nutri-tional transition has been reaching the entire population, especially developing societies, this process may be distin-guished in terms of moment and intensity of occurrence, according to the epidemiological context being considered. The decrease in the prevalence of low body weight/thin-ness and the increase in the frequency of overweight and obesity, the so-called double burden of malnutrition(1), are
essential characteristics of the nutrition transition process. In this sense, the association between malnutrition, over-weight, obesity, health status and well-being is well docu-mented in the literature. Evidence suggests that malnutri-tion, at younger ages, affects physical growth and cognitive development, favors the onset of infectious diseases, limits physical capacity(2) and, at early adulthood, increases
predis-posing risks for many degenerative diseases(3). On the other
hand, overweight and obesity are known outcomes related to the development of diabetes, heart diseases, osteoarthri-tis, some types of cancer, among other chronic diseases(4).
Overweight and obese youths tend to have a higher incidence of problems related to self-esteem and self-concept, affecting interpersonal relationships(5).
When observing the nutrition transition process in Latin American countries over the past few decades, speciically in Brazil, a signiicant change was found in the prevalence of low body weight/thinness, overweight and obesity. A com-parison of two representative surveys of the young Brazilian population aged from ten to 19 years — the National Study on Family Expenses (Estudo Nacional de Despesa Familiar, Endef), conducted in 1974–1975(6), and the National Family
Budget Survey (Pesquisa Nacional de Orçamentos Familiares, POF), conducted in 2002–2003(7) — shows that, over three
The identiication of possible nutritional inadequacies in speciic segments of the youth population may subsequently provide useful information for the planning of Public Health intervention programs. Thus, this study assessed nutritional status — with a particular focus on the prevalence of low body weight/thinness, overweight and obesity — in a sample of children and adolescents assisted by the Segundo Tempo Program of the Ministry of Sports in the city of Montes Claros, state of Minas Gerais, Brazil.
Method
This is a cross-section study involving youngsters of both genders, aged from seven to 17 years and participating in the Segundo Tempo Program. Data were collected between April and May 2011 and the study intervention protocol was approved by the Research Ethics Committee of Universidade Estadual de Montes Claros (Unimontes).
The city of Montes Claros, the setting of the present study, is located in northern Minas Gerais. Taking the Human Development Index (HDI) as a reference, it can be observed that, over the past two decades, the city has shown signii-cant improvement. However, it still has lower HDI values compared to cities with similar population density and lo-cated in other Brazilian regions, especially in Southeastern and Southern Brazil. In the 1991–2000 period, the HDI for Montes Claros increased by 10%, going from 0.721, in 1991, to 0.783, in 2000. The dimension that contributed the most to this increase was education (0.793 versus 0.872), followed by income (0.629 versus 0.681) and life expectancy (0.741
versus 0.787). In this period, the human development gap, i.e., the distance between the city HDI and HDI maximum score (1-HDI), was reduced by 32%. Mean 2000 HDI for the cities located in Southeastern and Southern Brazil was 0.844 and 0.825, respectively, and the Brazilian 2000 HDI was 0.800(8).
The Segundo Tempo Program is an action undertaken by the National Department of Educational Sport of the Ministry of Sports, which assists youngsters from deprived communities and exposed to social risks. Its activities are mainly directed to sports practice guided by Physical Education professionals and performed during the shift op-posite to the school shift. The Program operates in nearly 1,300 cities distributed all over the Brazilian territory, assisting 800 thousand youngsters. In Montes Claros, the Program assists 2 thousand children and adolescents.
Students were selected for the study by invitation to all participants in the Program from the city of Montes Claros.
However, the following exclusion criteria were adopted: lack of parental or guardian approval; absence in Program activities on the day scheduled for data collection; physical condition that precluded taking anthropometric measure-ments on that occasion. Hence, the study included 1,968 youngsters (982 girls and 986 boys).
Subjects’ chronological age was determined in years and months, based on the comparison between date of data collec-tion and date of birth. However, for analysis purposes, three age groups were established: seven to ten years (171 girls and 237 boys); 11 to 14 years (554 girls and 520 boys); and 15 to 17 years (257 girls and 229 boys). Indicators corresponding to low body weight/thinness, overweight and obesity were determined based on the calculation of the body mass index (BMI), the ratio between body weight, in kilograms, and height, expressed in meters squared (kg/m2), according to
the criteria proposed by the International Obesity Task Force (IOFT)(9,10). This criterion uses cut-off values associated with
BMI for age and sex, estimated from curves for several popula-tion studies, including for the Brazilian populapopula-tion, and that are related to cut-offs for low body weight/thinness, over-weight and obesity in adults (BMI=18.5, 25 and 30kg/m2,
respectively), which are risk markers for morbidity and mortality from non-communicable chronic disorders.
Body weight was determined using an anthropometric scale (Seca, model 879, Hamburg, Germany), with 10g accuracy, measured every ten weightings; height was determined using an aluminum stadiometer (Seca, model 870, Hamburg, Germany), with 1mm scale, based on the procedures presented by the World Health Organization(11). The evaluators’ team comprised
two Physical Education professionals highly experienced in tak-ing anthropometric measurements. As for the quality of data, body weight and height measurements were replicated every ten subjects included in the deinitive study sample. Technical errors of measurement ranged from 30 to 50g for body weight measurements, and from 1 to 5cm for height measurements.
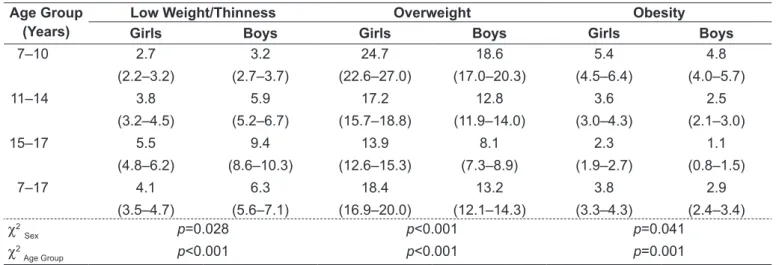
Table 2 - Prevalence and 95% conidence interval of low body weight/thinness, overweight and obesity according to sex and age group
Age Group Low Weight/Thinness Overweight Obesity
(Years) Girls Boys Girls Boys Girls Boys
7–10 11–14 15–17 7–17 2.7 (2.2–3.2) 3.8 (3.2–4.5) 5.5 (4.8–6.2) 4.1 (3.5–4.7) 3.2 (2.7–3.7) 5.9 (5.2–6.7) 9.4 (8.6–10.3) 6.3 (5.6–7.1) 24.7 (22.6–27.0) 17.2 (15.7–18.8) 13.9 (12.6–15.3) 18.4 (16.9–20.0) 18.6 (17.0–20.3) 12.8 (11.9–14.0) 8.1 (7.3–8.9) 13.2 (12.1–14.3) 5.4 (4.5–6.4) 3.6 (3.0–4.3) 2.3 (1.9–2.7) 3.8 (3.3–4.3) 4.8 (4.0–5.7) 2.5 (2.1–3.0) 1.1 (0.8–1.5) 2.9 (2.4–3.4) χ2 Sex χ2 Age Group p=0.028 p<0.001 p<0.001 p<0.001 p=0.041 p=0.001
χ2: chi-square test
frequencies and their respective 95% conidence intervals, according to the cut-offs used. The signiicance test for com-parison of multiple proportions was applied to investigate pos-sible differences in the prevalence between the study groups, through the non-parametric chi-square test.
Results
Table 1 shows information regarding height, body weight and BMI measures that characterized the study sample.
Height and body weight values were similar up to nearly 14 years of age. Afterwards, boys became heavier and taller than girls. As for BMI, values showed growing increase with progressing age; however, these values were similar in both genders.
Table 2 shows the prevalence of low body weight/thin-ness, overweight and obesity stratiied by gender and age. Girls had a lower prevalence of low body weight/thinness (p=0.028) and a signiicantly higher prevalence of overweight and obesity than boys (p<0.001 and p<0.041). For all ages,
Table 1 - Mean values, standard deviation and “F” statistics corresponding to height, body weight and body mass index measures of children and adolescents involved in the study
Age (Years)
Height (cm) Body Weight (kg) BMI (kg/m2)
Girls Boys Girls Boys Girls Boys
7 8 9 10 11 12 13 14 15 16 17
125.12±7.84
131.97±7.77
135.81±7.33
139.35±8.20
145.07±6.94
152.23±6.71
156.25±7.30
160.79±6.06
161.13±6.76
162.08±7.60
162.36±6.83
124.26±7.71
131.25±8.54
135.18±6.23
141.31±8.02
145.39±8.77
149.53±7.12
154.74±8.34
160.18±9.97
168.41±8.42*
171.47±6.83**
173.81±6.42**
26.79±5.48
29.52±6.48
32.85±7.33
34.39±7.69
38.30±7.29
43.31±8.21
46.75±9.90
50.40±8.46
52.90±8.61
53.80±7.86
54.12±8.07
26.00±6.34
28.17±6.23
30.82±7.17
36.17±8.09
39.47±9.23
41.27±8.48
45.21±8.74
49.44±9.07
57.06±8.91*
58.92±8.56*
60.15±9.62**
16.37±3.04
16.98±2.80
17.02±2.78
17.85±3.30
18.14±2.75
18.41±2.52
18.75±3.34
19.11±2.98
20.18±3.24
20.21±3.03
20.34±3.12
16.36±3.44
16.71±3.27
17.08±3.34
17.13±3.35
17.50±3.34
18.08±3.19
18.51±3.89
18.92±3.25
19.21±3.52
21.32±2.71
21.72±2.86 Fage Fsex Finteraction p<0.001 p<0.001 p<0.001 p<0.001 p<0.001 p<0.001 p<0.001 p=0.142 p=0.072
4.1% of girls and 6.3% of boys had low body weight/thin-ness. As for excess body weight, 18.4% of girls and 13.2% of boys were overweight, along with 3.8 and 2.9%, respec-tively, who were obese.
As for age groups, a signiicant increase in the prevalence of low body weight/thinness was observed with age in both genders (p<0.001). In this case, the prevalence of low body weight/thinness among adolescents of both genders included in the 15-17 year age group were approximately two to three times higher (5.5% of girls and 9.4% of boys) compared to their counterparts included in the age group from seven to ten years (2.7 and 3.2%, respectively). On the other hand, as for the prevalence of overweight and obesity, estimates indicated signiicant lower proportions with advancing age (p<0.001 and p=0.001). In the younger group (from seven to ten years), overweight prevalence was 24.7% among girls and 18.6% among boys; in the adolescent group (from 15 to 17 years), these percentages were 13.9 and 8.1%, respectively. Similarly, although in smaller proportions, prevalence of obesity among the youngest subjects was close to 5% in both genders. However, for more advanced ages, it was found that boys showed a more signiicant reduction, with obesity reaching 2.3% of girls and 1.1% of boys in the 15-17 year age group.
Discussion
Based on values corresponding to BMI, the prevalence of low body weight/thinness, overweight and obesity was estimated in a representative sample of children and adolescents assisted by the Segundo Tempo Program of the Ministry of Sports. The results revealed that, using sex- and age-speciic cut-offs recently proposed by the IOFT(9,10), the
estimate of the combined prevalence of excess body weight (overweight and obesity) in the study sample (19.2%) was nearly four times higher than the prevalence of low body weight/thinness (5.2%).
In this sense, the lack of unanimity in the deinition of cut-off points to identify low body weight/thinness, overweight and obesity at younger ages acts as the main barrier to per-form comparative analyses of the different studies available in the literature. However, compared to international data, which also used cut-offs proposed by the IOFT, the preva-lence of low body weight/thinness observed in the present study was lower than that described in the young population of African(12,13) and Asian(14,15) countries but similar to the
prevalence observed in European countries(16,17). With regard
to the prevalence of overweight and obesity, the percentages
we have found were higher than those observed in the young population of African(18,19) and Asian(20,21) countries and were
close to the values described in the youth population of North American and European(22) countries.
As for the comparison with results previously observed in Brazilian studies, few methodological designs involving combined representative samples of children and adolescents from the population segment being considered assessed the prevalence of low body weight/thinness, overweight and obesity using the cut-offs suggested by the IOFT. Because of the few studies susceptible to comparison, it was found that the population segment being analyzed had higher prevalence of low body weight/thinness compared to the survey conducted in Niterói, state of Rio de Janeiro, Brazil (2.7 versus 5.2%)(23). As for the combined prevalence of
overweight and obesity, the frequency found in the present study (19.2%) was close to the values reported in studies conducted in the Brazilian cities of Rio de Janeiro, state of Rio de Janeiro (18%)(24), Pelotas, state of Rio Grande do Sul
(20%)(25), and Florianópolis, state of Santa Catarina (21%)(26).
However, in comparison to investigations involving the young population of capital cities of Northeastern Brazil, the combined prevalence of overweight and obesity reported here was higher than that found in João Pessoa, state of Paraíba (10.5%)(27), and in Recife, state of Pernambuco (13.9%)(28).
The prevalence of low body weight/thinness, overweight and obesity was not equally distributed in the population segment analyzed in the present study. As for gender, if, on one hand, the prevalence of low body weight/thinness was signiicantly higher in boys, on the other hand, girls showed higher percentages when it comes to the prevalence of overweight and obesity. In other studies available in the literature, signiicant differences were also observed in the prevalence of low body weight/thinness(12,14) and
over-weight/obesity(18-22) in both genders.
The differences observed in the prevalence of low body weight/thinness between boys and girls may possibly be explained by sexual speciicities related to biological sensitivity to environmental aggressions, mainly those of nutritional nature. Although the justiications and the mechanisms of this phenomenon are not well deined, Stinson(29) suggests that the male organism would be more
On the other hand, it is suspected that the higher preva-lence of overweight and obesity in girls may be partly ex-plained by the greater susceptibility of the female organism to store greater body fat deposits, which occurs due to sexual hormones at ages close to puberty(30). Differences regarding
physical activity habits may also contribute to the varia-tions in the prevalence of overweight and obesity between genders. At school age, boys showed to be consistently more physically active than girls, both in daily activities and in systematic programs of physical exercise and sports, differ-ences that become more pronounced during adolescence(31).
The increase in the prevalence of low birth weight/thin-ness with progressing age found here may be possibly related to the epidemiological transition that has been more recently observed in developing Brazilian regions. Speciically in Northern Minas Gerais state, where the target population of the present study lives, social and infrastructure advances in public services, mainly in the education and health sectors, associated with assistance and income transfer programs, may contribute to the improved weight proile of younger individuals compared to their older counterparts, consider-ing that, a decade ago, period when current adolescents were children, there were almost no such initiatives, which has a strong impact on the deinition of their future body weight. This phenomenon was similarly observed in the young population of other Brazilian regions(32,33) and in
African countries(34), signiicantly changing the trend in the
prevalence of low birth weight/thinness.
Thus, low body weight/thinness, which was an important concern in past decades in the Brazilian pediatric population(35),
seems to be a nutritional issue that is about to be overcome in the population segment being analyzed, since, according to the statistical criteria adopted for the epidemiological classiication of nutritional deicit, a prevalence of up to 2.5% is acceptable in populations with good nutritional status(11). At the ages
from seven to ten years, the prevalence of body weight deicit/ thinness in the present study was 2.7 and 3.2% in girls and boys, respectively, being thus very similar to the acceptable percentage. However, while there are indications of a possible control of the occurrence of low body weight/thinness, it was
References
1. Popkin BM. Urbanization, lifestyle changes and the nutrition transition. World Dev 1999;27:1905-16.
2. Best C, Neufingerl N, van Geel L, van den Briel T, Osendarp S. The nutritional status of school-aged children: why should we care? Food Nutr Bull 2010;31:400-17.
3. Flegal KM, Graubard BI, Williamson DF, Gail MH. Excess deaths associated with underweight, overweight, and obesity. JAMA 2005;293:1861-7. 4. Park MH, Falconer C, Viner RM, Kinra S. The impact of childhood obesity
on morbidity and mortality in adulthood: a systematic review. Obes Rev 2012;13:985-1000.
found that the presence of excess body weight reached alarm-ing proportions, since one out of ive youngsters analyzed in the study were overweight or obese (19.2%), pointing out the need for urgent prevention and control actions.
Among the main limitations of the study, one of the most important is the procedure used to select the sample. Because it was a speciic population group, i.e., participants in the Segundo Tempo Program, there are restrictions when to comes to generalizing the results for the entire young population. However, given the reach of the Program throughout the country and the greater size of the selected sample, the results we have found probably depict satisfactorily the prevalence of low body weight/thinness, overweight and obesity and its distribution according to sex and age in the young popula-tion of Montes Claros. Similarly, the cross-secpopula-tional design of the study prevents the establishment of causal effects on the outcomes related to body weight and advancing age.
Thus, the information obtained in the study points out that, although it is a population segment integrated in a region of low economic development and with low social indicators, excess body weight was the main problem as-sociated with nutritional status. The high prevalence of overweight and obesity reported here warns about the urgent need of public policies for health promotion, especially those directed to healthy eating habits and physical activity.
5. Kiess W, Galler A, Reich A, Müller G, Kapellen T, Deutscher J et al. Clinical
aspects of obesity in childhood and adolescence. Obes Rev 2001;2:29-36. 6. Brasil - Instituto Brasileiro de Geograia e Estatística [homepage on the Internet].
Estudo Nacional de Despesa Familiar. Dados preliminares. Consumo alimentar - Antropometria. Rio de Janeiro: IBGE; 1977 [cited 2013 Jun 20]. Available from: http://biblioteca.ibge.gov.br/visualizacao/monografias/GEBIS%20-%20RJ/ ConsumoAlimentar/v1%20t1%20-%20Parte%204%20-%20DF,%20RO,%20 AC,%20AM,%20RR,%20PA,%20AM,%20GO%20e%20MT.pdf
7. Brasil - Instituto Brasileiro de Geograia e Estatística. Pesquisa de orçamentos familiares 2008-2009: antropometria e estado nutricional de crianças, adolescentes e adultos no Brasil. Rio de Janeiro: IBGE; 2010.
8. Programa das Nações Unidas para o Desenvolvimento [homepage on the Internet]. Atlas de Desenvolvimento Humano 2003. Ranking do IDH dos Municípios do Brasil 2003. Brasília: PNUD; 2003 [cited 2013 Jul 10]. Available from: http://www.pnud.org.br/atlas/ranking/IDH_Municipios_Brasil_2000. aspx?indiceAccordion=1&li=li_Ranking2003
9. Cole TJ, Bellizzi MC, Flegal KM, Dietz WH. Establishing a standard deinition for child overweight and obesity worldwide: international survey. BMJ 2000;320:1240-3.
10. Cole TJ, Flegal KM, Nicholls D, Jackson AA. Body mass index cut-offs to deine thinness in children and adolescents: international survey. BMJ 2007;335:194-7. 11. World Health Organization. Physical status: the use and interpretation of
anthropometry. Report of a WHO Expert Committee. [Technical Report Series nº 854]. Geneva: WHO; 1995.
12. Bovet P, Kizirian N, Madeleine G, Blössner M, Chiolero A. Prevalence of thinness in children and adolescents in the Seychelles: comparison of two international growth references. Nutr J 2011;10:65.
13. Caleyachetty R, Rudnicka AR, Echouffo-Tcheugui JB, Siegel KR, Richards N, Whincup PH. Prevalence of overweight, obesity and thinness in 9-10 year old children in Mauritius. Global Health 2012;8:28.
14. Kelishadi R, Ardalan G, Gheiratmand R, Majdzadeh R, Hosseini M, Gouya MM
et al. Thinness, overweight and obesity in a national sample of Iranian children
and adolescents: CASPIAN Study. Child Care Health Dev 2008;34:44-54. 15. Bisai S, Ghosh T, Kumar De G, Bose K. Very high prevalence of thinness
among Kora-Mudi tribal children of Paschim Medinipur district of West Bengal, India. EJBS 2010;3:43-9.
16. Lazzeri G, Rossi S, Pammolli A, Pilato V, Pozzi T, Giacchi MV. Underweight and overweight among children and adolescents in Tuscany (Italy). Prevalence and short-term trends. Prevalence and short-term trends. J Prev Med Hyg 2008;49:13-21.
17. Marques-Vidal P, Ferreira R, Oliveira JM, Paccaud F. Is thinness more prevalent than obesity in Portuguese adolescents? Clin Nutr 2008;27:531-6. 18. Ben-Bassey UP, Oduwole AO, Ogundipe OO. Prevalence of overweight and
obesity in Eti-Osa LGA, Lagos, Nigeria. Obes Rev 2007;8:475-9.
19. Armstrong ME, Lambert MI, Sharwood KA, Lambert EV. Obesity and overweight in South African primary school children – The Health of the Nation Study. S Afr Med J 2006;96:439-44.
20. Laxmaiah A, Nagalla B, Vijayaraghavan K, Nair M. Factors affecting prevalence of overweight among 12- to 17-year-old urban adolescents in Hyderabad-India. Obesity (Silver Spring) 2007;15:1384-90.
21. Xie B, Chou CP, Spruijt-Metz D, Reynolds K, Clark F, Palmer PH et al. Socio-demographic and economic correlates of overweight status in Chinese adolescents. Am J Health Behav 2007;31:339-52.
22. Janssen I, Katzmarzyk PT, Boyce WF, Vereecken C, Mulvihill C, Roberts C et al. Comparison of overweight and obesity prevalence in school-aged youth
from 34 countries and their relationships with physical activity and dietary patterns. Obes Rev 2005;6:123-32.
23. Gomes Fda S, Anjos LA, Vasconcellos MT. Inluence of different body mass index cut-off values in assessing the nutritional status of adolescents in a household survey. Cad Saude Publica 2009;25:1850-7.
24. Anjos LA, Castro IR, Engstrom EM, Azevedo AM. Growth and nutritional status in a probabilistic sample of schoolchildren from Rio de Janeiro, 1999. Cad Saude Publica 2003;19 (Suppl 1):S171-9.
25. Vieira MF, Araújo CL, Neutzling MB, Hallal PC, Menezes AM. Diagnosis of overweight and obesity in adolescentes from the 1993 Pelotas birth cohort study, Rio Grande do Sul state, Brazil: comparison of two diagnostic criteria. Cad Saude Publica 2007;23:2993-9.
26. Bernardo Cde O, Vasconcelos Fde A. Association of parents’ nutritional status, and sociodemographic and dietary factors with overweight/obesity in schoolchildren 7 to 14 years old. Cad Saude Publica 2012;28:291-304. 27. Farias Júnior JC, Silva KS. Overweight/obesity in adolescente students
from the city of João Pessoa, PB, Brazil: prevalence and association with demographic and socioeconomic factors. Rev Bras Med Esporte 2008;14:104-8.
28. Tassitano RM, Barros MV, Tenório MC, Bezerra J, Hallal PC. Prevalence of overweight and obesity and associated factors among public high school students in Pernambuco state, Brazil. Cad Saude Publica 2009; 25:2639-52.
29. Stinson S. Sex differences in environmental sensitivity during growth and development. Am J Phys Anthrop 1985;28:123-47.
30. Malina RM, Bouchard C, Bar-Or O. Growth, maturation, and physical activity. 2nd ed. Champaign: Human Kinetics; 2004.
31. Ferreira I, van der Horst K, Wendel-Vos W, Kremers S, van Lenthe FJ, Brug J. Environmental correlates of physical activity in youth: a review and update. Obes Rev 2006;8:129-54.
32. Guedes DP, de Matos JA, Lopes VP, Ferreirinha JE, Silva AJ. Physical growth of schoolchildren from the Jequitinhonha Valley, Minas Gerais, Brazil: comparison with the CDC-2000 reference using the LMS method. Ann Hum Biol 2010;37:574-84.
33. Guedes DP, Rocha GD, Silva AJ, Carvalhal IM, Coelho EM. Effects of social and environmental determinants on overweight and obesity among Brazilian schoolchildren from a developing region. Rev Panam Salud Publica 2011;30:295-302.
34. Prista A, Maia JA, Damasceno A, Beunen G. Anthropometric indicators of nutritional status: implications for itness, activity, and health in school-age children and adolescents from Maputo, Mozambique. Am J Clin Nutr 2003;77:952-9.