Genome-wide identi
fi
cation of novel microRNAs and their target genes in the human
parasite
Schistosoma mansoni
Matheus de Souza Gomes
a,b,1, Mohan Kumar Muniyappa
a,1, Sávio Gonçalves Carvalho
b,
Renata Guerra-Sá
b, Charles Spillane
a,⁎
aGenetics and Biotechnology Lab, Centre for Chromosome Biology, C306 Aras de Brun, National University of Ireland Galway, Galway, Ireland
bBiochemistry and Molecular Biology Lab, Department of Biological Sciences, DECBI-NUPEB, Federal University of Ouro Preto, Ouro Preto, Minas Gerais, Brazil
a b s t r a c t
a r t i c l e
i n f o
Article history:
Received 3 April 2011 Accepted 17 May 2011 Available online 26 May 2011
Keywords: microRNA Schistosoma mansoni Parasite miRNA target Bioinformatics
Mature microRNAs (miRNAs) are small, non-coding regulatory RNAs which can elicit post-transcriptional repression of mRNA levels of target genes. Here, we report the identification of 67 mature and 42 precursor miRNAs in theSchistosoma mansoniparasite. The evolutionarily conservedS. mansonimiRNAs consisted of 26 precursor miRNAs and 35 mature miRNAs, while we identified 16 precursor miRNAs and 32 mature miRNAs that displayed no conservation. TheseS. mansonimiRNAs are located on seven autosomal chromosomes and a sex (W) chromosome. miRNA expansion through gene duplication was suggested for at least two miRNA families miR-71 and mir-2. miRNA targetfinding analysis identified 389 predicted mRNA targets for the identified miRNAs and suggests that the sma-mir-71 may be involved in female sexual maturation. Given the important roles of miRNAs in animals, the identification and characterization of miRNAs inS. mansoniwill facilitate novel approaches towards prevention and treatment of Schistosomiasis.
© 2011 Published by Elsevier Inc.
1. Introduction
MicroRNAs (miRNAs) are small non-coding regulatory RNAs that can direct post-transcriptional repression of mRNA levels from genes containing miRNA targets. In animals, miRNAs have diverse biological functions including regulation of key aspects of development and life cycles[1]. Mature miRNAs are single-stranded RNA molecules of ~22 nt in length processed from a precursor molecule (pre-miRNA)[2]. To regulate protein-coding genes the mature miRNA binds with imperfect complementarity to sites in the 3′UTR leading to mRNA degradation or inhibition of translation[1]. MicroRNAs are widely found in unicellular and multicellular organisms, including animals, plants, fungi and protists[3–7]. To date, 17,341 mature miRNAs have been identified in 142 species in miRBase (http://www.mirbase.org/)[8].
Several strategies have been used to identify miRNAs and their targets in a range of organisms[9,10]. The identification of miRNAs and their targets are typically based on experimental and/or computational approaches [9–11]. Experimental approaches for detection of miRNAs (based on molecular cloning and sequencing) can be technically challenging, particularly for miRNAs which are transcribed in specific conditions or different cell types [12]. Computational approaches are also used to identify novel miRNAs. For instance, about half of miRBase pre-miRNA/miRNA pairs have
been found solely byin silicostrategies[8]. Computational approaches can be applied to genome sequences or to transcripts. For instance, several miRNAs have been identified in human EST databases[13]. A range of bioinformatic approaches for miRNA detection can be applied, including homology searching, genome and evolutionary comparisons, and also support vector machines (SVMs) based on a set of key input features associated with miRNAs (e.g. minimum free energy of the hairpin structure (MFE), stability of the precursor compared with other RNAs)[10,14,15].
To date, within theSchistosomagenus parasite genomes, only 60 miRNAs have been identified and deposited in the miRBase database (i.e. 5Schistosoma mansoni miRNAs and 55Schistosoma japonicum miRNAs) [16–21]. The genus Schistosoma includes species like S. mansoni,S. japonicumandS. haematobiumwhich are the major causes of human Schistosomiasis, one of the most widespread and serious parasitic diseases in tropical and subtropical regions. However, very few studies have been conducted to investigate miRNAs and miRNA pathway inS. mansoni[16,22–24].
In this study, we used a computational approach to identify novel miRNAs and miRNA gene targets in the S. mansoni genome. We identify two classes of novelS. mansonimiRNAs, namely miRNAs that are evolutionarily conserved and miRNAs that are not conserved and conduct an evolutionary characterization of these miRNAs. Our analysis also highlighted a potential role for duplicate genes on gene clusters which may be involved in extensive regulation of many miRNA target genes, including possibly genes involved in sex-specific functions.
Genomics 98 (2011) 96–111
⁎ Corresponding author. Fax: +353 91 494535.
E-mail address:charles.spillane@nuigalway.ie(C. Spillane).
1These authors contributed equally to this work.
0888-7543/$–see front matter © 2011 Published by Elsevier Inc. doi:10.1016/j.ygeno.2011.05.007
Contents lists available atScienceDirect
Genomics
2. Results and discussion
2.1. Identification of conserved and non-conserved miRNAs in S. mansoni genome
To identify novel miRNAs within the S. mansoni genome, we developed an integrated whole-genome computational approach which identified conserved and non-conserved miRNAs (including novel miRNAs) from genome and EST databases of theS. mansoni parasite. To identify candidate hairpin-like sequences (with putative stem-loop structures) in theS. mansonigenome, ~30,000 ESTs and 885 supercontigs were screened using (a) the einverted EMBOSS (to identify hairpins) and (b) BLASTn tools (to identify pre-miRNA homologs from miRBase). This allowed us to identify ~1,300,000 hairpin-like sequences which were used as the basis to predict (a) conserved miRNAs and (b) non-conserved miRNAs (Fig. 1).
To identify miRNAs which are conserved within other animal genomes, the secondary structure of the ~1,300,000 hairpin candi-dates was predicted using RNAfold and sequences retained which had MFEb−20 kcal/mol[25]. The retained sequences were thenfiltered for GC content (retaining 30 to 65% CG content) and used for BLASTN against 13,278 animal mature miRNAs. The sequences displaying 85% of identity with known animal mature miRNA were retained. In the next three steps, hairpin candidate sequences were discarded which displayed high similarity with protein-coding genes, non-coding RNA (ncRNAs), and repetitive elements. Each of these three classes of loci can form structures similar to pre-miRNA (hairpin-like sequence) and hence their removal is an essential step to avoid false positives. Finally, a machine-learning algorithm, miPred, was used to classify the putative precursor miRNA sequences based on features of miRNAs, and retained precursor miRNAs that were most likely to be real[26]. To identify miRNAs which are not-conserved with other animal genomes a similar approach based on the 1,300,000 candidate hairpins was employed. In this approach, we retained only the sequences which were found in both theS. mansoniEST database andS. mansonigenome databases. The secondary structure of the retained sequences was predicted using RNAfold and sequences which had MFE higher than −20 kcal/mol were discarded [25]. The lineage-specific retained sequences were alsofiltered for GC content (retaining 30 to 65%) and used to discard sequences with high identity with ncRNAs, protein-coding genes and repetitive elements. miPred was used to predict the most likely precursor miRNAs and the retained sequences were then fed into the miRNA MatureBayes web tool to identify the mature miRNAs within these novel lineage-specific precursors.
Overall, our conservedS. mansonimiRNA pipeline identified 26 conserved pre-miRNAs and 35 mature miRNAs and our non-conservedS. mansoni miRNA pipeline identified 16 conserved pre-miRNAs and 32 mature pre-miRNAs. These numbers ofS. mansonimiRNAs identified concurred with the number (i.e. 55) ofS. japonicummiRNAs deposited in miRBase to date (Version 16.0). To date, most of the miRBase depositedS. japonicummiRNAs are species-specific showing no homologs in other species[8,21]. We have also compared any overlap between the 67 miRNAs identified in this study and those identified previously by Simoes et al. (2011), and found that an overlap of 7 miRNAs between the two datasets (Supplementary Table 4) [23]. Copeland (2009) has suggested that the low number of conserved S. mansoni miRNAs compared with that of Schmidtea mediterranea could possibly be due to the parasitic lifestyle of S. mansoni[16]. Our identification of non-conserved (possibly species-specific) miRNAs may also be associated with the parasitic lifestyle of S. mansoni.
2.2. Characterization of the S. mansoni mature miRNAs
Previous studies have reported that uracil is the predominant nucleotide in thefirst 5′-nucleotide position of the mature miRNA and
may play an important role in recognition of the miRNA by the RISC complex (RNA-induced silencing complex) [27,28]. To determine whetherS. mansonimature miRNAs also displayed this characteristic we investigated the extent to which the uracil nucleotide was present in thefirst 5′-nucleotide position of theS. mansonimature miRNAs. Our results indicate that over half of the matureS. mansonimiRNAs (i.e. 54%) have the uracil at thefirst position (Table 1;Supplementary Fig. 10). Our results also indicate that while some nucleotide positions (e.g. 10–13, 18, 20) display almost equal frequencies of each nucleotide, nucleotides 1–9 (i.e. the seed region), 14–17, 19 and 21 display different frequencies of each nucleotide (Supplementary Fig. 10).
Mature miRNAs can be processed from the 5′or 3′arms of the precursor miRNA molecule. Our results indicate that amongthe S. mansoni miRNAs we identified, there were 16 conserved mature miRNAs in 5′arm of the precursor miRNA, while there were 19 in the 3′arm. For the non-conserved miRNAs it was 16 in both arms.
Like protein-coding genes miRNA genes undergo gene duplica-tions and expansions (or contracduplica-tions) in different lineages. Among the conserved mature miRNAs identified inS. mansoni, 29 are grouped into 16 different families in miRBase based on mature and seed sequence identity (Table 1). The size of the miRNA families in theS. mansonigenome ranged from 1 to 9 members. The highest number of miRNAs (i.e. 9) in any one family inS. mansonibelongs to the mir-2 family. All of the conserved mature miRNAs presented 100% identity in the seed region, between the second and eighth nucleotides, and displayed a maximum of 3 mismatches in the whole mature sequence in comparison with their respective orthologs. Among the conserved mature miRNAs, 29 miRNAs showed high levels of sequence similarity with S. japonicum in some cases 100% of identity, for instance S. mansonimiRNA sma-mir-8-3p compared withS. japonicummiRNA sja-mir-8-3p (Fig. 2).
2.3. Characterization of S. mansoni precursor miRNAs
The total number ofS. mansoniprecursor miRNAs identified was 26 conserved and 16 non-conserved. The conserved miRNA pre-cursors were found only in the genome database, while the non-conserved miRNA precursors were found in both the genome and EST databases (Table 2). Previous studies have shown that specific features of precursor miRNAs can provide information of use tofind conserved and non-conserved miRNAs[6,26,29]. In our study, some features such as Minimal Free Energy (MFE), Adjusted Minimal Free Energy (AMFE), Minimal Free Energy Index (MFEI), GC content, Minimal Free Energy of the thermodynamic ensemble (MFEE), Ensemble Diversity (Diversity), and frequency of the MFE structure in the ensemble (Frequency) were used for comparative analysis between 400 pre-miRNAs from Lophotrochozoa species and the S. mansonimiRNAs identified in this study (Supplementary material Table 3). For all of the features tested there was no statistical difference betweenS. mansonimiRNAs andLophotrochozoamiRNAs (see Supplementary material—Table 3). For instance, the length ofS. mansoniandLophotrochozoaprecursors each varied from 66 to 121 nt (S. mansoni) and 57 to 153 (Lophotrochozoa) with an average of 87 and 90, respectively. Similar precursor length values have been reported for animal precursor miRNAs by Zhou[30]. All precursors identified in our study could fold into stem-loop structures. The MFE for each sequence was measured and averaged−32.06 (kcal/mol) for S. mansoniand−31.27 (kcal/mol) forLophotrochozoa. The GC content of the precursors was also similar when both groups of precursors were compared. Overall, these results demonstrate that the precursor features ofS. mansoniandLophotrochozoamiRNA genes are similar (Supplementary material Table 3). Each of the above features were plotted usingS. mansoniprecursor miRNAs against precursor miRNAs from 77 Animals, 74 Bilateria, 30 Ecdysozoa, 37 Deuterostome, 7 Lophotrochozoaspecies, includingS. japonicum(seeSupplementary material—Figs. 1–8).
97
Fig. 1.Flowchart of computational identification of conserved and non-conserved miRNA genes inS. mansoni.
2.4. Overall distribution of miRNA genes in the S. mansoni genome
In theS. mansonigenome, miRNA genes were distributed across all genome regions including intergenic (30 miRNAs), intronic (11 miRNAs), as well as one miRNA, sma-mir-novel_02, in 3′UTR region (Table 2). As all CDS were excluded from the analysis, we did not screen for the presence of miRNAs in CDS regions. The presence of miRNA genes in intronic regions has been reported in earlier studies [13,31]. All of theS. mansonimiRNA identified were present in one copy in the genome (i.e. not duplicated).
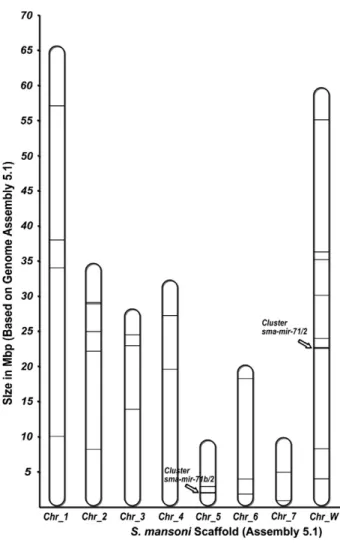
In terms of their chromosomal distribution, theS. mansonimiRNAs were distributed across all 7 autosomal chromosomes and one sex chromosome (W) (Fig. 3).Fig. 3shows the position of each miRNA on the chromosome scaffold deposited i.e. Assembly 5.1 (GeneDB). Some miRNAs were located in sequence not assembled on a chromosome scaffold and these are not indicated inFig. 3. Eleven miRNAs were found on the sex chromosome W, while none was identified on the Z chromosome. By comparison, the last released repertoire of human miRNAs deposited in miRBase has reported about 9% of all miRNAs localizing on the human X chromosome and none on the Y chromosome [8]. Recent study has revealed higher densities of miRNAs on the X chromosome compared to the average densities on autosomes in eight mammalian species. It also has indicated that miRNAs on the human X chromosome are transcribed and processed during gametogenesis suggesting possibly important functions of X-linked miRNAs in humans[32].
2.5. Analysis of conserved S. mansoni miRNAs
This study identifies 26 conserved pre-miRNAs, 19 of which belong to miRNA families found within the Deuterostome and Protostome clades (Fig. 4). Sempere (2010) has demonstrated that the taxonomic distribution of miRNAs is correlated with the broad-scale of taxonomic hierarchy of animal relationship[33]. The phylogenetic and alignment analysis of the mir-8 (Figs. 2a and b), mir-10 (Figs. 5a and b) and mir-71 (Figs. 6a and b) families from theLophotrochozoa, Ecdysozoa, and Deuterostome clades (includingS. mansoni) in general demonstrate that theS. mansonimiRNAs group well according to the species taxonomy. The sma-mir-190 gene, located in the intron of the talingene (Smp_037860), showed a conserved distribution in relation to Bilateria species.
2.5.1. S. mansoni mir-190
The mir-190 gene has previously been found in the intronic region of the talin gene in Homo sapiens, Lottia gigantea, Branchiostoma floridae,Nematostella vectensisandMonosiga brevicollis[34]. This gene structure has been conserved across a large phylogenetic distance, from the choanoflagellate, M. brevicollis to humans. Campo-Paysaa (2011) has reported mir-190 as a Bilateria-specific miRNA because in non-Bilaterians, althoughtalingene structure is present, miR-190 is not present in thetalingene intron nor anywhere in the genome[34]. In concordance, our analysis indicates that sma-mir-190 is located within putativetalin gene structure between exons 7 and 8 in S. mansoni. TheS. mansonimir-190 precursor displayed 90% sequence identity withS. japonicum, and 100% identity with the mature miRNA sequence ofS. japonicum.
2.5.2. S. mansoni mir-8
Version 16 of miRBase indicates that the mir-8 family contains 4 members: 8, 429, 200 and 141. In this study, mir-8 orthologs are found only in the Lophotrochozoa and Ecdysozoa species, includingS. mansoni. On the other hand, mir-429, mir-200 and mir-141 were found only in Deuterostome species (Fig. 2a). These findings are in agreement with Sempere's (2010)findings that mir-8 is Protostome-specific, and that 141 and miR-200 are specific to Deuterostomes [33]. It has been shown mir-8 family clusters are
specific to chordate clades (including mir-200, mir-141 and mir-429) [34]. The sma-mir-8 was also found in the Platyhelminthes clade (Fig. 2a). Alignment of mir-8 orthologs confirmed the conservation amongLophotrochozoaandEcdysozoaspecies (Fig. 2b). The alignment identified conserved nucleotides among different species in mature sequences (on 5p and 3p arms of the precursor), especially in the seed region between second to eight nucleotides (Fig. 2b).
2.5.3. S. mansoni mir-10
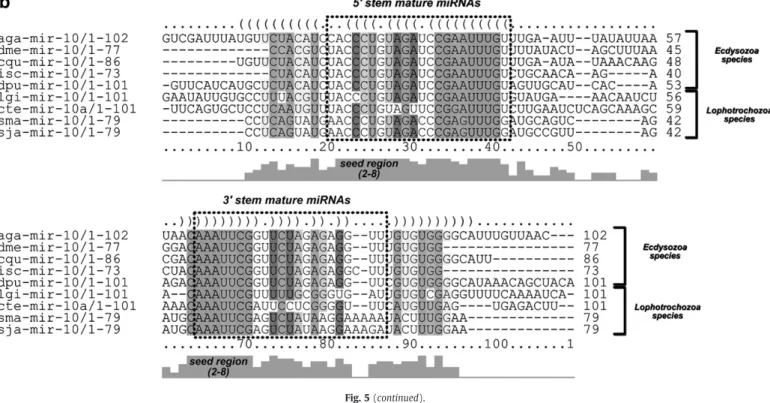
mir-10 family members are found in almost all animal species deposited in miRBase (Version 16). In this study, we found that sma-mir-10 grouped inLophotrochozoa branch betweenEcdysozoa and Deuterostome species (Fig. 5a). The miR-10 gene is found in the Hox clusters of most Bilateria species (includingflies and humans) that has two mir-10 genes and four HOX clusters[34,35]. InS. mansoni, the sma-mir-10 was found 70 kb downstream ofSmHox4(Smp_166140), one of the 4 HOX genes found in the parasite genome[36,37]. The reduced number of Hox genes inS. mansoniwhen compared to other Lophotrochozoans is correlated with its axial architectural simplicity [35]. Alignment between Lophotrochozoa and Ecdysozoa mir-10 precursors demonstrated high conservation between sma-mir-10 and its orthologs, mainly in the seed (5′2–8 nucleotides) regions of sma-mir-10-5p and sma-mir-10-3p (Fig. 5b).
2.6. Duplications of S. mansoni mir-71 and mir-2 microRNAs
InS. mansoni, there are two duplicates of mir-71. Phylogenetic analysis showed that sma-mir-71 is closer to sme-mir-71c (S. mediterranea) and sja-mir-71 (S. japonicum), both Platyhelminthes species. The phylogenetic analysis also showed that sma-mir-71b was found in the same branch of sja-mir-71b, but between the branches of Ecdysozoaspecies andDeuterostomespecies (Fig. 6a). Platyhelminthes speciesS. mediterraneaandS. japonicumshowed similar mir-71 family duplication consisting of 4 and 2 paralogs, respectively (Fig. 6a). Both sma-mir-71 and sma-mir-71b showed high similarity with their orthologs inEcdysozoaandLophotrochozoaspecies, as well as a high percentage of seed region identity between these twoS. mansoni paralogs (Fig. 6b). Overall, this could suggest that the duplication event that led to the genesis of the mir-71 duplicates occurred prior to the divergence of these Platyhelminthes species.
The mir-2 family members were also duplicated and were found in almost allLophotrochozoaandEcdysozoaspecies (Fig. 4). The number of copies and similarity between the mir-2 paralogs are different across the species tested (data not shown). InS. mansoni sma-mir-2b-3p, sma-mir-2c-sma-mir-2b-3p, sma-mir-2d-3p and sma-mir-2b-3p had high levels similarity among their sequences mainly in the seed region with 100% of identity.
2.7. The mir-71/2 and mir-71b/2 miRNA clusters in S. mansoni
miRNA gene clusters have been already reported in the genomes of mice, humans and many other species,[38,39]. Precursor miRNAs are considered grouped in clusters if they are found in the same orientation on the genome, and less than 10 kb from each other on the same scaffold. Using these criteria, sevenS. mansoniprecursors can be identified that may be part of two polycistronic transcripts. One miRNA cluster was detected which contained 4 miRNAs i.e. in the following order sma-mir-71, sma-mir-2a, sma-mir-2b, sma-mir-2e. The other miRNA cluster and contained 3 miRNAs, namely sma-mir-71b, sma-mir-2c, and sma-mir-2d (Fig. 6c). Both of these miRNA clusters contain one mir-71 and at least one mir-2 with similar gene order organization in different species from Ecdysozoaand Lopho-trochozoa(data not shown). The same miRNA cluster organization has also been demonstrated in S. japonicum[17,18]. These S. mansoni miRNA clusters were found in different chromosomes and orienta-tions, i.e. the mir-71/2 cluster was located on the W sex chromosome
99
Table 1
Conserved and non-conservedS. mansonimature miRNAs.
mirNA ID Location Length Mature sequences (5′to 3′) Seed (2–8)
Accession gene family Query miRNAs No. of targets
Target (best hit in miRanda)
sma-bantam 3′ 22 UGAGAUCGCGAUUAAAGCUGGU GAGAUCG MIPF0000153; bantam sja-bantam 4 Ribonucleoprotein (hnrnp), putative (Smp_179270.2) sma-let-7 5′ 21 GGAGGUAGUUCGUUGUGUGGU GAGGUAG MIPF0000002; let-7 sja-let-7 9 Lar interacting protein (lip)-related protein (Smp_149910) sma-mir-10-3p 3′ 23 AAAUUCGAGUCUAUAAGGAAAAA AAUUCGA MIPF0000033; mir-10 sja-miR-10-3p 0 N/A
sma-mir-10-5p 5′ 22 AACCCUGUAGACCCGAGUUUGG ACCCUGU MIPF0000033; mir-10 sja-miR-10-5p 4 Hypothetical protein (Smp_177580) sma-mir-124-3p 3′ 21 UAAGGCACGCGGUGAAUGUCA AAGGCAC MIPF0000021; mir-124 sja-miR-124-3p 16 Ferritin, putative (Smp_047660)
sma-mir-124-5p 5′ 25 CCAUUUUCCGCGAUUGCCUUGAUGA CAUUUUC MIPF0000021; mir-124 sja-miR-124-5p 6 Dihydropyridine-sensitive l-type calcium channel, putative (Smp_124530)
sma-mir-125a 5′ 22 UCCCUGAGACCCUUUGAUUGCC CCCUGAG MIPF0000733; mir-125_2 sja-miR-125a 5 Expressed protein (Smp_114220) sma-mir-190-3p 3′ 20 CAGUGACCAGACAUAUCCCU AGUGACC MIPF0000076; mir-190 sja-miR-190-3p 2 Expressed protein (Smp_062620.1)
sma-mir-190-5p 5′ 23 UGAUAUGUAUGGGUUACUUGGUG GAUAUGU MIPF0000076; mir-190 sja-miR-190-5p 10 Multiple pdz domain protein, putative (Smp_154490) sma-mir-212 3′ 21 UAACAGUCUACAGUCAUGGAU AACAGUC MIPF0000065; mir-132 dre-miR-212 6 Expressed protein (Smp_084620)
sma-mir-2162-3p 3′ 21 UAUUAUGCAACGUUUCACUCU AUUAUGC N/A sja-miR-2162-3p 0 N/A
sma-mir-250 3′ 22 CCUUCAGUUGACUCAUGAUCUC CUUCAGU MIPF0000283; mir-250 crm-miR-250* 1 Ap endonuclease, putative (Smp_167500)
sma-mir-281 3′ 22 UGUCAUGGAGUUGCUCUCUAUA GUCAUGG MIPF0000087; mir-46 cte-miR-281 1 TGF-beta signal transducer Smad2, putative (Smp_085910) sma-mir-2a-3p 3′ 22 UCACAGCCAGUAUUGAUGAACG CACAGCC MIPF0000049; mir-2 sja-miR-2a-3p 22 Serine palmitoyltransferase 1 (Smp_028080)
sma-mir-2a-5p 5′ 22 CAGUCAAUAUUGGCUGAAGGCA AGUCAAU MIPF0000049; mir-2 sja-miR-2a-5p 10 Expressed protein (Smp_080370.1) sma-mir-2b-3p 3′ 24 UAUCACAGCCCUGCUUGGGACACA AUCACAG MIPF0000049; mir-2 sja-miR-2b-3p 29 Tropomyosin, putative (Smp_031770.15) sma-mir-2b-5p 5′ 22 CGUCUCAAGGGACUGUGAAACA GUCUCAA MIPF0000049; mir-2 sja-miR-2b-5p 6 Expressed protein (Smp_041050.2) sma-mir-2c-3p 3′ 22 UAUCACAGCCGUGCUUAAGGGC AUCACAG MIPF0000049; mir-2 sja-miR-2c-3p 21 Kinase (Smp_086690)
sma-mir-2c-5p 5′ 22 UCCCUUGUUCGACUGUGAUGUG CCCUUGU MIPF0000049; mir-2 sja-miR-2c-5p 5 Camp-regulated phosphoprotein, putative (Smp_090150.1) sma-mir-2d-3p 3′ 22 UAUCACAGUCCUGCUUAGGUGA AUCACAG MIPF0000049; mir-2 sja-miR-2d-3p 24 Cytoplasmic dynein light chain, putative (Smp_051400) sma-mir-2e-3p 3′ 21 UAUCACAGUCCAAGCUUUGGU AUCACAG MIPF0000049; mir-2 sja-miR-2e-3p 16 Expressed protein (Smp_127690)
sma-mir-2e-5p 5′ 21 UACCAACUUUGACUGAGUUAU ACCAACU MIPF0000049; mir-2 sja-miR-2e-5p 3 Expressed protein (Smp_006840)
sma-mir-3011 5′ 22 UUGAUUUUAGGGAAUUAUUUAC UGAUUUU N/A hma-miR-3011 2 Camp-regulated phosphoprotein, putative (Smp_090150.1) sma-mir-31-5p 5′ 23 UGGCAAGAUUAUGGCGAAGCUGA GGCAAGA MIPF0000064; mir-31 sja-miR-31-5p 15 Hypothetical protein (Smp_110270)
sma-mir-3479-3p 3′ 22 UAUUGCACUAACCUUCGCCUUG AUUGCAC N/A sja-miR-3479-3p 0 N/A
sma-mir-3492 5′ 21 AUCCGUGCUGAGAUUUCGUCA UCCGUGC N/A sja-miR-3492 6 Chmp1 (chromatin modifying protein) (charged multivesicular body protein), putative (Smp_055880.1)
sma-mir-36-3p 3′ 23 CCACCGGGUAGACAUUCAUUCGC CACCGGG N/A sja-miR-36-3p 7 Topbp1, putative (Smp_133990.1)
sma-mir-61 3′ 22 UGACUAGAAAGUGCACUCACUU GACUAGA N/A sja-miR-61 4 Transducin-like enhancer protein 1 (Smp_150080) sma-mir-71 5′ 21 UGAAAGACGAUGGUAGUGAGA GAAAGAC MIPF0000278; mir-71 sja-miR-71 42 Multidrug resistance protein 1, 2, 3 (p glycoprotein 1, 2, 3),
putative (Smp_137080)
sma-mir-71b-3p 3′ 21 CCUCAUACUGAGUCUUUCCCG CUCAUAC MIPF0000278; mir-71 sja-miR-71b-3p 1 Hypothetical protein (Smp_184330) sma-mir-71b-5p 5′ 23 UGAAAGACUUGAGUAGUGAGACG GAAAGAC MIPF0000278; mir-71 sja-miR-71b-5p 22 Expressed protein (Smp_006840) sma-mir-8-3p 3′ 23 UAAUACUGUUAGGUAAAGAUGCC AAUACUG MIPF0000019; mir-8 sja-miR-8-3p 2 Snare protein ykt6, putative (Smp_047450) sma-mir-8-5p 5′ 21 CAUCUUACUAACAGUAUUUGA AUCUUAC MIPF0000019; mir-8 sja-miR-8-5p 2 Oxysterol binding protein 9,, putative (Smp_174070)
100
M.
de
Souza
Gomes
et
al.
/
Genomics
98
(2011)
96
–
sma-mir-92ª 5′ 22 GAUUGCACUAGUCACGGCUUUU AUUGCAC MIPF0000013; mir-25 cte-miR-92ª 0 N/A sma-mir-9c 3′ 22 UCUUUGGUAUUCAAUCUGAAGA CUUUGGU MIPF0000014; mir-9 aae-miR-9c-5p 0 N/A
sma-mir-new_1-3p 3′ 22 GAAGCUUCGCAAUUAAACCAUC AAGCUUC N/A N/A 1 Conserved hypothetical protein (Smp_164860) sma-mir-new_1-5p 5′ 22 CUAAGCUGGAAGGUUUAAUCGC UAAGCUG N/A N/A 0 N/A
sma-mir-new_2-3p 3′ 22 AGUGUUUCCAAGUUUUCCAUGG GUGUUUC N/A N/A 0 N/A
sma-mir-new_2-5p 5′ 22 UGGAAAACCUGUGAAAGUACUG GGAAAAC N/A N/A 4 Monocarboxylate transporter, putative (Smp_150340) sma-mir-new_3-3p 3′ 22 GAUUUUCUUCCUGAUGCUUCUG AUUUUCU N/A N/A 1 Actin-related protein 2, arp2 (Smp_101290.1) sma-mir-new_3-5p 5′ 22 AUAUUUCAGAUAUUGAUUUUCU UAUUUCA N/A N/A 0 N/A
sma-mir-new_4-3p 3′ 22 UCGCUUUACCCAUAUCUGCUAG CGCUUUA N/A N/A 0 N/A
sma-mir-new_4-5p 5′ 22 UGCAGGUAAAGUAAUGCUUGUU GCAGGUA N/A N/A 2 Rac-alpha serine/threonine-protein kinase (Smp_073930.2) sma-mir-new_5-3p 3′ 22 AUAAUUUCAAUCUCUGAGAUUA UAAUUUC N/A N/A 0 N/A
sma-mir-new_5-5p 5′ 22 UCCAAAGUUUCGUCCAGCAAAC CCAAAGU N/A N/A 4 Hypothetical protein (Smp_006960) sma-mir-new_6-3p 3′ 22 UCAAUCUCCACAAUCUCAUACU CAAUCUC N/A N/A 3 SWI/SNF complex-related (Smp_152650)
sma-mir-new_6-5p 5′ 22 CUCAGUAUGUGGUUGUGGAGGU UCAGUAU N/A N/A 16 Protein C10orf118 (CTCL tumor antigen HD-CL-01/L14-2), putative (Smp_034940.3)
sma-mir-new_7-3p 3′ 22 CAGCUUAGAGAAUAACACUCCA AGCUUAG N/A N/A 3 Fructose-1,6-bisphosphatase-related (Smp_097370) sma-mir-new_7-5p 5′ 22 CAGAGUUUUAUUCUUUGAUCUG AGAGUUU N/A N/A 8 Fructose-1,6-bisphosphatase-related (Smp_097370) sma-mir-new_8-3p 3′ 22 UCAUACUGAUUCAGUAUGACUA CAUACUG N/A N/A 7 Expressed protein (Smp_015530.1)
sma-mir-new_8-5p 5′ 22 AAACAUAAUCAGUGUAAACCUG AACAUAA N/A N/A 0 N/A
sma-mir-new_9-3p 3′ 22 AACAGCAGUAAGAUGUUUUCCU ACAGCAG N/A N/A 1 Expressed protein (Smp_121440)
sma-mir-new_9-5p 5′ 22 AGGGAAACGUCGUACUGUUGUA GGGAAAC N/A N/A 5 Ectonucleotidepyrophosphatase/phosphodiesterase,putative (Smp_153340.1)
sma-mir-new_10-3p 3′ 22 AAUUCGUCAGUUUUUGGUAAUA AUUCGUC N/A N/A 2 Snf7-related (Smp_010090) sma-mir-new_10-5p 5′ 22 UUAUUUCCAAAACCUUGACGGA UAUUUCC N/A N/A 2 Hypothetical protein (Smp_178030)
sma-mir-new_11-3p 3′ 22 AAUUCAUCUGAAGCUGUUACAC AUUCAUC N/A N/A 1 Mevalonate 5 pyrophosphate decarboxylase (Smp_172660) sma-mir-new_11-5p 5′ 22 UGAAACAGCAUUCAGAAUGAUG GAAACAG N/A N/A 2 Sodium-dependent phosphate transporter, putative (Smp_171630) sma-mir-new_12-3p 3′ 22 UUUGUUAUUGUGUUGAGCAUAU UUGUUAU N/A N/A 0 N/A
sma-mir-new_12-5p 5′ 22 AUCACAGCUCACACACAAUUAA UCACAGC N/A N/A 0 N/A
sma-mir-new_13-3p 3′ 22 UUUUCUAUGAUGGUCUAGCUUC UUUCUAU N/A N/A 2 Solute carrier family 35 member d1, putative (Smp_178490) sma-mir-new_13-5p 5′ 22 AGCUAGACUACCAUGGAAAACU GCUAGAC N/A N/A 9 Monocarboxylate transporter, putative (Smp_150340) sma-mir-new_14-3p 3′ 22 AAAAACUUUCGCACCAGAUAUG AAAACUU N/A N/A 0 N/A
sma-mir-new_14-5p 5′ 22 UUCAUUGUCUGCGAUGAAAAAC UCAUUGU N/A N/A 0 N/A
sma-mir-new_15-3p 3′ 22 UUCCAGGUUUCCAAUGGUGACC UCCAGGU N/A N/A 13 Expressed protein (Smp_177040) sma-mir-new_15-5p 5′ 22 UGUUAAACCAUCAUUGUAAACU GUUAAAC N/A N/A 0 N/A
sma-mir-new_16-3p 3′ 22 AUUACAAGCGAUCACUUUUAUA UUACAAG N/A N/A 0 N/A sma-mir-new_16-5p 5′ 22 UGAACGUUCAUUUUAUGAACAU GAACGUU N/A N/A 0 N/A
101
M.
de
Souza
Gomes
et
al.
/
Genomics
98
(2011)
96
–
and its paralog cluster mir-71b/2 was located on autosomal chromosome 5 (Fig. 3). This is suggestive of sex (W) linked expression of these miRNA genes inS. mansoni, similar to what has been observed for X-linked expressions of miRNAs in humans[32].
2.8. S. mansoni genes targeted by S. mansoni miRNAs
The miRNAs in theS. mansonigenome are likely to play important (but as of yet unelucidated) roles in the development and life-cycle of theS. mansoniparasite. To identifyS. mansonigenes which are likely targeted by theS. mansonimiRNAs identified in this study, the miRNA prediction tool miRanda was used to predict 389 miRNA targets. The miRanda parameters used in our study were similar to those used to predict targets for human and zebrafish miRNAs target genes[40,41]. The miRanda parameters were adjusted to maintain 100% comple-mentarity between the seed region of each miRNA and the 3′UTR of each candidate target gene. In addition, the majority of the 3′UTRs chosen for analysis in this study were also represented byS. mansoni ESTs to improve the confidence of thefindings. Of the 67 matureS. mansonimiRNAs used as queries, 50 of these miRNAs had at least one putative targetS. mansonigene. A majorfinding is that the miRNA clusters sma-mir-71/2 and sma-mir-71b/2 (which contain together in total 12 different mature miRNAs) combined have 200 predicted targets. This is more than 50% of all target predicted (i.e. 389 targets were identified in total). Of the 67 miRNAs detected, sma-mir-71 had a disproportionate number of targets compared to others as it was predicted to potentially regulate 42 distinct target genes. It is well known that miRNAs may act in concert to regulate target genes, and indeed a number of theS. mansonimiRNA gene targets can be targeted by more than one mature miRNA (e.g. sma-71b-3p and sma-mir-31-5p that target the Smp_184330 hypothetical gene). Moreover, a number of miRNAs have multiple target sites within the same target
gene (e.g. sma-mir-2b-5p that contains targets in different positions in the 3′UTR of the hypothetical geneSmp_110400.3) (Supplementary material—Table 1).
To identify which biological processes, molecular functions or cellular components may be targeted by the S. mansoni miRNAs identified in this study, the predicted miRNA gene targets were categorized based on their Gene Ontology (GO) terms. The GO tool CateGOrizer (http://www.animalgenome.org/bioinfo/tools/countgo/) was used to identify which GO slim terms were more represented in the set of miRNA gene targets[49]. Catalytic activity and metabolism-related GO terms represented almost 20% of the GO terms of theS. mansonimiRNA target genes analyzed (Supplementary material — Table 2). Using KEGG (reference pathway), the term metabolic pathway (smm1100) was over-represented showing 14 of the miRNA target genes analyzed (Supplementary material—Table 1).
Among the duplicated miRNA genes, theS. mansonitarget gene repertoires of the sma-71 and sma-71b-5p mature miRNAs were very similar (Supplementary material—Table 1) which is consistent with the high levels of identity of their mature seed region. However, there were a small number of genes only targeted by the female sex chromosome (W chromosome) located sma-mir-71 and not targeted by sma-71b-5p. As mir-71 is located on the female W chromosome it can only be expressed in female schistosomules. Indeed, Simoes et al. (2011) have previously detected high mir-71 expression levels in schistosomules and adult worms[23]. Given that these duplicated miRNA genes may have diverged in function, with sma-mir-71 acquiring some sex-specific (female) functions it is tempting to speculate that the target genes may have sex-specific functions. Indeed, among the genes only targeted by sma-mir-71 werefiveS. mansoni homologs of the human HSP40 DNAj genes, namely Smp_078800, Smp_049600.1, Smp_049600.2, Smp_049600.3 and Smp_049600.4. It has previously been described that DNAj associates
Fig. 2.Phylogenetic tree and alignment of precursor sma-mir-8 with its homologs from Bilaterian species. (a) The phylogenetic relationships were referred between precursor miRNAs of the mir-8 family. The phylogenetic tree was generated by the Neighbor-Joining method in MEGA4 and Kimura 2-parameter model. The branches show the Deuterostome group (miR-429, miR-200 and mir-141 genes) and theEcdysozoa/Lophotrochozoagroup (mir-8 gene). Only bootstrap values higher than 30 are shown for 2000 replicates. (b) The high confidence RNA alignments between sma-mir-8 and its orthologs fromEcdysozoaandLophotrochozoawere performed using RNAalifold. Mature miRNAs are shown as boxes. 103
Table 2
S. mansoniprecursor miRNAs and their characteristics.
miRNA ID GC content Length MFE AMFE MFEI MFEE Frequency Diversity EST ID Chromossome Scaffold Start End Strand Genomic region
sma-bantam 42.25 71 −26.40 −37.18 −0.88 −26.40 37.57 2.64 N/A Schisto_mansoni.SC_0137 369443 369513 (+) Intergenic
sma-let-7 42.70 89 −34.30 −38.54 −0.90 −27.50 1.21 10.72 N/A Schisto_mansoni.Chr_7 5118783 5118871 (+) Intergenic
sma-mir-10 41.77 79 −27.80 −35.19 −0.84 −27.60 29.74 4.84 N/A Schisto_mansoni.Chr_4 19959268 19959346 (−) Intergenic
sma-mir-124 37.63 93 −28.30 −30.43 −0.81 −28.10 5.80 7.77 N/A Schisto_mansoni.Chr_6 18429525 18429617 (−) Intergenic
sma-mir-125a 43.90 82 −30.90 −37.68 −0.86 −30.20 31.96 2.30 N/A Schisto_mansoni.Chr_1 38691263 38691344 (−) Intergenic
sma-mir-190 40.50 121 −44.80 −37.02 −0.91 −44.70 4.46 5.01 N/A Schisto_mansoni.Chr_1 34471102 34471222 (+) Intronic-Smp_037860
sma-mir-212 34.48 87 −21.50 −24.71 −0.72 −20.50 7.10 6.21 N/A Schisto_mansoni.Chr_2 29111488 29111574 (−) Intronic-Smp_143490
sma-mir-2162 44.74 76 −34.90 −45.92 −1.03 −34.30 9.12 4.72 N/A Schisto_mansoni.SC_0049 36185 36260 (+) Intergenic
sma-mir-250 36.00 100 −44.40 −44.40 −1.23 −44.40 20.54 2.83 N/A Schisto_mansoni.SC_0125 24702 24801 (+) Intergenic
sma-mir-281 34.69 98 −36.60 −37.35 −1.08 −34.40 9.43 15.87 N/A Schisto_mansoni.Chr_4 27195935 27196032 (−) Intergenic
sma-mir-2a 46.15 78 −39.00 −50.00 −1.08 −39.00 50.78 1.77 N/A Schisto_mansoni.Chr_W 22875749 22875826 (+) Intergenic
sma-mir-2b 54.43 79 −35.20 −44.56 −0.82 −35.00 31.80 3.74 N/A Schisto_mansoni.Chr_W 22875844 22875922 (+) Intergenic
sma-mir-2c 48.00 75 −27.62 −36.83 −0.77 −27.62 33.73 3.13 N/A Schisto_mansoni.Chr_5 1982423 1982497 (−) Intergenic
sma-mir-2d 37.50 88 −30.80 −35.00 −0.93 −30.80 17.43 5.26 N/A Schisto_mansoni.Chr_5 1982526 1982613 (−) Intergenic
sma-mir-2e 39.76 83 −25.00 −30.12 −0.76 −24.40 18.86 9.30 N/A Schisto_mansoni.Chr_W 22875945 22876027 (+) Intergenic
sma-mir-3011 33.67 98 −38.50 −39.29 −1.17 −37.70 13.64 4.09 N/A Schisto_mansoni.SC_0250 146496 146593 (−) Intronic-Smp_146450
sma-mir-31 42.17 83 −33.30 −40.12 −0.95 −32.40 11.34 7.36 N/A Schisto_mansoni.Chr_6 1777481 1777563 (−) Intergenic
sma-mir-3479 38.16 76 −28.80 −37.89 −0.99 −28.19 8.67 5.92 N/A Schisto_mansoni.Chr_4.unplaced.SC_0032 1561284 1561359 (−) Intronic-Smp_148850
sma-mir-3492 48.35 91 −27.00 −29.67 −0.61 −26.70 23.79 3.77 N/A Schisto_mansoni.Chr_W 8158491 8158581 (+) Intronic-Smp_126330
sma-mir-36 44.68 94 −37.45 −39.84 −0.89 −37.25 3.26 5.85 N/A Schisto_mansoni.Chr_1 57476968 57477061 (−) Intergenic
sma-mir-61 43.88 98 −29.90 −30.51 −0.70 −28.16 6.56 10.83 N/A Schisto_mansoni.Chr_2 25390606 25390703 (+) Intergenic
sma-mir-71 51.25 80 −34.50 −43.13 −0.84 −34.50 41.47 1.94 N/A Schisto_mansoni.Chr_W 22875655 22875734 (+) Intergenic
sma-mir-71b 53.26 92 −31.40 −34.13 −0.64 −25.14 5.00 11.21 N/A Schisto_mansoni.Chr_5 1982759 1982850 (−) Intergenic
sma-mir-8 34.21 76 −25.70 −33.82 −0.99 −25.70 18.69 5.04 N/A Schisto_mansoni.Chr_1 10044867 10044942 (−) Intergenic
sma-mir-92a 43.66 71 −25.00 −35.21 −0.81 −25.00 28.79 3.17 N/A Schisto_mansoni.Chr_3 22956805 22956875 (−) Intergenic
sma-mir-9c 31.31 99 −30.20 −30.51 −0.97 −29.67 8.28 6.21 N/A Schisto_mansoni.Chr_2 21913217 21913315 (+) Intergenic
sma-mir-new_1 40.82 98 −36.4 −37.14 −0.91 −30.4 12.36 5.44 Sm24375 Schisto_mansoni.Chr_3 24540256 24540353 (+) Intronic-Smp_132570
sma-mir-new_2 41.30 92 −37.50 −40.76 −0.99 −37.2 14.83 5.81 Sm01360 Schisto_mansoni.Chr_6 4070791 4070882 (+) Intergenic
sma-mir-new_3 34.34 99 −28.90 −29.19 −0.85 −25.4 3.05 9.67 Sm02419 Schisto_mansoni.Chr_3 13891083 13891181 (+) Intergenic
sma-mir-new_4 43.30 97 −32.89 −33.91 −0.78 −32.89 5.83 6.08 Sm04679 Schisto_mansoni.Chr_2.unplaced.SC_0120 6469 6565 (−) Intergenic
sma-mir-new_5 30.30 99 −32.30 −32.63 −1.08 −32.3 39.36 3.03 Sm05165 Schisto_mansoni.Chr_W 24055623 24055721 (+) Intergenic
sma-mir-new_6 36.67 90 −35 −38.89 −1.06 −34.4 16.07 7.87 Sm12132 Schisto_mansoni.Chr_7.unplaced.SC_0100 956192 956281 (−) Intronic-Smp_144770
sma-mir-new_7 32.10 81 −28.60 −35.31 −1.10 −28.6 20.58 3.34 Sm01328 Schisto_mansoni.Chr_7 789769 789849 (+) 3′UTR-Smp_097370
sma-mir-new_8 44.44 81 −31.3 −38.64 −0.87 −31.3 21.03 2.77 Sm20488 Schisto_mansoni.Chr_5 2556921 2557001 (−) Intronic-Smp_153410
sma-mir-new_9 45.45 66 −32.6 −49.39 −1.09 −31.64 30.25 2.51 Sm21666 Schisto_mansoni.Chr_W 36376729 36376794 (+) Intronic-Smp_135850
sma-mir-new_10 35.44 79 −27.6 −34.94 −0.99 −27.5 22.31 5.1 Sm22883 Schisto_mansoni.Chr_2 8470212 8470290 (+) Intergenic
sma-mir-new_11 40.28 72 −28.2 −39.17 −0.97 −25.95 8.59 6.92 Sm29317 Schisto_mansoni.Chr_2 28915165 28915236 (+) Intronic-Smp_143550
sma-mir-new_12 41.94 93 −26.3 −28.28 −0.67 −26.11 11.12 9.63 Sm25456 Schisto_mansoni.Chr_W 3892016 3892108 (+) Intergenic
sma-mir-new_13 37.50 80 −41.60 −52.00 −1.39 −39.9 27.78 3.82 Sm05979 Schisto_mansoni.SC_0041 1513726 1513805 (+) Intergenic
sma-mir-new_14 43.00 100 −36.50 −36.50 −0.85 −36.5 5.74 5.94 Sm08219 Schisto_mansoni.Chr_W 54858104 54858203 (−) Intronic-Smp_136490
sma-mir-new_15 38.20 89 −29.4 −33.03 −0.86 −29.2 11.66 5.65 Sm18604 Schisto_mansoni.Chr_W 30576111 30576199 (−) Intergenic
sma-mir-new_16 30.00 90 −32.1 −35.67 −1.19 −32.1 10.44 4.27 Sm25070 Schisto_mansoni.Chr_W 35229680 35229768 (+) Intergenic
MFE: Minimal Free Energy. AMFE: Adjust Minimal Free Energy. MFEI: Minimal Free Energy Index. MFEE: minimal free energy of the ensemble.
104
M.
de
Souza
Gomes
et
al.
/
Genomics
98
(2011)
96
–
with steroid receptors to promote a change in protein conformation that allows binding of the hormone. In mammals, female mice with deleted DNAj (DjA−/−) grow normally and are fertile but on the other hand, male mice have severe spermatogenesis defects and are infertile. Female S. mansoni are sexually immature and require sexually mature male partners to acquire sexual maturity i.e. females will not become sexually mature without male contact, which initiates gene expression to allow sexual maturation[42].The sex (W) linked miRNA sma-mir-71 that is likely targetingS. mansoniDNAj homologs can only be active in females (ZW) as it will be absent in males (ZZ). It is possible that miRNA sma-mir-71 regulation of DNAj genes could be significant in relation to sex-specific traits in S. mansoni.
3. Conclusions
In this study we provide a systematic analysis of miRNAs in S. mansoniusing two different approaches to identify conserved and non-conserved miRNAs. Overall, our integrated computational ap-proach identifies 42 pre-miRNAs and 67 mature miRNAs within the genome of the parasiteS. mansoni. Within these, it was possible to identify 26 precursors and 35 mature miRNAs which were evolution-arily conserved, and 16 precursors and 32 mature miRNA which were non-conserved. The miRNAs identified were found on the 7 autosomes and also on the female sex (W) chromosome. In addition, a number of
duplicated miRNAs were identified which were located on miRNA clusters. Our analysis of miRNA target genes inS. mansonipresents for thefirst time 389 candidates miRNA target genes. Intriguingly, over 50% of these gene targets were targeted by the miRNA members of two miRNA clusters. The analysis of the miRNA targets suggests that one of the sex-specific miRNAs may be involved in female sex-specific functions via regulation of the DNAj homologs in S. mansoni. The identification of novel miRNAs and miRNA targets within the genome ofS. mansoniwill open up new avenues for increasing understanding of the development and parasitic lifecycle ofS. mansoniwhich will be essential for development of treatments for Schistosomiasis.
4. Materials and methods
4.1. miRNA and S. mansoni sequence database
TheS. mansonigenome (version 5.1) and ESTs were downloaded from GeneDB database (http://www.genedb.org) [37]. Currently, whole genome sequence consists of scaffolds available at GeneDB and NCBI as well. In relation to miRNAs, 17,341 mature and 15,172 precursor sequences were retrieved from miRBase (Welcome Trust Sanger Institute's miRBase, http://microrna.sanger.ac.uk — release 16.0, September 2010) and using Perl script and miRBase browser we collected 13,278 mature and 11,796 precursor miRNA sequences from animal species. The sequences were stored in multi-fasta format and used for further analyses.
4.2. Computational prediction of S. mansoni microRNA genes
We used an integrated approach to search the potential conserved and non-conserved miRNAs in availableS. mansonidatabases. The overview ofin silicodetection of novelS. mansonimiRNA genes was shown inFig. 1.
Firstly, we retrieved 1,300,000 sequences that formed hairpin-like structures from the S. mansoni genome and EST databases using einverted EMBOSS and BLASTn tools. The parameters used for einverted program were maxrepeat 95 nucleotides and score threshold 25 for both databases collecting sequences with the length between 60 and 100 nucleotides. In addition, we performed BLASTn to search using the 11,796 animal pre-miRNA sequences that matches in theS. mansonidatabase. The results werefiltered with e-value threshold (0.001), match within threshold length (minimal size 25 nucleotides), 80% of identity and the
Fig. 4.Phylogenetic distribution of animal miRNAs. The conserved miRNA found inS. mansoniwere compared with their orthologs in animal's species. The“X”indicates the presence of the miRNA at least in one species inside the branch. The top squares show the name of the miRNA gene family and miRNA gene name. The simplified phylogeny was based on Jones[48].
Fig. 3.Distribution of miRNA genes inS. mansonichromosome scaffolds. The relative locations of miRNA genes in chromosome scaffolds (Assembly 5.1) are shown across 7 autosomal and one sex chromosome. Lines represent the miRNA gene in each chromosome. The arrows pointS. mansonimiRNA clusters, 71/2 and sma-mir-71b/2, located in W and 5 chromosomes, respectively.
105
sequences were retrieved by considering the number of nucleotides upstream and downstream nucleotides of each query sequence.
We improved the accuracy of miRNA prediction byfiltering the hairpin like sequences (1,300,000) using the next 7 steps: MFE (Minimal Free Energy), GC content, mature sequence homology, non coding RNAsfilter, protein coding genesfilter, repeat elementsfilter andfinally miPred. Briefly, these sequences were filtered using MFE(s) determined via RNAfold (Vienna RNA Package) with the parameters: RNA secondary folding energy threshold−20 kcal/mol and with the options“-p -d2 -noLP” [25]. Second, these structures werefiltered with GC content ranging from 30% to 65%. Third, 13,278 mature miRNAs of animal were aligned against the sequences and no more than 3 mismatches were accepted in whole mature miRNAs, 0 mismatch in seed region (2–8 nt) and 1 nucleotide overlapping in the hairpin loop. Fourth, we removed the sequences similar to the known non-coding RNA sequences, i.e. rRNA, snRNA, SL RNA, SRP, tRNAs and RNase P[16]. We used BLASTn tool with e-value threshold lower than 0.0001, minimal alignment size 40 nucleotides and 95% of identity. Fifth, the sequences similar to coding regions were also removed by performing BLASTn with predicted gene sequences from GeneDB and proceeded further with similar methodology as above. Sixth, we removed the sequences with high similarity to repeat elements. We used RepeatMasker with cross_match as search engine that is slower than but often more sensitive than the other engines (http:// www.repeatmasker.org). And finally, we used miPred to classify the sequences considering only real microRNA precursors and removing pseudo and not real precursor miRNAs[26]. This tool distinguishes real pre-miRNAs from other hairpin sequences with similar stem-loops using random forest prediction model and considering more combined features. To search potential non-conserved miRNAs we used the similar protocol described above excluding the third step and adding manual curation and miRNA MatureBayes web tool step which is a probabilistic algorithm to identify the mature miRNAs within novel precursors[43].
Further we selected a set of parameters (MFE, Adjusted Minimal Free Energy (AMFE), Minimal Free Energy Index (MFEI), GC content, Minimal Free Energy of the thermodynamic ensemble (MFEE), Ensemble Diversity (Diversity), and frequency of the MFE structure in the ensemble (Frequency)) to compare the known miRNAs deposited in miRBase from Animals, Deuterostome,Ecdysozoa,Lophotrochozoa species and S. japonicum (Supplementary material). The parameter adjusted MFE (AMFE) was defined as the MFE of a 100 nucleotide length of sequence and the minimal folding free energy index (MFEI) that was calculated by the following equation: MFEI = [(AMFE) × 100]/ (G% + C%)[27]. The diversity, MFE and frequency of the ensemble were measured using RNAfold as well as MFE of the secondary structures. The GC content and the length of each sequence were measured using Perl script. We also searched putative clusters in theS. mansonigenome (GeneDB) using the genomic localizations of each putative pre-miRNA sequence. All miRNA genes were used for the general clustering analysis. The RNAfold was used to perform the secondary folding of the cluster.
4.3. Conservation and phylogenetic distribution of the S. mansoni pre-miRNAs
The homologue pre-miRNA sequences were aligned using ClustalX 2.0[43]with the following alignment parameters: gap opening, 22.50; gap extension, 0.83[44]as well as RNAalifold. The mature miRNA sequence logos were generated using WebLogo 2.8.2 at http:// weblogo.berkeley.edu/logo.cgi[45]. The phylogenetic trees were reconstructed using the Neighbor-Joining method[46]and sequence divergence was estimated using Kimura's two-parameter model for genetic distance in MEGA 4. Statistical reliabilities of the internal branches were assessed using 2000 bootstrap replicates showing
Fig. 5(continued).
Fig. 5.Phylogenetic tree and alignment of precursor sma-mir-10 with its homologs from Bilaterian species. (a) The phylogenetic relationships were referred among precursor miRNAs of the MIR-10 family. We inferred the tree using the Neighbor-Joining method in MEGA4 and Kimura 2-parameter model. The branches show the Deuterostome,Ecdysozoa
andLophotrochozoagroup. Only bootstraps values higher than 30 are shown for 2000 replicates. (b) The high confidence RNA alignments among sma-mir-10 and its orthologs from
EcdysozoaandLophotrochozoawere performed using RNAalifold. Mature miRNAs are shown as boxes.
107
values higher than 30 above the branches.[47] The abbreviations showed were: aae (Aedes aegypti), aga (Anopheles gambiae), age (Ateles geoffroyi), ame (Apis mellifera), api (Acyrthosiphon pisum), bfl (B. floridae), bma (Brugia malayi), bmo (Bombyx mori), bta (Bos taurus), cbr (Caenorhabditis briggsae), cel (Caenorhabditis elegans), cfa (Canis familiaris), cin (Ciona intestinalis), cqu (Culex quinquefasciatus), crm (Caenorhabditis remanei), csa (Ciona savignyi), cte (Capitella teleta), dan (Drosophila ananassae), der (Drosophila erecta), dgr (Drosophila grimshawi), dme (Drosophila melanogaster), dmo ( Dro-sophila mojavensis), dpe (Drosophila persimilis), dps (Drosophila
pseudoobscura), dpu (Daphnia pulex), dre (Danio rerio), dse ( Drosoph-ila sechellia), dsi (Drosophila simulans), dvi (Drosophila virilis), dwi (Drosophila willistoni), dya (Drosophila yakuba), eca (Equus caballus), fru (Fugu rubripes), gga (Gallus gallus), ggo (Gorilla gorilla), hsa (H. sapiens), isc (Ixodes scapularis), lgi (L. gigantea), lmi (Locusta migratoria), mdo (Monodelphis domestica), mml (Macaca mulatta), mmu (Mus musculus), mne (Macaca nemestrina), nlo (Nasonia longicornis), nvi (Nasonia vitripennis), oan (Ornithorhynchus anatinus), ppa (Pan paniscus), ppc (Pristionchus pacificus), ppy (Pongo pyg-maeus), ptr (Pan troglodytes), rno (Rattus norvegicus), sja (S.
Fig. 6(continued).
Fig. 6.Phylogenetic tree and alignment of precursor sma-mir-71 and sma-mir-71b with its homologs from Bilateria species and clusters (sma-mir-71/2 and sma-mir-71b/2). (a) The phylogenetic relationships were referred among precursor miRNAs of the MIR-71 family. We inferred the tree using the Neighbor-Joining method in MEGA4 and Kimura 2-parameter model. The branches show the Deuterostome (Cephalochordata, Echinodermata and Hemichordata),EcdysozoaandLophotrochozoagroup. Only bootstraps values higher than 30 are shown for 2000 replicates. (b) The high confidence RNA alignments among sma-mir-71, sma-mir-71b and its orthologs fromEcdysozoaandLophotrochozoagroup were performed using RNAalifold. Mature miRNAs are shown as boxes. (c) RNA secondary structure of the clusters sma-mir-71/2 and sma-mir-71b/2 were draw by RNAfold[25]. The chromosome scaffold position, length and strand are shown in the gray box.
109
japonicum), sko (Saccoglossus kowalevskii), sla (Saguinus labiatus), sma (S. mansoni), sme (S. mediterranea), spu (Strongylocentrotus purpuratus), ssc (Sus scrofa), tca (Tribolium castaneum), tgu ( Taenio-pygia guttata), tni (Tetraodon nigroviridis), xla (Xenopus laevis), xtr (Xenopus tropicalis).
4.4. Computational prediction of S. mansoni microRNA target genes
We collected 3′-UTR-sequences from GeneDB. Further, to search the targets we used the miRanda software version 3.3a, released 2010, within the following parameters and conditions: a gap opening penalty of−8, a gap extension penalty of−2; match with minimum score threshold 120, target duplex with maximum threshold free energy −20 kcal/mol, scaling parameter 3 for complementary nucleotide match score, counting from the miRNA 5′ end, and demand strict 5′seed pairing on between 2 and 9 nucleotides. The web tool GO CateGOrizer (http://www.animalgenome.org/bioinfo/ tools/countgo/) using the classification method GO-Slim, was used to group and count the GO classes of the predicted targets [49]. Moreover, KEEG (Kyoto Encyclopedia of Genes and Genomes) was used to include functional information about the target genes.
4.5. Statistical analysis and plots
Statistical analysis and box plots were drawn using R version 2.12.1 (The R Project for Statistical Computing—http://www.r-project.org/). The set of data about each miRNA characteristic were obtained using Perl scripts and RNAfold from Vienna package.
Supplementary materials related to this article can be found online atdoi:10.1016/j.ygeno.2011.05.007.
Acknowledgments
This work was supported by The Brazilian Federal Agency for Support and Evaluation of Graduate Education (Capes Foundation— Scholarship Proc. no. 1495-10-0), FAPEMIG (CBB 2935/09), the Irish Health Research Board/National Cancer Institute (NCI) grant number JRPC/2008/2, and the Centre for Chromosome Biology, NUI Galway, Ireland. We thank the Wellcome Trust Sanger Institute and The Institute for Genomic Research for allowing use of their sequences that are available via GeneDB, the central data resource for the S. mansonigenome project (http://www.genedb.org/genedb/smansoni/). TheS. mansonigenome project is funded by the Wellcome Trust and the National Institutes for Health (NIH grant AI48828). Thanks to Simrat Kaur for comments on the manuscript.
References
[1] N. Bushati, S.M. Cohen, microRNA functions, Annu. Rev. Cell Dev. Biol. 23 (2007) 175–205.
[2] A.M. Denli, B.B. Tops, R.H. Plasterk, R.F. Ketting, G.J. Hannon, Processing of primary microRNAs by the microprocessor complex, Nature 432 (2004) 231–235. [3] D.P. Bartel, MicroRNAs: genomics, biogenesis, mechanism, and function, Cell 116
(2004) 281–297.
[4] W.C. Lin, S.C. Li, J.W. Shin, S.N. Hu, X.M. Yu, T.Y. Huang, S.C. Chen, H.C. Chen, S.J. Chen, P.J. Huang, R.R. Gan, C.H. Chiu, P. Tang, Identification of microRNA in the protistTrichomonas vaginalis, Genomics 93 (2009) 487–493.
[5] S.C. Li, W.C. Chan, L.Y. Hu, C.H. Lai, C.N. Hsu, W.C. Lin, Identification of homologous microRNAs in 56 animal genomes, Genomics 96 (2010) 1–9.
[6] Y.Q. Zhang, D.L. Chen, H.F. Tian, B.H. Zhang, J.F. Wen, Genome-wide computational identification of microRNAs and their targets in the deep-branching eukaryote
Giardia lamblia, Comput. Biol. Chem. 33 (2009) 391–396.
[7] E. Berezikov, E. Cuppen, R.H. Plasterk, Approaches to microRNA discovery, Nat. Genet. 38 (Suppl) (2006) S2–S7.
[8] A. Kozomara, S. Griffiths-Jones, miRBase: integrating microRNA annotation and deep-sequencing data, Nucleic Acids Res. 39 (2011) D152–D157.
[9] S.M. Hammond, microRNA detection comes of age, Nat. Methods 3 (2006) 12–13. [10] Y. Huang, Q. Zou, S.P. Wang, S.M. Tang, G.Z. Zhang, X.J. Shen, The discovery approaches and detection methods of microRNAs, Mol. Biol. Rep. (2010) 1–11. [11] X. Yu, Q. Zhou, Y. Cai, Q. Luo, H. Lin, S. Hu, J. Yu, A discovery of novel microRNAs in
the silkworm (Bombyx mori) genome, Genomics 94 (2009) 438–444.
[12] L. Li, J. Xu, D. Yang, X. Tan, H. Wang, Computational approaches for microRNA studies: a review, Mamm. Genome 21 (2010) 1–12.
[13] S.C. Li, C.Y. Pan, W.C. Lin, Bioinformatic discovery of microRNA precursors from human ESTs and introns, BMC Genomics 7 (2006).
[14] W. Sun, Y.S. Julie Li, H.D. Huang, J.Y. Shyy, S. Chien, microRNA: a master regulator of cellular processes for bioengineering systems, Annu. Rev. Biomed. Eng. 12 (2010) 1–27. [15] M. Brameier, C. Wiuf, Ab initio identification of human microRNAs based on
structure motifs, BMC Bioinformatics 8 (2007) 478.
[16] C.S. Copeland, M. Marz, D. Rose, J. Hertel, P.J. Brindley, C.B. Santana, S. Kehr, C.S. Attolini, P.F. Stadler, Homology-based annotation of non-coding RNAs in the genomes ofSchistosoma mansoniandSchistosoma japonicum, BMC Genomics 10 (2009) 464.
[17] J. Huang, P. Hao, H. Chen, W. Hu, Q. Yan, F. Liu, Z.G. Han, Genome-wide identification ofSchistosoma japonicum microRNAs using a deep-sequencing approach, PLoS One 4 (2009) e8206.
[18] Z. Wang, X. Xue, J. Sun, R. Luo, X. Xu, Y. Jiang, Q. Zhang, W. Pan, An“in-depth”
description of the small non-coding RNA population ofSchistosoma japonicum
schistosomulum, PLoS Negl. Trop. Dis. 4 (2010) e596.
[19] X. Xue, J. Sun, Q. Zhang, Z. Wang, Y. Huang, W. Pan, Identification and characterization of novel microRNAs fromSchistosoma japonicum, PLoS One 3 (2008) e4034.
[20] Q. Liu, W. Tuo, H. Gao, X.Q. Zhu, MicroRNAs of parasites: current status and future perspectives, Parasitol. Res. 107 (2010) 501–507.
[21] L. Hao, P. Cai, N. Jiang, H. Wang, Q. Chen, Identification and characterization of microRNAs and endogenous siRNAs inSchistosoma japonicum, BMC Genomics 11 (2010) 55.
[22] G. Krautz-Peterson, P.J. Skelly,Schistosoma mansoni: the dicer gene and its expression, Exp. Parasitol. 118 (2008) 122–128.
[23] M.S. Gomes, F.J. Cabral, L.K. Jannotti-Passos, O. Carvalho, V. Rodrigues, E.H. Baba, R.G. Sa, Preliminary analysis of miRNA pathway inSchistosoma mansoni, Parasitol. Int. 58 (2009) 61–68.
[24] M.C. Simoes, J. Lee, A. Djikeng, G.C. Cerqueira, A. Zerlotini, R.A. da Silva-Pereira, A.R. Dalby, P. Loverde, N.M. El-Sayed, G. Oliveira, Identification ofSchistosoma mansonimicroRNAs, BMC Genomics 12 (2011) 47.
[25] I.L. Hofacker, RNA secondary structure analysis using the Vienna RNA package, Curr. Protoc. Bioinformatics (2009) Chapter 12, Unit12 .2, 12.2.1–12.2.16. [26] P. Jiang, H. Wu, W. Wang, W. Ma, X. Sun, Z. Lu, MiPred: classification of real and
pseudo microRNA precursors using random forest prediction model with combined features, Nucleic Acids Res. 35 (2007) W339–W344.
[27] B. Zhang, X. Pan, C.H. Cannon, G.P. Cobb, T.A. Anderson, Conservation and divergence of plant microRNA genes, Plant J. 46 (2006) 243–259.
[28] S.J. Mi, T. Cai, Y.G. Hu, Y. Chen, E. Hodges, F.R. Ni, L. Wu, S. Li, H. Zhou, C.Z. Long, S. Chen, G.J. Hannon, Y.J. Qi, Sorting of small RNAs intoArabidopsisargonaute complexes is directed by the 5′terminal nucleotide, Cell 133 (2008) 116–127. [29] S. Artzi, A. Kiezun, N. Shomron, miRNAminer: a tool for homologous microRNA
gene search, BMC Bioinformatics 9 (2008) 39.
[30] M. Zhou, Q. Wang, J. Sun, X. Li, L. Xu, H. Yang, H. Shi, S. Ning, L. Chen, Y. Li, T. He, Y. Zheng, In silico detection and characteristics of novel microRNA genes in the
Equus caballusgenome using an integrated ab initio and comparative genomic approach, Genomics 94 (2009) 125–131.
[31] D. Wang, M. Lu, J. Miao, T.T. Li, E. Wang, Q.H. Cui, Cepred: predicting the co-expression patterns of the human intronic microRNAs with their host genes, PLoS One 4 (2009).
[32] R. Song, S. Ro, J.D. Michaels, C. Park, J.R. McCarrey, W. Yan, Many X-linked microRNAs escape meiotic sex chromosome inactivation, Nat. Genet. 41 (2009) 488–493. [33] L.F. Sempere, C.N. Cole, M.A. McPeek, K.J. Peterson, The phylogenetic distribution
of metazoan microRNAs: insights into evolutionary complexity and constraint, J. Exp. Zool. B Mol. Dev. Evol. 306 (2006) 575–588.
[34] F. Campo-Paysaa, M. Semon, R.A. Cameron, K.J. Peterson, M. Schubert, microRNA complements in deuterostomes: origin and evolution of microRNAs, Evol. Dev. 13 (2011) 15–27.
[35] D. Lemons, W. McGinnis, Genomic evolution of Hox gene clusters, Science 313 (2006) 1918–1922.
[36] R.J. Pierce, W. Wu, H. Hirai, A. Ivens, L.D. Murphy, C. Noel, D.A. Johnston, F. Artiguenave, M. Adams, J. Cornette, E. Viscogliosi, M. Capron, G. Balavoine, Evidence for a dispersed Hox gene cluster in the platyhelminth parasite
Schistosoma mansoni, Mol. Biol. Evol. 22 (2005) 2491–2503.
[37] M. Berriman, B.J. Haas, P.T. LoVerde, R.A. Wilson, G.P. Dillon, G.C. Cerqueira, S.T. Mashiyama, B. Al-Lazikani, L.F. Andrade, P.D. Ashton, M.A. Aslett, D.C. Bartholo-meu, G. Blandin, C.R. Caffrey, A. Coghlan, R. Coulson, T.A. Day, A. Delcher, R. DeMarco, A. Djikeng, T. Eyre, J.A. Gamble, E. Ghedin, Y. Gu, C. Hertz-Fowler, H. Hirai, Y. Hirai, R. Houston, A. Ivens, D.A. Johnston, D. Lacerda, C.D. Macedo, P. McVeigh, Z. Ning, G. Oliveira, J.P. Overington, J. Parkhill, M. Pertea, R.J. Pierce, A.V. Protasio, M.A. Quail, M.A. Rajandream, J. Rogers, M. Sajid, S.L. Salzberg, M. Stanke, A.R. Tivey, O. White, D.L. Williams, J. Wortman, W. Wu, M. Zamanian, A. Zerlotini, C.M. Fraser-Liggett, B.G. Barrell, N.M. El-Sayed, The genome of the bloodfluke
Schistosoma mansoni, Nature 460 (2009) 352–358.
[38] A. Tanzer, P.F. Stadler, Molecular evolution of a microRNA cluster, J. Mol. Biol. 339 (2004) 327–335.
[39] M. Noguer-Dance, S. Abu-Amero, M. Al-Khtib, A. Lefevre, P. Coullin, G.E. Moore, J. Cavaille, The primate-specific microRNA gene cluster (C19MC) is imprinted in the placenta, Hum. Mol. Genet. 19 (2010) 3566–3582.
[40] B. John, A.J. Enright, A. Aravin, T. Tuschl, C. Sander, D.S. Marks, Human microRNA targets, PLoS Biol. 2 (2004) e363.
[41] P.Y. Chen, H. Manninga, K. Slanchev, M. Chien, J.J. Russo, J. Ju, R. Sheridan, B. John, D.S. Marks, D. Gaidatzis, C. Sander, M. Zavolan, T. Tuschl, The developmental
miRNA profiles of zebrafish as determined by small RNA cloning, Genes Dev. 19 (2005) 1288–1293.
[42] M.L. Steinauer, The sex lives of parasites: investigating the mating system and mechanisms of sexual selection of the human pathogenSchistosoma mansoni, Int. J. Parasitol. 39 (2009) 1157–1163.
[43] K. Gkirtzou, I. Tsamardinos, P. Tsakalides, P. Poirazi, MatureBayes: a probabilistic algorithm for identifying the mature miRNA within novel precursors, PLoS One 5 (2010) e11843.
[44] K. Takane, K. Fujishima, Y. Watanabe, A. Sato, N. Saito, M. Tomita, A. Kanai, Computational prediction and experimental validation of evolutionarily con-served microRNA target genes in Bilaterian animals, BMC Genomics 11 (2010) 101.
[45] G.E. Crooks, G. Hon, J.M. Chandonia, S.E. Brenner, WebLogo: a sequence logo generator, Genome Res. 14 (2004) 1188–1190.
[46] N. Saitou, M. Nei, The neighbor-joining method: a new method for reconstructing phylogenetic trees, Mol. Biol. Evol. 4 (1987) 406–425.
[47] K. Tamura, J. Dudley, M. Nei, S. Kumar, MEGA4: Molecular Evolutionary Genetics Analysis (MEGA) software version 4.0, Mol. Biol. Evol. 24 (2007) 1596–1599. [48] M. Jones, M. Blaxter, Evolutionary biology: animal roots and shoots, Nature 434
(2005) 1076–1077.
[49] Z.L. Hu, J. Bao, J.M. Reecy, CateGOrizer: a web-based program to batch analyze gene ontology classification categories, Online J. Bioinform. 9 (2008) 108–112.
111