Interethnic admixture and the evolution of Latin American populations
Francisco Mauro Salzano
1and Mónica Sans
2 1Departamento de Genética, Instituto de Biociências, Universidade Federal do Rio Grande do Sul,
Porto Alegre, RS, Brazil.
2
Departamento de Antropología Biológica, Facultad de Humanidades y Ciencias de la Educación,
Universidad de la República, Montevideo, Uruguay.
Abstract
A general introduction to the origins and history of Latin American populations is followed by a systematic review of the data from molecular autosomal assessments of the ethnic/continental (European, African, Amerindian) ances-tries for 24 Latin American counances-tries or territories. The data surveyed are of varying quality but provide a general pic-ture of the present constitution of these populations. A brief discussion about the applications of these results (admixture mapping) is also provided. Latin American populations can be viewed as natural experiments for the in-vestigation of unique anthropological and epidemiological issues.
Keywords: interethnic admixture, Latin America, population structure.
The Latin American Microcosm
Geographically, Latin America extends over a vast area, from 32° North to 60° South and from 120° to 20° West of Greenwich. Within this territory, Middle America stretches from approximately 8° North to 32° North, while South America continues to the region’s southern limit.
Throughout this area lives a very diverse population, inhabiting equally diverse environments with distinct geo-logical and ecogeo-logical characteristics. Tropical, subtropi-cal, and extremely cold climates all occur in the region, along with altitude variations and moisture extremes (for example, the Atacama desert in Chile is one of the driest places in the world).
Middle America has a population of approximately 165 million people, with slightly more than half of them characterized as ethnically admixed (Mestizos). Amerin-dian ancestry is especially prevalent in Mexico and Guate-mala, while people of African descent are more common in the Caribbean area. South America contains roughly twice as many persons (approximately 322 million), and the in-fluence of European ancestry is more marked in this region, although interethnic admixture is as common as in Middle America.
The human populations of Latin America have been investigated from an array of disciplinary perspectives. Global evaluations of the genetics and evolution of these
populations have been conducted by Salzano (1971) and Salzano and Bortolini (2002). The admixture process was considered by Sans (2000), while Gibbonet al.(2011)
ex-amined the ways in which ethnic identities, genetic/ge-nomic ancestry and health interacted in Argentina, Brazil, Colombia, and Uruguay.
Origins
General
The present Latin American populations are the con-sequences of a process that began in Northeastern Asia as early as 15,000-18,000 years ago (among others, Schurr and Sherry, 2004; Fagundes et al., 2008; Perego et al.,
2009; Salzano, 2007, 2011). After the arrival of Europeans and Africans a little over five centuries ago, a complex pro-cess of admixture took place. This recent period has in-volved populations from a broad range of origins, making Latin American history unique (Sans, 2000). Presently, Latin America can be seen as a natural experiment for an-thropological and epidemiological studies in which poly-morphic loci and linkage disequilibrium can be used to infer the genetic basis for traits of interest (Chakraborty and Weiss, 1988).
The populations that entered into contact during the last several centuries were, as previously mentioned, very diverse. The original background of the region was com-posed by Native Americans; Europeans, mostly Spanish and Portuguese but also other nationalities; and Africans, who were initially brought to the region as slaves and came www.sbg.org.br
Send correspondence to Francisco M. Salzano. Departamento de Genética, Instituto de Biociências, Universidade Federal do Rio Grande do Sul, Caixa Postal 15053, 91501-970 Porto Alegre, RS, Brazil. E-mail: [email protected].
from different areas of that continent. Some Latin Ameri-can countries have also received East Indian, Chinese, Jap-anese, JavJap-anese, and other Asian populations. Examples include the Japanese immigrants that came to São Paulo and Pará in Brazil or the Chinese-origin populations that initially settled in the coastal valleys of Peru and were later distributed across the whole country.
Native Americans
As indicated previously, populations originating from Asia entered America approximately 15,000-18,000 years ago, but these dates, as well as the origin or origins of these populations in Asia, are still discussed. One of the most accepted views involves a coastal route that includes a stage in Beringia, a land bridge that appeared intermittently between 70,000 and 12,000 years ago. Fagundes et al.
(2008) suggested a complex model that involved an early differentiation from Asian populations, a slow and lengthy evolution in Beringia, and a rapid expansion in America due primarily to a maritime route and coastal settlements along the Pacific coast. This first expansion would have been followed by a terrestrial expansion through the Mac-Kenzie corridor in North America and continued to the south by land. Other proposals, including the entrance through the Atlantic Ocean bordering Greenland, the “Solutrean solution” proposed by Stanford and Bradley (2002), and the crossing of the North pole proposed by O’Rourke and Raff (2010), cannot be rejected, but if they occurred, they most likely involved fewer migrants.
The genetic characteristics of these initial populations have not been completely identified, but several studies in-dicate a wide initial diversity, as seen mainly in mitochon-drial DNA (mtDNA) studies (Tammet al., 2007; Fagundes et al., 2008; Malhiet al., 2010; Peregoet al., 2010; Yanget al., 2010; Bisso-Machadoet al., 2012). Part of the initial
variation could have been lost, as suggested by Cuiet al.
(2013) in an analysis of mtDNA from skeletal remains. This diversity can also be observed in the analysis of the Y chromosome (Schurr and Sherry, 2004; Bisso-Machadoet al., 2011, 2012). As for autosomes, a total of 678
micro-satellite markers, genotyped in 422 individuals from 24 North, Central and South American natives, were studied by Wanget al.(2007); 364,470 single nucleotide
polymor-phisms were examined in 52 Native American and 17 Sibe-rian groups by Reich et al. (2012). This second study
indicated the presence of at least three different streams of Asian gene flow in the prehistoric colonization of the Ame-ricas, a view suggested nearly three decades ago by Green-berget al.(1986).
Salzano and Bortolini (2002), based on several stud-ies, have estimated that approximately 45 million Native Americans were living in Latin America at the beginning of the European Conquest, but projections range from 30 to 90 million. This population, however, rapidly decreased as a consequence of epidemics and the violence occurring as
wars, massacres, and maltreatment (Pereña, 1992). As stated by Salzano and Callegari-Jacques (1988), native populations were in different phases of cultural and demo-graphic development at the onset of the European Con-quest. Sedentary communities in more densely populated regions suffered the structural impacts of epidemics and other factors most strongly, while many small groups be-came extinct. However, after this severe depopulation, Na-tive American populations recovered, and their present numbers (approximately 63 million, unpublished estimate) are higher than in the 16thcentury.
Africans
Most people from Africa were forced to migrate to America due to the slave trade, but Pedro Alonso Niño, Co-lumbus’s pilot, was the first African immigrant (Brawley, 2001). As early as 1518, the Spanish crown had issued the first license for slave traffic, while Portugal had established its own companies and colonies to capture slaves. The first captives apparently entered Brazil through Bahia in 1531 (Ramos, 1934). The trade started in the Caribbean region and soon afterwards extended to Central America and the north of Brazil; its prohibition occurred over a lengthy pro-cess from 1830 to 1870.
The origins of the slaves ranged from the Guinea coast to Mozambique. Rout (1976) defined four main re-gions: upper Guinea, lower Guinea, the Congo Delta and Angola, and Mozambique. The flow from each of these ar-eas varied over the long history of the slave trade and was also dependent on the nationality of the slave traders (Sal-zano and Bortolini, 2002).
The number of slaves brought to Latin America is dif-ficult to determine, and factors such as slave mortality dur-ing the journey, illegal traffic, and the lack of registration due to ship interference at sea only complicate this estima-tion. Reader (1998) approximated that nine million slaves were shipped across the Atlantic between 1452 and 1870.
Europeans
Estimating the number of Europeans who entered Latin America is a complex undertaking. McAdoo (1993), referring to immigrants to the United States, stated that “the waves of persons who came to these shores are a portion of American history that is too often hidden away, for it em-barrasses Americans,” and the same statement can be applied to Latin America. Moreover, this migrant flux con-tinued until relatively recently: the last wave occurred after World War II, and the origins of the migrants changed to in-clude the entire Mediterranean region as well as other Euro-pean countries, particularly those in Eastern Europe. It is reasonable to suggest that a new wave, involving mainly Africans and East Asians, has recently started to arrive to Latin America.
The numbers, origins and destinations of European migrants depended on the time of and reasons for the mi-gration. For example, during the 16th century, 300,000 people belonging to different economic and social levels left Spain to come to America and spread to different parts of the continent; however, this figure refers only to travel-ers, not to people who remained in the continent (Konetkze, 1991). The quantity of people entering America increased quickly, and as a result, Europeans and their descendants numbered 850,000 in 1650, 13,470,000 in 1825, and 221,160,000 in 1950, according to Rosenblat (1954).
History of the Admixture Process
The admixture process started soon after Christopher Columbus first disembarked at La Hispaniola (1492), as the 39 men he left on the island had sexual intercourse with the local Native American women (Mörner, 1967). Therefore, a maximum of roughly 21 generations of admixing may be established, with some variance due to region. Wanget al.
(2008), based on 13 mixed Latin American populations, es-timated that the average time since first admixture allowed for six to 14 generations, but these estimations excluded the Caribbean region, where the process began. Based on pedi-grees, Heyeret al.(1997) identified up to 19 generations, descended from males who lived in the 17thcentury.
While admixture at first involved primarily Spanish (or European) men and Native American women, it shortly expanded to include European or “criollo” (European de-scendants born in America) men and mixed women or mixed men and women. The process was complicated by the introduction of African slaves into America at the be-ginning of the 16thcentury. The legal status of Africans de-layed their admixture with other ethnic groups, but sexual intercourse between African men and Native American or mixed women, and later between African or African-des-cendent women and European or criollo men, was rela-tively frequent (Mörner, 1967).
The social, cultural, and economic characteristics of native populations, aspects of the European Conquest and Colonization, and the nature of the Europeans and Africans arriving at the continent undoubtedly influenced the
admix-ture process. For example, prehistoric America had great cultural and demographic heterogeneity. Salzano and Cal-legari-Jacques (1988) classified these populations into three stages: hunters and gatherers with incipient agricul-ture, with low fertility and mortality; sedentary and more advanced agriculturalists, with high fertility and high mor-tality; and populations living in densely inhabited areas, with high fertility and low mortality. Accordingly, the con-sequences of the Conquest and Colonization were different in relation to each stage; the last two were more affected by diseases and were more involved in the admixture process.
Clearly, more males than females migrated to Latin America, and the Spanish Crown encouraged unions be-tween European men and Native American women as a way to evangelize and/or obtain economic advantages; un-ions between Africans and any other group were prohib-ited. As Mörner (1967) has stated, “In a way, the Spanish Conquest of the Americas was a conquest of women”.
More recently, Latin American countries have ac-cepted intermarriage as legal, with some exceptions; the law against marriages with Chinese in Mexico is among the most recent bans (Mörner, 1967). “Mixed blood” offspring generally became an integral part of European family life, and a long tradition of contact exists between Africans and both Spanish and Portuguese persons. Moreover, a distinct Mestizo (mixed Native American and Iberian) identity emerged in some parts of Latin America, including Mexico and Brazil (Yinger, 1985). In the latter country, interethnic unions were even favored. The Marquis of Pombal, who governed Brazil in the middle of the 18thcentury, estab-lished that mixed citizens should receive equal treatment as unmixed ones regarding employment, honor and dignity (Rosenblat 1954).
Individually, people from the first generation of an admixture process will have entire chromosomes of a sin-gle origin, while the second generation will have chromo-somes containing blocks of different ancestry. As the process persists, these blocks of different origins will be-come smaller. Consequently, the chromosomes of people living in the present day show a complex mix of ancestry, depending on the number of generations of admixture, mar-riage patterns, and the characteristics of the mixed people involved in them.
The Genetic/Genomic Approach to Interethnic
Admixture
groups or in their genetic/genomic frequencies, and (b) the changes are due mainly to gene flow, not other evolutionary factors which may influence the estimates. Examples in-clude those of Chakraborty (1975, 1985), who used the gene identity method to incorporate fluctuations due to the size of the hybrid population; Bertorelle and Excoffier (1998), who added the changes that may have occurred in parentals and hybrids after the event of admixture; Wang (2003), who considered gene flow after the first event of ad-mixture; and McKeigue et al. (2000), who employed a
Bayesian approach to incorporate the effects of linkage and population structure.
Molecular approaches now allow researchers to sepa-rate maternal and paternal contributions (mitochondrial DNA, Y chromosome); to identify variation in all DNA re-gions (coding and noncoding, introns, pseudogenes, repeat sequences, regulatory elements); and to determine the ori-gin of chromosome segments depending on the ancestors’ origin. The degree of divergence among alleles (Bertorelle and Excoffier, 1998; Dupanloup and Bertorelle, 2001) and the genetic drift since admixture calculated using different approaches (Bayesian: Chikhiet al., 2001; maximum
like-lihood: Wang, 2003; and coalescence: Excoffier et al.,
2005) can now be considered. Molecular techniques have also improved the estimation of individual admixture, an approach initially proposed by Haniset al.(1986) to avoid
the variability among individuals due to recombination and independent loci assortment.
Ancestry Informative Markers (AIMs), that is, those with high discriminatory power due to large interethnic dif-ferences in frequencies, are also now being used, as sug-gested by Shriveret al.(1997, 2003) and Collins-Schramm et al.(2002).
Whole genome data sets are revealing complex sto-ries of divergence and admixture that are impossible to ob-tain using other approaches. For example, Harris and Nielsen (2013), using parent-offspring trios from the 1000 Genomes Project, were able to detect extensive gene flow between Africa and Europe after their populations di-verged; together with the ancient admixture into Europe, the results reveal a population structure that must be recon-sidered to construct more realistic models of the gene pools in these regions. In a more restricted analysis, Wanget al.
(2008) employed 678 autosomal and 29 X-chromosomal microsatellites to differentiate the Native American ances-try among Mestizos from 13 Latin American populations.
In the following sections, we provide detailed and specific information about continental ancestries. Because uniparental and X chromosome estimates generally overes-timate non-European contributions, and Y chromosomes the European influence, we concentrated our attention on autosomes. With the exception of the data for Uruguay, for which we wanted to construct a complete picture, protein markers, which have been adequately surveyed in previous
reviews (Sans, 2000; Salzano and Bortolini, 2002), are not considered here.
Actual Data, Middle America
Mexico
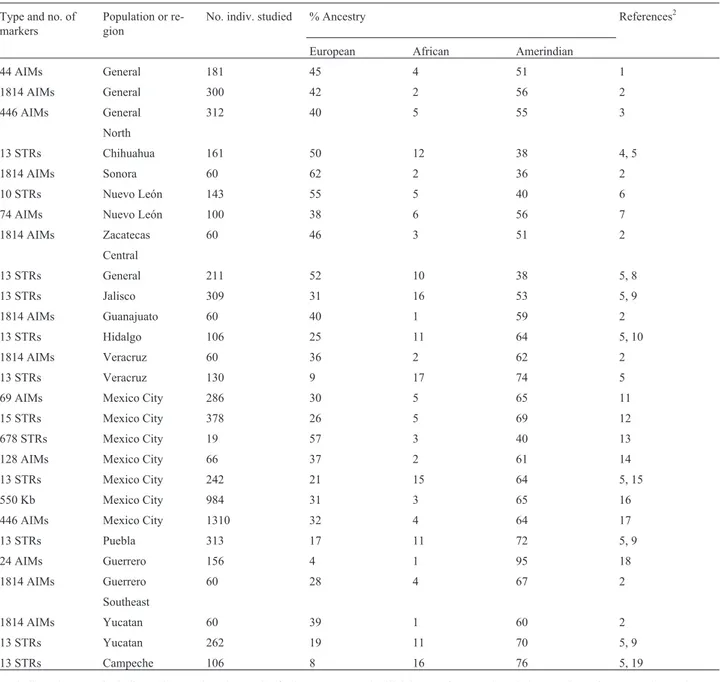
A total of 19 reports regarding molecular autosome estimates of parental continental ancestry in Mexican pop-ulations are presented in Table 1. Three of them concern the country in general, while 27 concern specific populations, with the large population of Mexico City heavily repre-sented (seven estimates). Amerindian ancestry is most prevalent (51% to 56%) in the three general estimates, fol-lowed by European ancestry (40% to 45%); the African share represents only 2% to 5%. The Amerindian contribu-tion is the highest in 22 (81%) of the 27 estimates.
Many cases of repeated sampling in the same popula-tion were recorded: for the general evaluapopula-tions, the percent-age differences are minimal (at most 6%), but for Nuevo León, Veracruz, Guerrero, and Yucatan (all sampled twice), the highest differences, generally involving the Eu-ropean fraction, are 17% to 28%. In Mexico City, the Euro-pean contribution was estimated as 21% to 32% in six of the seven reports, with the anomalous value of 57% obtained in a single sample of 19 subjects. European ancestry is most prevalent in the north (Chihuahua, 50%; Sonora, 62%; Nuevo León, 55%), but in a recent sample from Nuevo León and elsewhere in the country, Amerindian ancestry is dominant. The general conclusion, therefore, is that the Amerindian genes were victorious in the battle of survival over those of the Spanish Conquistadores!
Other Middle American countries
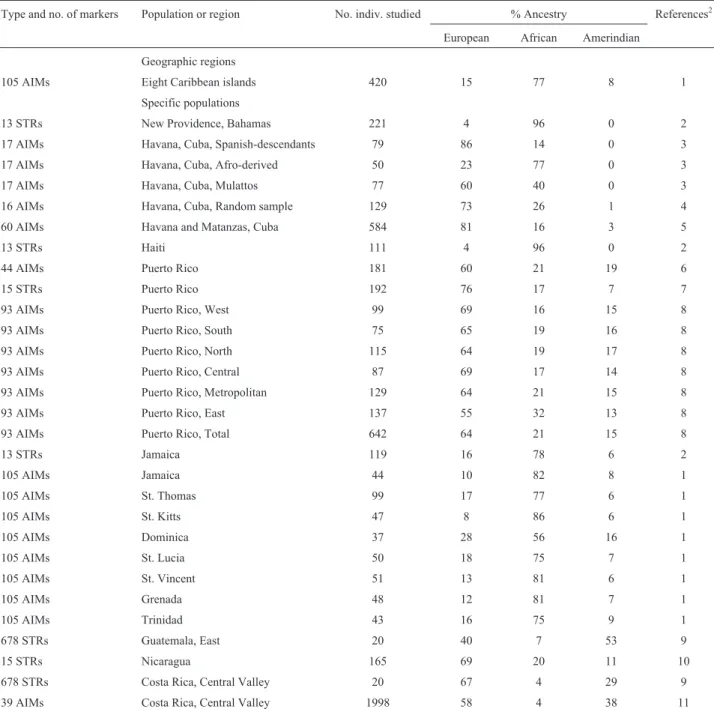
Table 2 presents the Middle American data excepting those of Mexico. Clear differences may be observed be-tween the areas: some show considerable African influence (Carib as a whole, 77%; Haiti, 96%; Jamaica, 78%-82%), others Spanish (Cuba, 73%-86%; Puerto Rico, 60%-76%, with some interregional variability; Nicaragua, 69%; Costa Rica, 58%-67%), and another Amerindian (Guatemala, 53%). In the Carib, the exception is Dominica, whose es-sentially trihybrid structure reflects the French (as opposed to Anglophone) influence throughout its history.
Actual Data, South America
Colombia
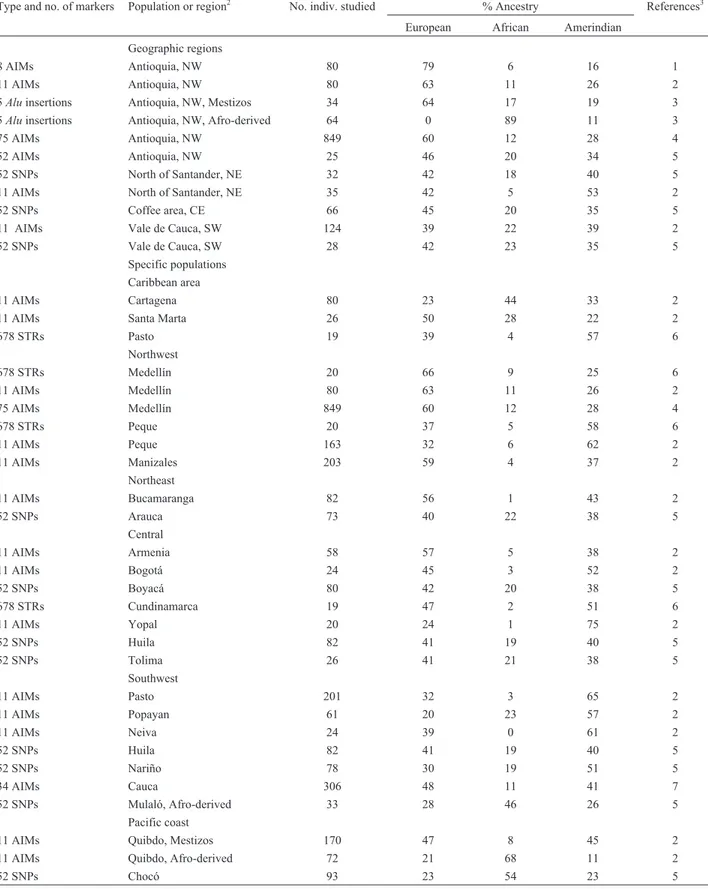
When the specific populations from the six consid-ered regions are examined, a wide array of continental par-entage frequencies are observed, preventing an arrival at general conclusions. The same is true for the three Afri-can-derived samples, which showed African contributions ranging from 89% (Antioquia) to 46% (Mulaló). This vari-ability may be real, but sampling biases, as well as the types and numbers of markers tested, should also be considered.
New, more specific and directed investigations should be undertaken.
Brazil
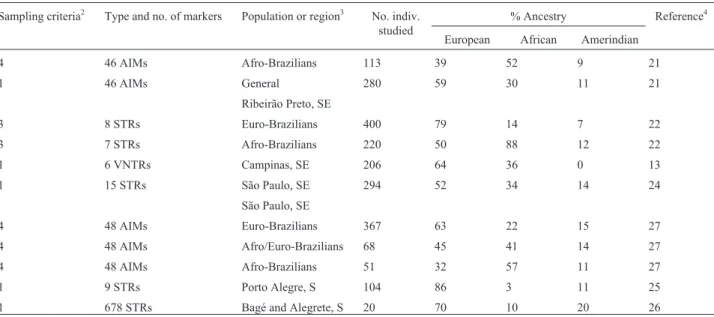
Brazil is the country from which the largest number of parental ethnic estimates were obtained. Table 4 lists 13 uniparental references (mtDNA only: 1; mtDNA+Y chro-mosome: 4; Y chromosome only: 8), two X-linked
refer-Table 1- Molecular autosome estimates of parental continental ancestry in different segments of the Mexican population1.
Type and no. of markers
Population or re-gion
No. indiv. studied % Ancestry References2
European African Amerindian
44 AIMs General 181 45 4 51 1
1814 AIMs General 300 42 2 56 2
446 AIMs General 312 40 5 55 3
North
13 STRs Chihuahua 161 50 12 38 4, 5
1814 AIMs Sonora 60 62 2 36 2
10 STRs Nuevo León 143 55 5 40 6
74 AIMs Nuevo León 100 38 6 56 7
1814 AIMs Zacatecas 60 46 3 51 2
Central
13 STRs General 211 52 10 38 5, 8
13 STRs Jalisco 309 31 16 53 5, 9
1814 AIMs Guanajuato 60 40 1 59 2
13 STRs Hidalgo 106 25 11 64 5, 10
1814 AIMs Veracruz 60 36 2 62 2
13 STRs Veracruz 130 9 17 74 5
69 AIMs Mexico City 286 30 5 65 11
15 STRs Mexico City 378 26 5 69 12
678 STRs Mexico City 19 57 3 40 13
128 AIMs Mexico City 66 37 2 61 14
13 STRs Mexico City 242 21 15 64 5, 15
550 Kb Mexico City 984 31 3 65 16
446 AIMs Mexico City 1310 32 4 64 17
13 STRs Puebla 313 17 11 72 5, 9
24 AIMs Guerrero 156 4 1 95 18
1814 AIMs Guerrero 60 28 4 67 2
Southeast
1814 AIMs Yucatan 60 39 1 60 2
13 STRs Yucatan 262 19 11 70 5, 9
13 STRs Campeche 106 8 16 76 5, 19
1As indicated, reports including uniparental markers only (for instance, Rangel-Villaloboset al., 2008; Guardado-Estradaet al., 2009; Salazar-Floreset
al., 2010; and Martinez-Cortés et al., 2009) were not included.
21. Chowdhryet al.(2006), Mexican recruited in the San Francisco Bay Area, USA; 2. Silva-Zolezziet al.(2009); 3. Galanteret al.(2012); 4. Martínez-Gonzalez et al. (2005); 5. Rubi-Castellanos et al. (2009a); 6. Cerda-Flores et al. (2002); 7. Martinez-Fierro et al. (2009); 8. Hernández-Gutiérrezet al.(2005); 9. Rubi-Castellanoset al.(2009b); 10. Gorostizaet al.(2007); 11. Martinez-Marignacet al.(2007); 12. Juárez-Cedillo et al.(2008); 13. Wanget al.(2008); 14. Kosoyet al.(2009), 26 individuals from Mexico City and 40 Mexicans from California, USA; 15. Luna-Vazquez
ences, and 27 references involving autosome markers. The data are subdivided into three sets: sociogeographic re-gions, Afro-Brazilian communities, and specific popula-tions.
Five sociogeographic regions are generally recog-nized by official censuses, according to a large number of criteria, and their ethnic ancestries vary as may be generally
expected from Brazilian history. More European influence is observed in the southeast and south (up to 89%), while the African contribution predominates in the northeast (maximum estimate 30%) and the Amerindian in the north (up to 19%). The center-west estimates show the highest re-semblance to the northern values (Table 4).
Table 2- Molecular autosome estimates of parental continental ancestry in different segments of the Middle American populations with the exception of
Mexico1.
Type and no. of markers Population or region No. indiv. studied % Ancestry References2
European African Amerindian
Geographic regions
105 AIMs Eight Caribbean islands 420 15 77 8 1
Specific populations
13 STRs New Providence, Bahamas 221 4 96 0 2
17 AIMs Havana, Cuba, Spanish-descendants 79 86 14 0 3
17 AIMs Havana, Cuba, Afro-derived 50 23 77 0 3
17 AIMs Havana, Cuba, Mulattos 77 60 40 0 3
16 AIMs Havana, Cuba, Random sample 129 73 26 1 4
60 AIMs Havana and Matanzas, Cuba 584 81 16 3 5
13 STRs Haiti 111 4 96 0 2
44 AIMs Puerto Rico 181 60 21 19 6
15 STRs Puerto Rico 192 76 17 7 7
93 AIMs Puerto Rico, West 99 69 16 15 8
93 AIMs Puerto Rico, South 75 65 19 16 8
93 AIMs Puerto Rico, North 115 64 19 17 8
93 AIMs Puerto Rico, Central 87 69 17 14 8
93 AIMs Puerto Rico, Metropolitan 129 64 21 15 8
93 AIMs Puerto Rico, East 137 55 32 13 8
93 AIMs Puerto Rico, Total 642 64 21 15 8
13 STRs Jamaica 119 16 78 6 2
105 AIMs Jamaica 44 10 82 8 1
105 AIMs St. Thomas 99 17 77 6 1
105 AIMs St. Kitts 47 8 86 6 1
105 AIMs Dominica 37 28 56 16 1
105 AIMs St. Lucia 50 18 75 7 1
105 AIMs St. Vincent 51 13 81 6 1
105 AIMs Grenada 48 12 81 7 1
105 AIMs Trinidad 43 16 75 9 1
678 STRs Guatemala, East 20 40 7 53 9
15 STRs Nicaragua 165 69 20 11 10
678 STRs Costa Rica, Central Valley 20 67 4 29 9
39 AIMs Costa Rica, Central Valley 1998 58 4 38 11
1As indicated, articles reporting protein markers (for instance, Ariaset al., 2002; Moreraet al., 2003) or uniparental markers only (Martínez-Cruzadoet
al., 2001; McLean Jret al.,2005; Castriet al., 2007; Benn Torreset al.,2007; Gaieskiet al.,2011) were not included. No specific prevalences were given
by Brycet al.(2010) or Moreno-Estradaet al.(2013).
Table 3- Molecular autosome estimates of parental continental ancestry in different segments of the Colombian populations1.
Type and no. of markers Population or region2 No. indiv. studied % Ancestry References3
European African Amerindian
Geographic regions
8 AIMs Antioquia, NW 80 79 6 16 1
11 AIMs Antioquia, NW 80 63 11 26 2
5Aluinsertions Antioquia, NW, Mestizos 34 64 17 19 3
5Aluinsertions Antioquia, NW, Afro-derived 64 0 89 11 3
75 AIMs Antioquia, NW 849 60 12 28 4
52 AIMs Antioquia, NW 25 46 20 34 5
52 SNPs North of Santander, NE 32 42 18 40 5
11 AIMs North of Santander, NE 35 42 5 53 2
52 SNPs Coffee area, CE 66 45 20 35 5
11 AIMs Vale de Cauca, SW 124 39 22 39 2
52 SNPs Vale de Cauca, SW 28 42 23 35 5
Specific populations Caribbean area
11 AIMs Cartagena 80 23 44 33 2
11 AIMs Santa Marta 26 50 28 22 2
678 STRs Pasto 19 39 4 57 6
Northwest
678 STRs Medellín 20 66 9 25 6
11 AIMs Medellín 80 63 11 26 2
75 AIMs Medellín 849 60 12 28 4
678 STRs Peque 20 37 5 58 6
11 AIMs Peque 163 32 6 62 2
11 AIMs Manizales 203 59 4 37 2
Northeast
11 AIMs Bucamaranga 82 56 1 43 2
52 SNPs Arauca 73 40 22 38 5
Central
11 AIMs Armenia 58 57 5 38 2
11 AIMs Bogotá 24 45 3 52 2
52 SNPs Boyacá 80 42 20 38 5
678 STRs Cundinamarca 19 47 2 51 6
11 AIMs Yopal 20 24 1 75 2
52 SNPs Huila 82 41 19 40 5
52 SNPs Tolima 26 41 21 38 5
Southwest
11 AIMs Pasto 201 32 3 65 2
11 AIMs Popayan 61 20 23 57 2
11 AIMs Neiva 24 39 0 61 2
52 SNPs Huila 82 41 19 40 5
52 SNPs Nariño 78 30 19 51 5
34 AIMs Cauca 306 48 11 41 7
52 SNPs Mulaló, Afro-derived 33 28 46 26 5
Pacific coast
11 AIMs Quibdo, Mestizos 170 47 8 45 2
11 AIMs Quibdo, Afro-derived 72 21 68 11 2
52 SNPs Chocó 93 23 54 23 5
1As indicated, articles reporting uniparental markers only (for instance Rodaset al., 2003; Yunis and Yunis, 2013) were not included. No specific prevalences were given by Brycet al.(2010).
2NW: Northwest; NE: Northeast; CE: Central; SW: Southwest.
31. Bedoyaet al.(2006); 2. Rojaset al.(2010); 3. Gómez-Pérezet al.(2010); 4. Duqueet al.(2012); 5. Ibarraet al.(2014), Porraset al.(2009); 6. Wanget
Table 4- Autosome estimates of parental continental ancestry in different segments of the Brazilian population1.
Sampling criteria2 Type and no. of markers Population or region3 No. indiv. studied
% Ancestry Reference4
European African Amerindian
Sociogeographic regions
North
1 12 STRs 253 68 14 18 1
1 28 AIMs 40 71 18 11 2
2 40 AIMs 203 70 11 19 3
Northeast
1 12 STRs 164 75 15 10 1
1 28 AIMs 40 77 14 9 2
2 40 AIMs 82 61 30 9 3
Center-West
1 12 STRs 286 71 18 11 1
1 28 AIMs 40 69 19 12 2
Southeast
1 12 STRs 109 75 18 7 1
1 28 AIMs 40 80 14 6 2
2 40 AIMs 264 74 19 7 3
South
1 12 STRs 226 81 11 8 1
1 28 AIMs 40 88 7 5 2
2 40 AIMs 189 78 13 9 3
1 48 AIMs 81 89 3 8 4
Afro-Brazilian communities
1 3 VNTRs, 3 STRs 2 communities, N 64 18 47 35 5
1 48 AIMs 5 communities, N 103 15 69 16 4
1 48 AIMs 7 communities, N 294 29 48 23 6
1 10 AIMs 3 communities, NE 207 39 49 12 7
1 14 STRs Marinhos, SE 60 33 67 0 8
1 48 AIMs 10 communities, SE 307 39 40 21 9
Specific populations
1 12 STRs Macapá, N 307 46 19 35 10
1 48 AIMs Macapá, N 130 50 29 21 11
1 13 STRs Belém, N 325 46 34 20 12
1 48 AIMs Belém, N 196 54 15 31 4
1 6 VNTRs São Luis, N 161 33 67 0 13
1 2 STRs, 2 VNTRs São Luis, N 177 42 19 39 14
1 9 STRs Maceió, NE 598 56 27 17 15
1 12 STRs Brasília, CW 153 67 21 12 16
1 28 AIMs Brasília, CW 200 77 14 9 17
1 11 STRs Belo Horizonte, SE 234 65 34 1 18
3 3 VNTRs, 2 STRs Rio de Janeiro, SE
3 blood groups Euro-Brazilians 81 67 21 12 19
4 40 AIMs Euro-Brazilians 107 86 7 7 20
3 3 VNTRs, 2 STRs Afro-Brazilians 69 39 49 12 19
3 blood groups
As a result of the present emphasis of the Brazilian government on positive actions in favor of previously dis-criminated African-derived people, many rural areas where escaped slaves found refuge are now being demarcated to ensure property rights for their descendants. Several of these communities have been studied regarding parental markers (Table 4), and the results show high heterogeneity among them. These communities have not remained iso-lated from persons of other ethnic backgrounds, as illus-trated by the fact that in four of the six estimates, their African contributions amount to less than half of the total parental ancestry.
Twelve specific populations are listed in Table 4. The main results can be summarized as follows: (a) repeated sampling in both Macapá and Brasília yielded less than 10% average differences; the discrepant values obtained in São Luís are most likely due to the nature and number of the markers used; (b) in Rio de Janeiro, Ribeirão Preto and São Paulo, Afro-Brazilians and Euro-Brazilians were consid-ered separately; the sampling differences in Rio de Janeiro were not high, but the differences between Rio de Janeiro, Ribeirão Preto and São Paulo in terms of the African ances-try in Afro-Brazilians are large; and (c) differences in the specific and global regional ethnic parental estimates were
most marked for São Luís [probable reason indicated in (a)].
Although in population terms the morphological and genetic/genomic evaluations generally agree, wide vari-ability exists for individual, personal estimates. This obser-vation should be expected due to the high frequency of interethnic unions that occurred in the past and that are likely even more prevalent in the present. The implication for the implementation of positive actions is obvious: it is impossible to establish objective, specific criteria of ethnic classification to screen potential candidates for a program. These programs must therefore rely on self-classification, disregarding possible errors in favor of the general socio-economic improvement of the minorities considered.
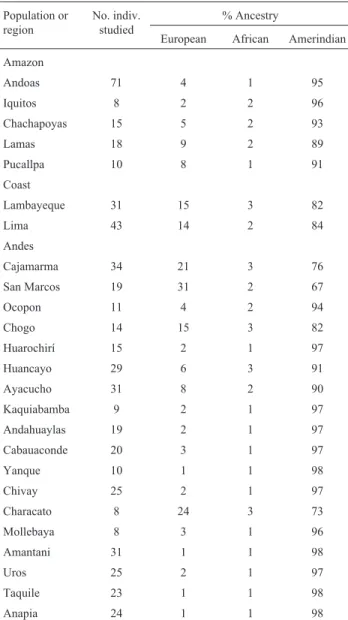
Peru
The extensive study conducted by Sandoval et al.
(2013) using 40 AIMs provides a good overall estimate of the degree of interethnic admixture present in the popula-tions of the three main geographical regions of the country (Table 5). Overall, non-Amerindian European ancestries varied from 1% to 31%, while the African contribution was only 1% to 3%. The two coastal populations sampled con-tain 14% to 15% European admixture, while much lower
Sampling criteria2 Type and no. of markers Population or region3 No. indiv. studied
% Ancestry Reference4
European African Amerindian
4 46 AIMs Afro-Brazilians 113 39 52 9 21
1 46 AIMs General 280 59 30 11 21
Ribeirão Preto, SE
3 8 STRs Euro-Brazilians 400 79 14 7 22
3 7 STRs Afro-Brazilians 220 50 88 12 22
1 6 VNTRs Campinas, SE 206 64 36 0 13
1 15 STRs São Paulo, SE 294 52 34 14 24
São Paulo, SE
4 48 AIMs Euro-Brazilians 367 63 22 15 27
4 48 AIMs Afro/Euro-Brazilians 68 45 41 14 27
4 48 AIMs Afro-Brazilians 51 32 57 11 27
1 9 STRs Porto Alegre, S 104 86 3 11 25
1 678 STRs Bagé and Alegrete, S 20 70 10 20 26
1Additional information based on uniparental or X-linked markers can be found as follows: (a) mtDNA only: Carvalhoet al.(2008); (b) mtDNA plus Y-chromosome: RibeirodosSantoset al.(2002), Marreroet al.(2005, 2007), Hünemeieret al.(2007), Guerreiro-Junioret al.(2009); (c) Y-chromosome
only: Carvalho-Silvaet al.(2001), Ferreiraet al.(2006), Silvaet al.(2006), Ribeiroet al.(2009), Carvalhoet al.(2010), Palhaet al.(2011), Ribeiroet al.
(2011), Francezet al.(2012); (d) X-linked only: Ribeiro-Rodrigueset al(2009), Resqueet al.(2010).
2Key to sampling criteria: 1. Random; 2. Total ancestry, proportion of a given ancestry in a given color category multiplied by the official census
informa-tion about the proporinforma-tion of that color category in the specified region; 3. Morphological evaluainforma-tion; and 4. Self-reported ethnicity. 3N: North; NE: Northeast; CW: Center-West; SE: Southeast; and S: South.
4References: 1. Callegari-Jacqueset al.(2003); 2. Linset al.(2010); 3. Penaet al.(2011); 4. Santoset al.(2010); 5. Vallinotoet al.(2003); 6. Macielet al. (2011); 7. Amorimet al.(2011); 8. Scliaret al.(2009); 9. Kimuraet al.(2013); a subset of these communities was also studied for twoAluinsertions, and the values used to estimate parental contributions (Cotrimet al., 2004), but the results obtained showed inconsistencies among the populations and were not considered; 10. Francezet al.(2011a); 11. Francezet al.(2011b); 12. Ribeiro-Rodrigueset al.(2007); 13. Ramoset al.(2004); 14. Ferreiraet al.
(2005); 15. Ferreira da Silvaet al.(2002); 16. Godinhoet al.(2008); 17. Linset al.(2011); 18. Scliaret al.(2009); 19. Palatniket al.(2002); 20.
Suarez-Kurtzet al.(2007); 21. Mantaet al.(2013); 22. Ferreiraet al.(2006); 23. Munizet al.(2008); 24. São-Bentoet al.(2008); 25. Leiteet al.(2003); 26. Wanget al.(2008); 27. Cardenaet al.(2013).
frequencies occur in the Amazon (2% to 9%). Some hetero-geneity is observed in the Andes, with three of the four northern populations (San Marcos, Cajamarca, Chogo) psenting only 67%, 76%, and 82% Amerindian ancestry, re-spectively. In the extreme south, the results from Characato also show evidence of more marked admixture (73% Am-erindian heritage); but the 14 other populations sampled yielded high values (90% to 98%) for Amerindian gene pools.
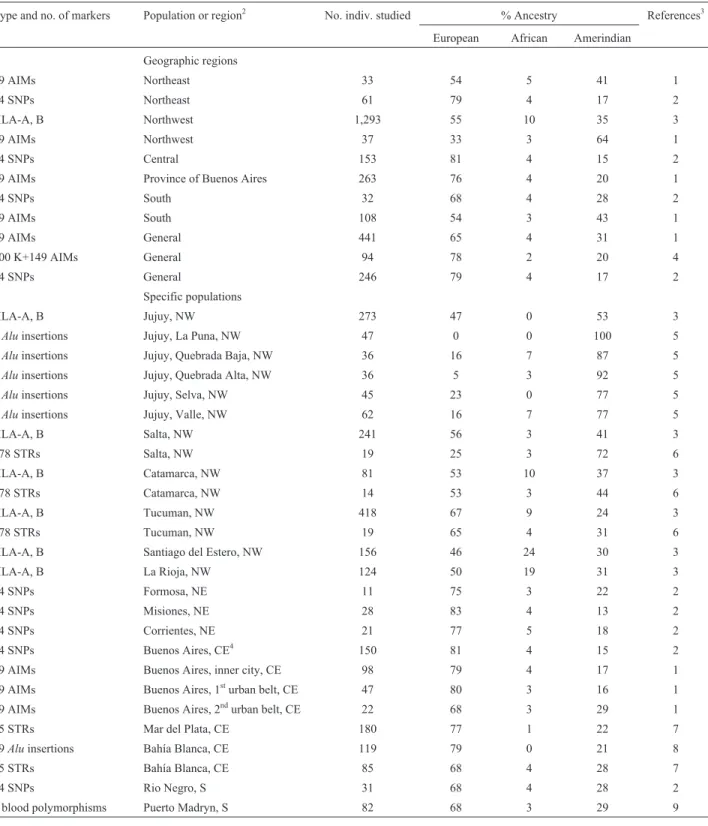
Argentina
Nine studies involving autosomal molecular markers were considered for Argentina, and the results are given in Table 6. For the country as a whole, the European influence
(65%-79%) is dominant, but the Amerindian contribution (17%-31%) is also important. The African influence, how-ever, is minimal (2%-4%). Considering the four geograph-ical regions of the country, somewhat different estimates were obtained for the northeast and northwest, but the eval-uations for the center and south were in general agreement.
Turning to specific populations, a geographical pat-tern emerges in relation to Amerindian parentage, with higher frequencies observed in the northwest and south. Within the northwest region, there is ample variability (33%-100%) of the Amerindian contribution in the Prov-ince of Jujuy, but a rough gradient of decreasing Amerin-dian influence is generally observed from north to south. The values in the northeast and center are similar; in the Buenos Aires megalopolis, the Amerindian percentages are modest (16%-17%) in the inner and first urban belt, but the contribution increases to 29% in the second urban belt, where migrants and people of generally low socioeconomic status live. The African contribution is low but detectable in most of the regions and populations studied, reaching its maximum in Santiago del Estero and La Rioja.
Uruguay
Uruguay is unique among Latin American countries in that it has no Native American or African-descendant communities. This fact has shaped its national identity, which at least until the 1980s was considered to be almost strictly European. This view has also affected population genetics studies. In 1986, however, the first analysis of the Mongolian spot trait showed a frequency that was much higher (42%) than that expected in a mostly European pop-ulation (Sanset al., 1986). This initial study encouraged
ad-ditional enquiries into the Uruguayan identity. One of the first of these studies indicated that Montevideo (in the south) and Tacuarembó (in the northeast) had differences between them: while the African and Amerindian contribu-tions in Montevideo were estimated as 7% and 1%, respec-tively, the same contributions in Tacuarembó were 15% and 20%, respectively (Sanset al., 1997). These data
dem-onstrated not only a clear non-European contribution to an-cestry in the northeast but also population heterogeneity in this small country (176,215 km2, 3,286,314 inhabitants, ac-cording to the 2011 National Census, INE, 2012). This esti-mation was based on classical (blood groups, electropho-retic proteins) markers, as was another study in Cerro Largo, in the northeast, that showed 10% Native American and 8% African ancestry contributions (Sanset al., 2006).
These data are in agreement with those obtained from a study using nDNA, which estimated 6% African and 10% Native American contributions for the whole country (Hi-dalgoet al., 2005).
Studies in self-defined African descendants, how-ever, have presented very different results: African genes contribute nearly half of the ancestry to these populations, while Native American contributions vary from 15% in the
Table 5- Molecular autosome estimates of parental continental ancestry
in different segments of the Peruvian population1.
Population or region
No. indiv. studied
% Ancestry
European African Amerindian
Amazon
Andoas 71 4 1 95
Iquitos 8 2 2 96
Chachapoyas 15 5 2 93
Lamas 18 9 2 89
Pucallpa 10 8 1 91
Coast
Lambayeque 31 15 3 82
Lima 43 14 2 84
Andes
Cajamarma 34 21 3 76
San Marcos 19 31 2 67
Ocopon 11 4 2 94
Chogo 14 15 3 82
Huarochirí 15 2 1 97
Huancayo 29 6 3 91
Ayacucho 31 8 2 90
Kaquiabamba 9 2 1 97
Andahuaylas 19 2 1 97
Cabauaconde 20 3 1 97
Yanque 10 1 1 98
Chivay 25 2 1 97
Characato 8 24 3 73
Mollebaya 8 3 1 96
Amantani 31 1 1 98
Uros 25 2 1 97
Taquile 23 1 1 98
Anapia 24 1 1 98
south to 25% in the northeast and 42% in the south (Sanset al., 2002, Da Luzet al., 2010).
Several studies have focused on uniparental markers, especially mtDNA. The Native American maternal
contri-Table 6- Molecular autosome estimates of parental continental ancestry in different segments of the Argentinian population1.
Type and no. of markers Population or region2 No. indiv. studied % Ancestry References3
European African Amerindian
Geographic regions
99 AIMs Northeast 33 54 5 41 1
24 SNPs Northeast 61 79 4 17 2
HLA-A, B Northwest 1,293 55 10 35 3
99 AIMs Northwest 37 33 3 64 1
24 SNPs Central 153 81 4 15 2
99 AIMs Province of Buenos Aires 263 76 4 20 1
24 SNPs South 32 68 4 28 2
99 AIMs South 108 54 3 43 1
99 AIMs General 441 65 4 31 1
100 K+149 AIMs General 94 78 2 20 4
24 SNPs General 246 79 4 17 2
Specific populations
HLA-A, B Jujuy, NW 273 47 0 53 3
8Aluinsertions Jujuy, La Puna, NW 47 0 0 100 5
8Aluinsertions Jujuy, Quebrada Baja, NW 36 16 7 87 5
8Aluinsertions Jujuy, Quebrada Alta, NW 36 5 3 92 5
8Aluinsertions Jujuy, Selva, NW 45 23 0 77 5
8Aluinsertions Jujuy, Valle, NW 62 16 7 77 5
HLA-A, B Salta, NW 241 56 3 41 3
678 STRs Salta, NW 19 25 3 72 6
HLA-A, B Catamarca, NW 81 53 10 37 3
678 STRs Catamarca, NW 14 53 3 44 6
HLA-A, B Tucuman, NW 418 67 9 24 3
678 STRs Tucuman, NW 19 65 4 31 6
HLA-A, B Santiago del Estero, NW 156 46 24 30 3
HLA-A, B La Rioja, NW 124 50 19 31 3
24 SNPs Formosa, NE 11 75 3 22 2
24 SNPs Misiones, NE 28 83 4 13 2
24 SNPs Corrientes, NE 21 77 5 18 2
24 SNPs Buenos Aires, CE4 150 81 4 15 2
99 AIMs Buenos Aires, inner city, CE 98 79 4 17 1
99 AIMs Buenos Aires, 1sturban belt, CE 47 80 3 16 1
99 AIMs Buenos Aires, 2ndurban belt, CE 22 68 3 29 1
15 STRs Mar del Plata, CE 180 77 1 22 7
19Aluinsertions Bahía Blanca, CE 119 79 0 21 8
15 STRs Bahía Blanca, CE 85 68 4 28 7
24 SNPs Rio Negro, S 31 68 4 28 2
9 blood polymorphisms Puerto Madryn, S 82 68 3 29 9
1Earlier studies by Avena and coworkers that included protein markers only were not included here. 2NE: Northeast; NW: Northwest; CE: Central; S: South.
31. Avenaet al.(2012); 2. Corachet al.(2010); 3. Alfaroet al.(2005); 4. Seldinet al.(2008); 5. Gómez-Pérezet al.(2011); 6. Wanget al.(2008); 7. Parolinet al.(2013a); 8. Resanoet al.(2007); 9. Parolinet al.(2013b).
bution estimated in all of these studies is higher than that es-timated by paternal genes (Y chromosome) or autosomes, reaching 62% in Tacuarembó (Bonillaet al., 2004) and
de-creasing to 21% in Montevideo (Gascueet al., 2005). For
the whole country, the maternal Native American ancestry was determined as 34% (recalculated from Paganoet al.,
2005a). Self-identified Basque descendants with Basque paternal surnames living in Trinidad, in the southwest, also showed high levels (20%) of Native American maternal an-cestry (Sanset al., 2011). The African contribution is
rela-tively less, but the maternal contribution of this ancestry was estimated as 17% in Tacuarembó (Bonillaet al., 2004)
and 21% in Cerro Largo (Sanset al., 2006). Self-defined
African descendants presented 52% African and 29% Na-tive ancestry (Sanset al., 2002). Y-chromosomal data
indi-cated much lower African (less than 1%) and Native American (less than 8%) contributions (Bertoni et al.,
2005, Paganoet al., 2005b).
Genealogical data have also been used to better un-derstand parental contributions for Basque descendants (Sanset al., 2011), people from Santo Domingo de Soriano
in the west (Barreto, 2011), and Canarians in Canelones, close to Montevideo (Barreto, 2008).
Recently, genetic or multifactorial diseases related to or influenced by ethnic ancestry have attracted attention. For hemoglobinopathies, the presence of 0.8% (2.2% in in-dividuals with declared African ancestry) HbS, 1.2% of the –a3.7mutation ina-thalassemia, and 0.25% of theb0codon 39b-thalassemia in Montevideo indicated the influence of African and Mediterranean ancestries (Da Luzet al., 2013).
Other diseases for which gene frequencies are being inves-tigated are diabetes (Mimbacaset al., 2004), breast cancer
and melanoma (Cappettaet al., unpublished, and studies in
progress).
The genetic studies performed in Uruguay have had two important outcomes. First was their contribution to the change in Uruguayan national identity, a process that started in the 1980s based on historical, demographic, and anthropological information (Verdesio, 1992; Viñar, 1992; Demasi, 1995), as well as ethnic movements (associations such as “Mundo Afro” or “Asociación de Descendientes de Indígenas Charrúas,” both founded in 1989, and others, which appeared more recently). This “new” identity cur-rently relates Uruguay to other Latin American countries rather than to Europe exclusively (Sans, 2011). Second was their contribution to the search for diseases associated with non-European ancestries, linking alleles to population ori-gins. This latter contribution is now demonstrating its full potential, and ancestry studies are being incorporated to bolster analyses of disease presence, frequency and prog-nosis.
Other South American countries
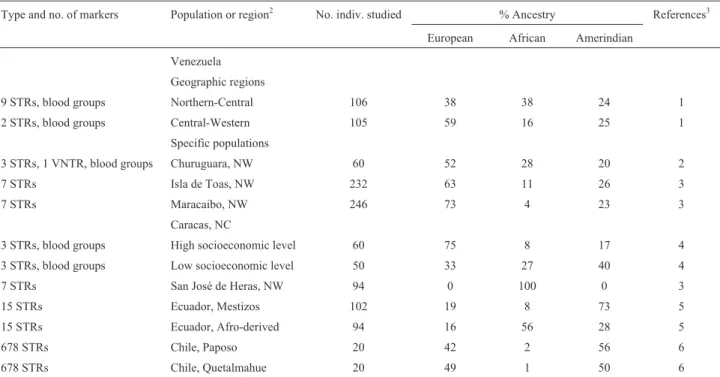
The results for three previously undiscussed South American countries are displayed in Table 7. For
Vene-zuela, the data of the geographic regions indicated a basi-cally trihybrid distribution, with similar contributions of European, African and Amerindian parentages. However, differences emerge when specific populations are consid-ered, with higher (52% to 73%) European fractions. The exception is an African-derived isolate in the state of Zulia (100% African). Additionally, a sample from people of lower socioeconomic status in Caracas shows higher fre-quencies of African and Amerindian parentages than one from people of a higher socioeconomic level (27% vs 8% and 40% vs 17%, respectively). This result reflects the stratification that has occurred over centuries of ethnic dis-crimination across Latin America. Two samples from Ec-uador show a high (73%) Amerindian contribution to Mestizos, while the Afro-derived subjects present only an approximately half (56%) African parentage. The two Chil-ean populations surveyed indicate a basically dihybrid (Eu-ropean/Amerindian) composition.
Actual data - Overview
The data surveyed generally confirm previous histori-cal and nonmolecular evaluations. A marked Amerindian influence exists in Mexican, Guatemalan, Peruvian, and Ecuadoran populations, while European ancestries are more prevalent in Cuba, Puerto Rico, Nicaragua, Costa Rica, Argentina, and Uruguay. For Venezuela, the Euro-pean, Amerindian, and African fractions are similar, while for Colombia, high interpopulation variability is observed. The ethnic distribution in Brazil follows a geographical pattern, with European influence more prevalent in the southeast and south, African in the northeast, and Amerin-dian in the north. For Chile, the AmerinAmerin-dian and European contributions are equivalent.
The data from which these general conclusions were obtained, however, are uneven and of varying quality. The following problems were noted: (a) dissimilar amounts of coverage for the different countries, some of which were not represented at all; (b) sample representativeness in na-ture and size; (c) types and number of markers used; (d) phenotypic characterization of the subjects sampled; and (e) methods of quantitative ancestry determination. Only a systematic, comprehensive approach, ideally involving multinational teams of researchers, will yield a more de-tailed picture of the highly complex process of admixture and its social implications.
Application - Admixture Mapping
cancer, in comparison to populations of European ancestry (Priceet al., 2007; Winkleret al., 2010).
This method has both advantages and disadvantages in comparison to dense, whole-genome scans. The advan-tages include (a) lower genotyping costs; (b) the use of dis-ease cases only, avoiding the noise introduced by inade-quate controls; and (c) the characteristics of the admixture signal, which reduce the number of hypotheses tested. The disadvantages include (a) possible differences between the estimated ancestry and the frequencies of a given disease allele; (b) imperfect power to estimate local ancestry; and (c) the need for the fine mapping of the fraction of admix-ture that successfully identifies a disease locus.
Panels for these analyses involving Mexican Ameri-cans have been developed by Collins-Schramm et al.
(2004; 100 AIMs) and Tianet al.(2007; 5,287 AIMs), and
similar panels have been developed for Hispanic/Latino populations in general by Priceet al.(2007; 1,649 AIMs)
and Maoet al.(2007; 2,120 AIMs). Examples of the
speci-ficity of this approach include: (a) Priceet al.(2007), who
estimated that in Latinos and Mexicans from Los Angeles, where Native American ancestry is close to 50%, admix-ture mapping should be 15% to 30% more powerful per sample than in Colombians or Brazilians, who have lower percentages of this ancestry; and (b) Fejermanet al.(2012),
who identified a region in chromosome 6 related to breast cancer susceptibility in Latinas. A detailed review of the
studies in this area, however, is outside the scope of the present work.
Acknowledgments
The research in Porto Alegre was financed by the Conselho Nacional de Desenvolvimento Científico e Tec-nológico (CNPq) and the Fundação de Amparo à Pesquisa do Estado do Rio Grande do Sul, Programa de Apoio a Núcleos de Excelência (FAPERGS/PRONEX).
References
Acosta Loyo M, Castro de Guerra D, Izaguirre MH and Rodri-guez-Larralde A (2004) Admixture estimates for Churu-guara, a Venezuelan town in the state of Falcón. Ann Hum Biol 31:669-680.
Alfaro EL, Dipierri JE, Gutierrez NI and Vullo CM (2005) Ge-netic structure and admixture in urban populations of the Ar-gentine North West. Ann Hum Biol 32:724-737.
Amorim CEG, Gontijo CC, Falcão-Alencar G, Godinho NMO, Toledo RCP, Pedrosa MAF, Luizon MR, Simões AL, Klau-tau-Guimarães MN and Oliveira SF (2011) Migration in Afro-Brazilian rural communities: Crossing demographic and genetic data. Hum Biol 83:509-521.
Arias TD, Castro E, Ruiz E, Barrantes R and Jorge-Nebert L (2002) La mezcla racial de la población panameña. Socio-economic and nutritional factors account for the association of gastric cancer with Amerindian ancestry in a Latin Amer-ican admixed population. Rev Med Panamá 27:5-7.
Table 7- Molecular autosome estimates of parental continental ancestry in populations from three South American countries1.
Type and no. of markers Population or region2 No. indiv. studied % Ancestry References3
European African Amerindian
Venezuela Geographic regions
9 STRs, blood groups Northern-Central 106 38 38 24 1
2 STRs, blood groups Central-Western 105 59 16 25 1
Specific populations
3 STRs, 1 VNTR, blood groups Churuguara, NW 60 52 28 20 2
7 STRs Isla de Toas, NW 232 63 11 26 3
7 STRs Maracaibo, NW 246 73 4 23 3
Caracas, NC
3 STRs, blood groups High socioeconomic level 60 75 8 17 4
3 STRs, blood groups Low socioeconomic level 50 33 27 40 4
7 STRs San José de Heras, NW 94 0 100 0 3
15 STRs Ecuador, Mestizos 102 19 8 73 5
15 STRs Ecuador, Afro-derived 94 16 56 28 5
678 STRs Chile, Paposo 20 42 2 56 6
678 STRs Chile, Quetalmahue 20 49 1 50 6
1As indicated, articles reporting uniparental markers only (for instance, Cifuenteset al., 2004; Castro de Guerraet al., 2011; Gómez-Carballaet al., 2012) were not included. No specific prevalences were given by Brycet al.(2010).
2NE: Northeast; NW: Northwest; NC: Northern-Central.
Avena S, Via M, Pérez-Stable EJ, Gignoux CR, Dejean C, Hunts-man S, Torres-Mejía G, Dutil J, Matte JL, BeckHunts-man K,et al.
(2012) Heterogeneity in genetic admixture across different regions of Argentina. PLoS One 7:e34695.
Barreto I (2008) Canarios de Ayer La Inmigración Canaria en el Uruguay. Intendencia de Canelones, Montevideo, 97 pp. Barreto I (2011) Estudio Biodemográfico de la Población de Villa
Soriano, Departamento de Soriano, Uruguay. Viblioteca-plural, Montevideo, 156 pp.
Bedoya G, Montoya P, García J, Soto I, Bourgeois S, Carvajal L, Labuda D, Alvarez V, Ospina J, Hedrick PW,et al.(2006)
Admixture dynamics in Hispanics: A shift in the nuclear ge-netic ancestry of a South American population isolate. Proc Natl Acad Sci USA 103:7234-7239.
Benn Torres J, Kittles RA and Stone AC (2007) Mitochondrial and Y chromosome diversity in the English-speaking Carib-bean. Ann Hum Genet 71:782-790.
Benn Torres J, Stone AC and Kittles R (2013) An anthropological perspective on creolization in the Anglophone Caribbean. Am J Phys Anthropol 151:135-143.
Bernstein F (1931) Verteilung der Blutgruppen und ihre anthro-pologische Bedeutung. In: Comit Ital Studio Problemi della Populazione, Rome, pp 227-243.
Bertoni B, Jin L, Chakraborty R and Sans M (2005) Directional mating and a rapid male population expansion in a hybrid Uruguayan population. Am J Hum Biol 17:801-808. Bertorelle G and Excoffier L (1998) Inferring admixture
propor-tions from molecular data. Mol Biol Evol 15:1298-1311. Bisso-Machado R, Jota MS, Ramallo V, Paixão-Côrtes VR,
La-cerda DR, Salzano FM, Bonatto SL, Santos FR and Bortolini MC (2011) Distribution of Y-chromosome Q lineages in Native Americans. Am J Hum Biol 23:563-566.
Bisso-Machado R, Bortolini MC and Salzano FM (2012) Uni-parental genetic markers in South Amerindians. Genet Mol Biol 35:365-387.
Bonilla C, Bertoni B, Gonzalez S, Cardoso H, Brum-Zorrilla N and Sans M (2004) Substantial Native American female contribution to the population of Tacuarembo, Uruguay, re-veals past episodes of sex-biased gene flow. Am J Hum Biol 16:289-297.
Bonilla C, Gutiérrez G, Parra EJ, Kline C and Shriver MD (2005) Admixture analysis of a rural population of the state Guer-rero, Mexico. Am J Phys Anthropol 128:861-869.
Brawley BG (2001) A Social History of the American Negro. Do-ver Publ, Mineola, 420 pp.
Bryc K, Velez C, Karafet T, Moreno-Estrada A, Reynolds A, Auton A, Hammer M, Bustamante CD and Ostrer H (2010) Genome-wide patterns of population structure and admix-ture among Hispanic/Latino populations. Proc Natl Acad Sci USA 107(Suppl 2):8954-8961.
Callegari-Jacques SM, Grattapaglia D, Salzano FM, Salamon S, Crossetti SG, Ferreira ME and Hutz MH (2003) Historical genetics: Spatiotemporal analysis of the formation of the Brazilian population. Am J Hum Biol 15:824-834. Cardena MMSG, Ribeiro-dos-Santos A, Santos S, Mansur AJ,
Pereira AC and Fridman C (2013) Assessment of the rela-tionship between self-declared ethnicity, mitochondrial haplogroups and genomic ancestry in Brazilian individuals. PLoS One 8:e62005.
Carvalho BM, Bortolini MC, Santos SEB and Ribeiro-dos-Santos AKC (2008) Mitochondrial DNA mapping of
social-bio-logical interactions in Brazilian Amazonian African-des-cendant populations. Genet Mol Biol 31:12-22.
Carvalho M, Brito P, Lopes V, Andrade L, Anjos MJ, Corte Real F and Gusmão L (2010) Analysis of paternal lineages in Bra-zilian and African populations. Genet Mol Biol 33:422-427. Carvalho-Silva DR, Santos FR, Rocha J and Pena SDJ (2001) The
phylogeography of Brazilian Y-chromosome lineages. Am J Hum Genet 68:281-286.
Castri K, Otárola F, Blell M, Ruiz E, Barrantes R, Luiselli D, Pettener D and Madrigal L (2007) Indentured migration and differential gender gene flow: The origin and evolution of the East-Indian community of Limón, Costa Rica. Am J Phys Anthropol 134:175-189.
Castro de Guerra D, Figuera Pérez C, Izaguirre MH, Arroyo Barahona EA, Rodríguez Larralde A and De Lugo MV (2011) Gender differences in ancestral contribution and ad-mixture in Venezuelan populations. Hum Biol 83:345-361. Cerda-Flores RM, Budowle B, Jin L, Barton SA, Deka R and
Chakraborty R (2002) Maximum likelihood estimates of ad-mixture in northeastern Mexico using 13 short tandem re-peat loci. Am J Hum Biol 14:429-439.
Chakraborty R (1975) Estimation of race admixture: A new method. Am J Phys Anthropol 42:93-102.
Chakraborty R (1985) Gene identity in racial hybrids and estima-tion of admixture rates. In: Neel JB and Ahuja Y (eds) Ge-netic Microdifferentiation in Man and other Animals. Indian Anthropological Association, Delhi, pp 171-180.
Chakraborty R and Weiss KM (1988) Admixture as a tool for finding linked genes and detecting that difference from allelic association between loci. Proc Natl Acad Sci USA 85:9119-9123.
Chikhi L, Bruford MW and Beaumont MA (2001) Estimation of admixture proportions: A likelihood-based approach using Markov chain Monte Carlo. Genetics 158:1347-1362. Chowdhry S, Coyle NE, Tang H, Salavi K, Lind D, Clark SL, Tsai
H-J, Naqvi M, Phong A, Ung N,et al.(2006) Population stratification confounds genetic association studies among Latinos. Hum Genet 118:652-664.
Cifuentes L, Morales R, Sepúlveda D, Jorquera H and Acuña M (2004) DYS19 and DYS199 loci in a Chilean population of mixed ancestry. Am J Phys Anthropol 125:85-89.
Cintado A, Companioni O, Nazabal M, Camacho H, Ferrer A, Fernandez de Cossio ME, Marrero A, Ale M, Villarreal A,et al.(2009) Admixture estimates for the population of Havana City. Ann Hum Biol 36:350-360.
Collins-Schramm HE, Kittles RA, Operario DJ, Weber JL, Criswell LA, Cooper RS and Seldin MF (2002) Markers that discriminate between European and African ancestry show limited variation within Africa. Hum Genet 111:566-569. Collins-Schramm HE, Chima B, Morii T, Wah K, Figueroa Y,
Criswell LA, Hanson RL, Knowler WC, Silva G, Belmont JW,et al.(2004) Mexican American ancestry-informative
markers: Examination of population structure and marker characteristics in European Americans, Mexican Ameri-cans, Amerindians and Asians. Hum Genet 114:263-271. Corach D, Lao I, Bobillo C, van der Gaag K, Zuniga S, Vermeulen
M, van Duijn K, Goedbloed M, Vallone PM, Parson W,et al. (2010) Inferring continental ancestry of Argentinians
Córdoba L, García J, Hoyos LS, Duque C, Rojas W, Carvajal S, Escobar LF, Reyes I, Cajas N, Sánchez A, et al. (2012) Composición genética de una población del suroscidente de Colombia. Rev Col Antropol 48:21-48.
Cotrim NH, Auricchio MTBM, Vicente JP, Otto PA and Mingro-ni-Netto RC (2004) PolymorphicAluinsertions in six
Bra-zilian African-derived populations. Am J Hum Biol 16:264-277.
Cui Y, Lindo J, Hughes CE, Johnson JW, Hernandez AG, Kemp BM, Ma J, Cunningham R, Petzelt B, Mitchell J, et al.
(2013) Ancient DNA analysis of mid-Holocene individuals from the Northwest Coast of North America reveals differ-ent evolutionary paths for mitogenomes. PLoS One 8:e66948.
Da Luz J, Kimura EM, Costa FF, Sonati MF and Sans M (2010) Beta-globin gene cluster haplotypes in Afro-Uruguayans from two geographical regions (South and North). Am J Hum Biol 22:124-128.
Da Luz JA, Avila A, Icasuriaga S, Gongóra M, Castillo L, Serrón A, Kimura EM, Costa FF, Sans M and Sonati MF (2013) Frequency and spectrum of hemoglobinopathy mutations in a Uruguayan pediatric population. Genet Mol Biol 36:316-322.
Demasi C (1995) La dictadura militar: Un tema pendiente. In: Rico A (ed) Uruguay, Cuentas Pendientes. Editorial Trilce, Montevideo, pp 28-40.
Diaz-Horta O, Cintado A, Fernandez-de-Cossio E, Nazabal M, Ferrer A, Roca J, Camacho H, Benítez J, Ale M, Villarreal A,et al.(2010) Relationship of type 1 diabetes to ancestral proportions and HLA DR/D2 alleles in a sample of the ad-mixed Cuban population. Ann Hum Biol 37:778-788. Dupanloup I and Bertorelle G (2001) Inferring admixture
propor-tions from molecular data: Extension to any number of pa-rental populations. Mol Biol Evol 18:672-675.
Duque C, Parra MV, Valencia AV, Bedoya G and Ruiz-Linares A (2012) Comparación de cuatro programas utilizados en la determinación de la composición genética ancestral de la población antioqueña. Rev Col Antropol 48:233-257. Excoffier L, Estoup A and Cornuet JM (2005) Bayesian analysis
of an admixture model with mutations and arbitrarily linked markers. Genetics 169:1727-1738.
Fagundes NJ, Kanitz R and Bonatto SL (2008) A reevaluation of the Native American mtDNA genome diversity and its bear-ing on the models of early colonization of Berbear-ingia. PLoS One 3:e3157.
Fejerman L, Carnese FR, Goicoechea AS, Avena SA, Dejean CR and Ward RH (2005) African ancestry of the population of Buenos Aires. Am J Phys Anthropol 128:164-170. Fejerman L, Chen GK, Eng C, Huntsman S, Hu D, Williams A,
Pasaniuc B, John EM, Via M, Gignoux C,et al.(2012) Ad-mixture mapping identifies a locus on 6q25 associated with breast cancer risk in US Latinas. Hum Mol Genet 21:1907-1917.
Ferreira da Silva LA, Pimentel BJ, Azevedo DA, Silva ENP and Santos SS (2002) Allele frequencies of nine STR loci -D16S539, D7S820, D13S317, CSF1PO, TPOX, TH01, F13A01, FESFPS and vWA - in the population from Ala-goas, northeastern Brazil. Forens Sci Int 130:187-188. Ferreira FL, Leal-Mesquita ER, Santos SEB and
Ribeiro-dos-Santos AKC (2005) Genetic characterization of São Luís, MA, Brazil. Genet Mol Biol 28:22-31.
Ferreira LB, Mendes-Junior CT, Wiezel CEV, Luizon MR and Simões AL (2006) Genomic ancestry of a sample population from the state of São Paulo, Brazil. Am J Hum Biol 18:702-705.
Francez PAC, Rodrigues EMR, Frazão GF, Borges NDR and Santos SEB (2011a) Allelic frequencies and statistical data obtained from 12 codis STR loci in an admixed population of the Brazilian Amazon. Genet Mol Biol 34:35-39. Francez PAC, Ribeiro-Rodrigues EM and Santos SEB (2011b)
Allele frequencies and statistical data obtained from 48 AIM INDEL loci in an admixed population from the Brazilian Amazon. Forens Sci Int Genet 6:132-135.
Francez PAC, Ramos LPV, Palha TJRF and Santos SEB (2012) Haplotype diversity of 17 Y-STR loci in an admixed popula-tion from the Brazilian Amazon. Genet Mol Biol 35:45-52. Gaieski JB, Owings AC, Vilar MG, Dulik MC, Gaieski DF,
Gittelman RM, Lindo J, Gau L, Schurr TG and The Geno-graphic Consortium (2011) Genetic ancestry and indigenous heritage in a Native American descendant community in Bermuda. Am J Phys Anthropol 146:392-405.
Galanter JM, Fernandez-Lopez JC, Gignoux CB, Barnholtz-Sloan J, Fernandez-Rozadilla C, Via M, Hidalgo-Miranda A, Con-treras AV, Figueroa LV, Raska P,et al.(2012) Development
of a panel of genome-wide ancestry informative markers to study admixture throughout the Americas. PLoS Genet 8:e1002554.
Gascue C, Mimbacas A, Sans M, Gallino JP, Bertoni B, Hidalgo P and Cardoso H (2005) Frequencies of the four major Amer-indian mtDNA haplogroups in the population of Montevi-deo, Uruguay. Hum Biol 77:873-878.
Gibbon S, Santos RV and Sans M (2011) Racial Identities, Ge-netic Ancestry, and Health in South America. Argentina, Brazil, Colombia, and Uruguay. Palgrave MacMillan, New York, 256 pp.
Godinho NMO, Gontijo CC, Diniz MECG, Falcão-Alencar G, Dalton GC, Amorim CEG, Barcelos RSS, Klautau-Gui-marães MN and Oliveira SF (2008) Regional patterns of ge-netic admixture in South America. Forens Sci Int Genet Suppl Series 1:329-330.
Gómez-Carballa A, Ignacio-Veiga A, Álvarez-Iglesias V, Pastori-za-Mourelle A, Ruiz Y, Pineda L, Carracedo A and Salas A (2012) A melting pot of multicontinental mtDNA lineages in admixed Venezuelans. Am J Phys Anthropol 147:78-87. Gómez-Pérez L, Alfonso-Sánchez MA, Pérez-Miranda AM,
Gar-cía-Obregón S, Builes JJ, Bravo ML, Pancorbo MM and Peña JA (2010) Genetic admixture estimates by Alu
ele-ments in Afro-Colombian and Mestizo populations from Antioquia, Colombia. Ann Hum Biol 37:488-500.
Gómez-Pérez L, Alfonso-Sánchez MA, Dipierri JE, Alfaro E, García-Obregón S, Pancorbo MM, Bailliet G and Peña JA (2011) Microevolutionary processes due to landscape fea-tures in the Province of Jujuy (Argentina). Am J Hum Biol 23:177-184.
González-Andrade F, Sánchez D, González-Solórzano J, Gascon S and Martínez-Jarreta R (2007) Sex-specific genetic ad-mixture of Mestizos, Amerindian Kichwas, and Afro-Ecua-dorans from Ecuador. Hum Biol 79:51-77.
in the population of Metztitlán (Estado de Hidalgo), México. Forens Sci Int 166:230-232.
Greenberg JH, Turner CGII and Zegura SL (1986) The settlement of the Americas: A comparison of the linguistic, dental, and genetic evidence. Curr Anthropol 27:477-497.
Guardado-Estrada M, Juarez-Torres E, Medina-Martinez I, We-gier A, Macías A, Gomez G, Cruz-Talonia F, Roman-Bas-saure E, Piñero D, Kofman-Alfaro S,et al.(2009) A great di-versity of Amerindian mitochondrial DNA ancestry is present in the Mexican Mestizo population. J Hum Genet 54:695-705.
Guerreiro-Junior V, Bisso-Machado R, Marrero A, Hünemeier T, Salzano FM and Bortolini MC (2009) Genetic signatures of parental contribution in black and white populations in Bra-zil. Genet Mol Biol 32:1-11.
Hanis CL, Chakraborty R, Ferrell RE and Schull WJ (1986) Indi-vidual admixture estimates: Disease associations and indi-vidual risk of diabetes and gallbladder disease among Mexi-can-Americans in Starr County, Texas. Am J Phys Anthropol 70:433-441.
Harris K and Nielsen R (2013) Inferring demographic history from a spectrum of shared haplotype lengths. PLoS Genet 9:e1003521.
Hernández-Gutiérrez S, Hernández-Franco P, Martínez-Tripp S, Ramos-Kuri M and Rangel-Villalobos H (2005) STR data for 15 loci in a population sample from the central region of Mexico. Forens Sci Int 151:97-100.
Heyer E, Tremblay M and Desjardins B (1997) Seventeenth-century European origins of hereditary diseases in the Sa-guenay population (Quebec, Canada). Hum Biol 69:209-225.
Hidalgo PC, Bengochea M, Abilleira D, Cabrera A and Alvarez I (2005) Genetic admixture estimate in the Uruguayan popu-lation based on the loci LDLR, GYPA, HBGG, GC and D7S8. Int J Hum Genet 5:217-222.
Hünemeier T, Carvalho C, Marrero AR, Salzano FM, Pena SDJ and Bortolini MC (2007) Niger-Congo speaking popula-tions and the formation of the Brazilian gene pool: mtDNA and Y-chromosome data. Am J Phys Anthropol 133:854-867.
Ibarra A, Freire-Aradas A, Martínez M, Fondevilla M, Burgos G, Camacho M, Ostos H, Suarez Z, Carracedo A, Santos S, et al. (2014) Comparison of the genetic background of differ-ent Colombian populations using the SNPforID 52plex iden-tification panel. Int J Legal Med 128:19-25.
Johnson NA, Coram MA, Shriver MD, Romien I, Barsh GS, Lon-don SJ and Tang H (2011) Ancestral components of ad-mixed names in a Mexican cohort. PLoS Genet 7:e1002410. Juárez-Cedillo T, Zuñiga J, Acuña-Alonso V, Pérez-Hernández
N, Rodríguez-Pérez JM, Berquera R, Gallardo Jr J, Sán-chez-Arena R, García-Peña MC, Granados J,et al.(2008) Genetic admixture and diversity estimations in the Mexican Mestizo population from Mexico City using 15 STR poly-morphic markers. Forens Sci Int Genet 2:e37-e39.
Kimura L, Ribeiro-Rodrigues EM, Auricchio MTBM, Vicente JP, Santos SEB and Mingroni-Netto RC (2013) Genomic ances-try of rural African-derived populations from southeastern Brazil. Am J Hum Biol 25:35-41.
Konetkze R (1991) America Latina II: La Época Colonial. Ed. Siglo XXI, Mexico DF, 397 pp.
Kosoy R, Nasser R, Tian C, White PA, Butler LM, Silva G, Kittles R, Alarcon-Riquelme ME, Gregersen PK, Belmont JW,et al.(2009) Ancestry informative marker sets for determining continental origin and admixture proportions in common populations in America. Hum Mutat 30:69-78.
Leite FPN, Monegassi FJ, Schwengber SP, Raimann PE and Al-buquerque TK (2003) STR data for 09 autosomal STR markers from Rio Grande do Sul (southern Brazil). Forens Sci Int 132:223-224.
Lins TC, Vieira RG, Abreu BS, Grattapaglia D and Pereira RW (2010) Genetic composition of Brazilian population samples based on a set of twenty eight ancestry informative SNPs. Am J Hum Biol 22:187-192.
Lins TC, Vieira RG, Grattapaglia D and Pereira RW (2011) Popu-lation analysis of vitamin D receptor polymorphisms and the role of genetic ancestry in an admixed population. Genet Mol Biol 34:377-385.
Luna-Vazquez A, Vilchis-Dorantes G, Aguilar-Ruiz MO, Bau-tista-Rivas A, Rojo-Nava AL, Rios-Barrios E and Rangel-Villalobos H (2005) Population data for 15 loci (Identifier Kit) in a sample from the Valley of Mexico. Legal Med 7:331-333.
Maciel LGL, Ribeiro Rodrigues EM, Santos NPC, Ribeiro dos Santos A, Guerreiro JF and Santos S (2011) Afro-derived Amazonian populations: Inferring continental ancestry from population substructure. Hum Biol 83:627-636.
Malhi RS, Cybulski JS, Tito RY, Johnson J, Harry H and Dan C. (2010) Mitochondrial haplotype C4c confirmed as a found-ing genome in the Americas. Am J Phys Anthropol 141:494-497.
Manta FSN, Pereira R, Caiafa A, Silva DA, Gusmão L and Carvalho EF (2013) Analysis of genetic ancestry in the ad-mixed Brazilian population from Rio de Janeiro using 46 autosomal ancestry-informative indel markers. Ann Hum Biol 40:94-98.
Mao X, Bigham AW, Mei R, Gutierrez G, Weiss KM, Brutsaert TD, Leon-Velarde F, Moore LG, Vargas E, McKeigue PM,
et al.(2007) A genomewide admixture mapping panel for
Hispanic/Latino populations. Am J Hum Genet 80:1171-1178.
Marrero AR, Leite FPN, Carvalho BA, Peres LM, Kommers TC, Cruz IM, Salzano FM, Ruiz-Linares A, Silva Junior WA and Bortolini MC (2005) Heterogeneity of the genome ancestry of individuals classified as white in the state of Rio Grande do Sul, Brazil. Am J Hum Biol 17:496-506.
Marrero AR, Bravi C, Stuart S, Long JC, Leite FPN, Kommers T, Carvalho CMB, Pena SDJ, Ruiz-Linares A, Salzano FM,et al.(2007) Pre- and post-Colombian gene and cultural
conti-nuity: The case of theGauchofrom southern Brazil. Hum Hered 64:160-171.
Martínez H, Rodriguez-Larralde A, Izaguirre MH and Castro de Guerra D (2007) Admixture estimates for Caracas, Vene-zuela, based on autosomal, Y-chromosome, and mtDNA markers. Hum Biol 79:201-213.
Martínez-Cortés G, Salazar-Flores J, Haro-Guerreiro J, Rubi-Castellanos R, Velarde-Félix JS, Muñoz-Valle JF, López-Casamichana M, Carrillo-Tapia E, Canseco-Avila LM, Bra-vi CM, et al. (2013) Maternal admixture and population