online | memorias.ioc.fiocruz.br
Serial QuantiFERON-TB Gold In-Tube assay and tuberculin skin
test to diagnose latent tuberculosis in household Mexican contacts:
conversion and reversion rates and associated factors using
conventional and borderline zone definitions
Joel Monárrez-Espino1,José Antonio Enciso-Moreno2, Lucie Laflamme1, Carmen J Serrano2/+
1Department of Public Health Sciences, Karolinska Institute, Stockholm, Sweden 2Medical Research Unit Zacatecas, Mexican Institute of Social Security, Zacatecas, Mexico
A cohort of 123 adult contacts was followed for 18-24 months (86 completed the follow-up) to compare conver-sion and reverconver-sion rates based on two serial measures of QuantiFERON (QFT) and tuberculin skin test (TST) (PPD from TUBERSOL, Aventis Pasteur, Canada) for diagnosing latent tuberculosis (TB) in household contacts of TB patients usingconventional (C) and borderline zone (BZ) definitions. Questionnaires were used to obtain informa-tion regarding TB exposure, TB risk factors and socio-demographic data. QFT (IU/mL) conversion was defined as < 0.35 to ≥ 0.35 (C) or < 0.35 to > 0.70 (BZ) and reversion was defined as ≥ 0.35 to < 0.35 (C) or ≥ 0.35 to < 0.20 (BZ); TST (mm) conversion was defined as < 5 to ≥ 5 (C) or < 5 to > 10 (BZ) and reversion was defined as ≥ 5 to < 5 (C). The QFT conversion and reversion rates were 10.5% and 7% with C and 8.1% and 4.7% with the BZ definitions, respectively. The TST rates were higher compared with QFT, especially with the C definitions (conversion 23.3%, reversion 9.3%). The QFT conversion and reversion rates were higher for TST ≥ 5; for TST, both rates were lower for QFT < 0.35. No risk factors were associated with the probability of converting or reverting. The inconsistency and apparent randomness of serial testing is confusing and adds to the limitations of these tests and definitions to follow-up close TB contacts.
Key words: close contact - QuantiFERON - latent TB - Mexico - serial testing
The household contacts of patients diagnosed with ac-tive tuberculosis (TB) are at higher risk of contagion and of developing active disease in a shorter period of time compared with sporadic contacts (Fox et al. 2013). The relatively large incidence rate of TB infection (~1,500 per 100,000 person-years) reported by contacts of TB patients from low- and middle-income countries during the first year after exposure to the index case emphasises the im-portance of serial screening, particularly among individu-als not receiving prophylactic treatment. It has been re-ported that 51.5% of all contacts [95% confidence interval (CI) 47.1-55.8%] have a tuberculin skin test (TST) that is positive for latent TB infection (LTBI) (Fox et al. 2013).
Serial TST testing for LTBI has been proposed for people constantly exposed to infected individuals, such as household members or health workers in contact with TB patients. However, repeated TSTs to diagnose LTBI in high-risk groups have been difficult to interpret because
doi: 10.1590/0074-0276140085
Financial support: CONACYT-SALUD-2008-C01-87657, Program for international cooperation CIS of the IMSS + Corresponding author: [email protected] Received 6 March 2014
Accepted 19 August 2014
the findings show inexplicable reversions (i.e., decrease in skin induration size from a prior positive test) or un-clear conversions (i.e., increase in induration size from an earlier negative test) resulting from either random variability (e.g., differences in administration, reading or biologic response), boosting (i.e., immunologic recall of pre-existing delayed hypersensitivity to mycobacterial antigens) or an actual new infection (Menzies 1999).
Interferon-gamma release assays (IGRAs) are alter-natives to TSTs (Mazurek et al. 2005), although findings suggest that reversions and conversions are also frequent (Ewer et al. 2006, Friedman et al. 2006, Pai et al. 2006, Franken et al. 2007, Hill et al. 2007a, b, Lee et al. 2008, Slater et al. 2013, Dorman et al. 2014) and there is no consensus on how to define and interpret these phenom-ena (Pai & O’Brien 2007, Pai et al. 2007, Slater et al. 2013, Dorman et al. 2014).
Serial testing using IGRAs and/or TST to diagnose LTBI among household adult contacts of TB patients has not been reported in Mexico or Latin America; there-fore, conversion and reversion rates in these populations remain unknown and very limited evidence exists on factors associated with their stability over time. More-over, few studies worldwide have compared the rever-sion and converrever-sion rates for LTBI based on TSTs and IGRAs within the critical first years after exposure us-ing household contacts (Pai et al. 2009, Shah et al. 2011) and no study has tried to explore whether these rates re-late to personal or exposure characteristics.
We previously reported a high baseline prevalence
of LTBI using the TST (≥ 5 mm 53.6%) and QuantiF
-ERON-TB Gold In-Tube assay (QFT-GIT) (≥ 0.35 IU/
mL 41.4%) (Cellestis Inc, USA) from a cohort of 123 adult contacts in central Mexico (Serrano-Escobedo et al. 2013). Herein, we determine the performance char-acteristics of the QFT-GIT vs. TST for serial testing of those household contacts. After an 18-month follow-up period, we demonstrate and compare the QFT-GIT and TST responses in terms of conversions and reversions using conventional and BZ cut-off definitions from two serial measures. In addition, this study explores the epi-demiological associations between constitutional, socio-demographic and exposure factors and the occurrence rates of conversions and reversions.
PATIENTS, MATERIALS AND METHODS
Study design - This study used a cohort of 123 adult contacts of 39 TB patients who were followed up for 18 months. The index cases were diagnosed with pulmo-nary TB (positive acid-fast bacilli smear and/or culture) between 2008-2010 in the central Mexican state of Za-catecas, according to the Ministry of Health. Baseline data were used to report on the performance of the QFT-GIT and TST to identify LTBI among these contacts (Serrano-Escobedo et al. 2013).
Trained staff interviewed the TB patients and con-tacts at their homes using structured questionnaires. Ba-sic socio-demographic data and known risk factors for TB were obtained. Furthermore, information concern-ing the type and number of contacts, along with the typi-cal frequency and duration of the interaction between index cases and contacts, was recorded from TB patients during the first visit and from contacts a few months lat-er. The QFT-GIT and TST measurements were taken at baseline from all the contacts. Thereafter, the contacts were located after 18-24 months (between March-May 2012) to obtain follow-up QFT-GIT and TST data.
QFT-GIT and TST measurements - QFT-GIT and TST analyses were requested from contacts and were per-formed using identical procedures and protocols at base-line and follow-up. However, endpoint data were unavail-able for analyses in 37 contacts. The main reasons for loss to follow-up were refusals to participate (n = 21) and our inability to locate individuals (n = 10) during the follow-up testing. Other reasons for excluding contacts from the analyses included one person who developed pulmonary TB, two women who became pregnant, one person who was not retested due to an initial side effect, one person
who was hospitalised for reasons unrelated to TB and one person who died during the follow-up period.
Full details regarding the testing and measuring pro-cedures used for the QFT-GIT and TST were described earlier (Serrano-Escobedo et al. 2013). Briefly, QFT-GIT testing occurred prior to the TST application; values of
≥ 0.35 IU/mL after adjustment with a negative control
were considered positive. The TST was based on the Mantoux method; a transverse skin induration diameter
≥ 5 mm was considered positive.
Definitions of conversion and reversion - Various cut-offs were used to define conversion (i.e., negative to positive result) and reversion (i.e., positive to negative result) according to both tests and to the QFT-GIT and TST measures independently.
For the QFT-GIT (in IU/mL), conversion was defined
as follows: (i) conventional cut-off, from < 0.35 to ≥ 0.35
and (ii) BZ cut-off, from < 0.35 to > 0.70. Reversion was
defined as: (i) conventional cut-off, from ≥ 0.35 to < 0.35 and (ii) from ≥ 0.35 to < 0.20. These thresholds were de -termined according to recent recommendations (Ring-shausen et al. 2012, Whitworth et al. 2012).
For the TST (in mm induration), conversion was de-fined as follows: (i) conventional cut-off, from < 5 at
baseline to ≥ 5 at follow-up and (ii) BZ cut-off, from <
5 to > 10; this 6 mm increment, which was suggested to overcome random variations, was used to create a corre-sponding TST borderline definition to be compared with that of the QFT-GIT; reversion was defined
convention-ally as ≥ 5 at baseline to < 5 mm at follow-up.
Basic socio-demographic and exposure data - A rela-tively large amount of data was obtained from each of the contacts included in this cohort. However, only selected personal [sex, age group and body mass index (BMI)], exposure (exposure time and type of contact) and risk [Bacillus Calmette-Guerin (BCG) scar] factors for TB were used in the stratified results presented herein.
The exposure time was computed using the number of hours that each contact was exposed to the TB patient according to the questionnaire applied to the index case. The total time was calculated from a set of questions re-ferring to the symptomatic period when the person had not been treated (i.e., the contagious period). This vari-able was dichotomised as 1-500 h and > 500 h within the first three-month symptomatic period.
The type of contact with the index case was calculat-ed from the variables containcalculat-ed in the questionnaire ap-plied to the contacts after the index case was treated (i.e., the non-contagious period). The information was
cate-gorised as very close (5-7 days per week with ≥ 30 h per
week), close (5-7 days per week with 21-30 h per week), irregular (1-4 days per week with 6-20 h per week) and occasional (1-4 days per week with < 6 h per week).
Kappa coefficients were used to measure agreements between the QFT-GIT and TST using the conventional dichotomous definition to diagnose LTBI at baseline.
The conversion and reversion rates occurring dur-ing the follow-up period were compared for both mea-sures using the conventional and BZ cut-offs that were defined. The proportions of conversion and reversion of the QFT-GIT and TST using the BZ cut-offs were strati-fied according to sex, age group, BMI group, BCG scar and exposure categories.
Finally, exploratory multinomial regression analyses were used to identify risk factors for conversion and re-version using the category “remained positive/negative”
at the endpoint as the reference. Four adjusted models
were run using the QFT-GIT and TST with conventional and BZ definitions as dependent variables. The inde-pendent variables included the previously referenced variables and the initial QFT-GIT and TST status. Other baseline characteristics of the contacts and index cases not detailed here (e.g., morbidity, income, household conditions, civil status, literacy, schooling, smoking, al-cohol use, migration etc.) were also tested. Crude and
adjusted odds ratios with 95% CIs were computed.
The data were entered and analysed using IBM®
SPSS® v.22 (IBM, USA). Statistical significance was set
at p < 0.05.
Ethics - The research protocol was developed in ac-cordance with the Helsinki Declaration and was revised and approved by the National Health Research and Ethi-cal Committee at the Mexican Institute of Social Secu-rity (ID R-2008-3301-15). All the participants provided written informed consent.
RESULTS
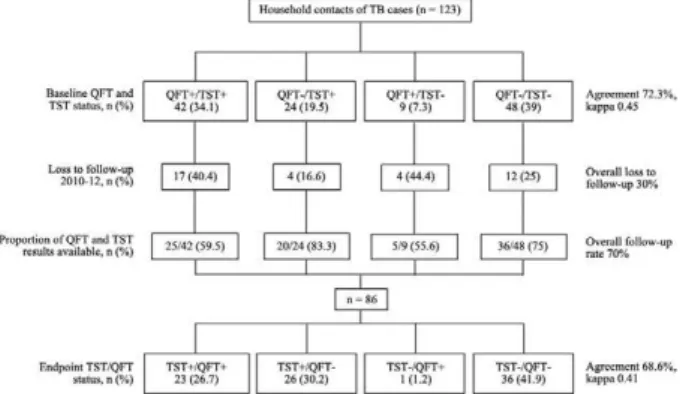
Figure illustrates the study design for the cohort of contacts that was followed. From the initial 123 contacts recruited, QFT-GIT and TST data were available for 86 individuals (follow-up rate of 70%). The agreement and kappa coefficients between the QFT-GIT and TST were 72.3% and 0.45% at baseline and 68.6% and 0.41% at the
endpoint, respectively. Although the majority of the con -tacts lost to follow-up had positive (n = 17) or negative (n
= 12) results in both measures, the subjects with positive
QFT-GIT and negative TST at baseline had the lowest response rate (55.6%).
Table I compares selected characteristics between contacts who completed follow-up and contacts who were not followed. Although no statistically significant differences were identified, the persons lost to follow-up had slightly higher median BMI values (26 vs. 25 kg/ m2; p = 0.09), higher QFT-GIT levels (0.15 vs. 0.04 IU/
mL; p = 0.12) and lower median TST indurations (3 vs. 7 mm; p = 0.13) compared with those who were followed. No clear differences in the exposure time to the TB pa-tient were detected, either as referred by the index case or the contacts, although a higher proportion of contacts
exposed for > 500 h was observed in the subjects lost to
follow-up (37.8 vs. 22.1%).
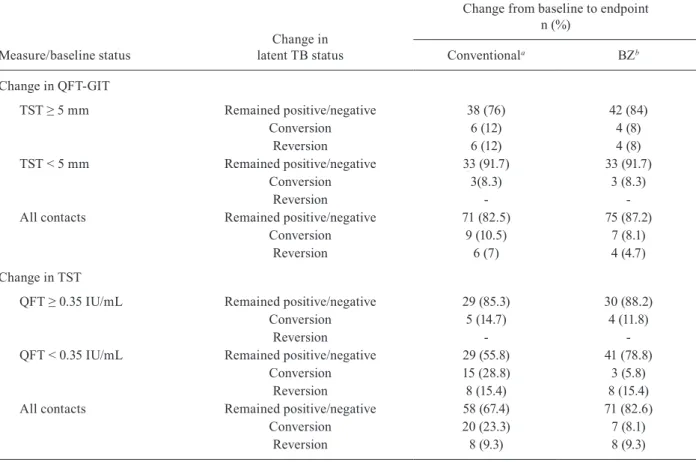
The conversion and reversion rates using the con-ventional and BZ definitions are listed in Table II. Con-sistent with expectations, the rates were lower when the
borderline thresholds were used. For the QFT-GIT, the respective overall proportions of conversions and rever-sions were 10.5% and 7% when the conventional defini-tion was used and 8.1% and 4.7% according to the BZ criterion. The conversion and reversion rates using TST were notably higher than with the QFT-GIT, especially when the conventional cut-offs were used (23.3% and 9.3%, respectively). The rates varied depending on the corresponding baseline values of the TST or QFT-GIT. For the QFT-GIT, the conversion and reversion rates
were higher if the baseline TST was ≥ 5 mm, whereas
for the TST, the rates tended to be lower when the QFT-GIT was < 0.35 IU/mL at baseline.
Differences in the proportions of conversions and reversions using the BZ cut-offs for the QFT-GIT and TST stratified by selected factors are shown in Table III. Although some proportions differed between groups, no significant differences were detected for any of the
variables assessed. For the QFT-GIT, the majority of
the seven conversions occurred in men (71.4%) and in people vaccinated against TB (71.4%). The results by the type and total hours of exposure between TB patients
and contacts were inconsistent; although the majority of
conversions occurred in contacts with shorter exposure times as referred by the index case, the contacts with close or very close interactions had higher conversion rates according to the contacts. Four reversions were observed and the patterns also differed between
catego-ries, with the majority of reversions occurring in con -tacts with normal BMIs (75%), with BCG scars (75%) and with close or very close interactions with the TB
patients (75%). Using the TST criteria, the majority of
the conversions (71.4%) occurred in women, in persons with normal BMIs (71.4%); in all seven conversions, the contacts had BCG scars. Although less clear, the find-ings were also inconsistent with regards to exposure to the index case. The eight reversions occurred in women in very close or close contact with the TB patient. The
majority of these subjects were overweight (62.5%) and
had received BCG vaccinations (75%).
None of the factors explored in the crude or adjusted
multinomial regression models was statistically signifi-cant, irrespective of the dependent variable assessed
Flow-chart of the Zacatecas, Mexico cohort for household contacts of tuberculosis (TB) patients followed-up between 2010-2012 using
(i.e., QFT-GIT conventional, QFT-GIT borderline, TST conventional and TST borderline). Wide 95% CIs were common and reflected sample size limitations.
DISCUSSION
Screening for LTBI using appropriate methods is im-portant for diagnosing and prophylactically treating per-sons at increased risk of progression to active TB. IGRAs and TST have been proposed for serial testing in TB. To date, the main limitation for the effective investigation of contacts is the lack of a test that accurately identi-fies LTBI, differentiates between active and LTBI and predicts the progression to active disease. Therefore, we believe that our data could be of value for understanding the limitations of the criteria currently used to diagnose and follow-up contacts with LTBI in countries with a medium TB burden while the main issues of IGRAs to diagnose LTBI are approached.
This study is the first to report serial QFT-GIT and TST results from a cohort of close contacts of
pulmo-nary TB patients in Mexico. The study primarily aimed at assessing and comparing the evolution of QFT-GIT and TST responses from household contacts after an 18-24 month follow-up period, focusing specifically on the conversion and reversion rates using standard and newly proposed definitions (Ringshausen et al. 2012, Whit-worth et al. 2012). Despite its limited clinical value, we elected to study the issue of TST reversion to potentially reproduce, in this Latin American population, the results that other authors have reported (Dorman et al. 2014) or
commented upon (Pai & O’Brien 2007, Trajman et al.
2013); in particular, we wanted to reproduce the observa-tion that TST testing is prone to reversions. A secondary
objective was to explore the epidemiological risk factors
associated with the occurrence of conversions and rever-sions. Although two other studies have examined QFT instability using serial testing from household contacts (Pai et al. 2009, Shah et al. 2011), this study is the first conducted in Latin America; therefore, it adds to the body of literature on the topic.
TABLE I
Selected characteristics of the household contacts of tuberculosis patients at baseline stratified by follow-up status, Zacatecas cohort, Mexico, 2010-2012
Characteristic Category
Followed-up (n = 86)
n (%) pa
Loss to follow-up (n = 37)
n (%)
Sex Male 34 (39.5) 0.50 17 (45.9)
Female 52 (60.5) 20 (54.1)
Body mass index Median (range) 25.1 (18.2-37.3) 0.09 26.0 (20.3-38.2)
Age (years) < 30 24 (27.9) 0.89 11 (29.7)
30-39 19 (22.1) 10 (27)
40-49 15 (17.4) 5 (13.5)
≥ 50 28 (32.6) 11 (29.7)
Median (range) 39.5 (17.1-87.4) 0.51 36.4 (18.2-74.4)
BCG scar Yes 75 (87.2) 0.61 31 (83.8)
No 11 (12.8) 6 (16.2)
Total exposure timeb (hours) 1-500 40 (46.5) 0.19 14 (37.8)
> 500 19 (22.1) 14 (37.8)
Undetermined 27 (31.4) 9 (24.3)
Type of contactc Close or very close 68 (79.1) 0.79 30 (81.1)
Irregular or occasional 18 (20.9) 7 (18.9)
TST (mm) 0-4 36 (41.9) 0.30 21 (56.8)
5-9 17 (19.8) 6 (16.2)
> 10 33 (38.4) 10 (27)
Median (range) 7 (0-28) 0.13 3 (0-20)
QFT (IU/mL) < 0.35 52 (60.5) 0.70 21 (56.8)
≥ 0.35 34 (39.5) 16 (43.2)
Median (range) 0.04 (0-10) 0.12 0.15 (0-10)
a: Pearson chi-square (nominal data) and Mann-Whitney U tests (not normally distributed continuous data) were used; b: com-puted from a questionnaire applied to the index case when symptomatic and untreated (contagious period); c: calculated from a
questionnaire applied to the contacts after the index case was treated (non-contagious period: very close, 5-7 days/week with ≥
The main findings demonstrate relatively large con-version and recon-version rates regardless of the test and definition used. As predicted, lower proportions were observed with QFT-GIT testing and when BZ definitions were used. In our opinion, the results of this work are rel-evant to emphasise the limited value of serial QFT mea-sures for the follow-up of close contacts of TB patients.
Serial testing studies on household contacts are scarce (Pai et al. 2009, Shah et al. 2011); however, in ac-cordance with our results, inexplicable conversions and the reversion rates reported are rather frequent, limiting the value of these tests to evaluate LTBI progression. We were unable to identify any factors associated with the risk of conversion or reversion in either the bivariate or the multivariate analyses. The results were often incon-sistent (e.g., men had higher conversion risks according to QFT-GIT, but women had higher risks with TST when borderline cut-offs were used). Although the Indian study (Pai et al. 2009) did not explore associated factors, the study from South Africa (Shah et al. 2011) reported that
older age and a baseline TST ≥ 5 mm were associated
with QFT-GIT conversions. Additionally, female gender was related to reversions and children with baseline TST
≥ 5 mm were less likely to have a QFT-GIT reversion.
We conducted additional sub-analyses to explore the association between the months that had passed from baseline to follow-up testing and the probability of con-version and recon-version using QFT-GIT borderline defini-tions, although no significant differences in the mean or median times elapsed were observed (p > 0.40). Even less significant differences were observed when conven-tional definitions were used for either the TST or QFT-GIT tests (p > 0.50). Household clustering of conversion and/or reversion rates for the QFT-GIT were also con-ducted; however, the results confirm the apparent unpre-dictability of the results.
The boosting effect of TSTs over QFT results has been suggested as a reason that affects IGRA variability. However, the conversion rates that we observed are un-likely to be explained by this phenomenon because the boosting effect wanes within six months (Leyten et al. 2007, Baker et al. 2009, Ritz et al. 2011, Sauzullo et al.
TABLE II
Conversion and reversion rates according to conventional and borderline zone (BZ) cut-offs assessed from two serial QuantiFERON-TB Gold In-Tube assay (QFT-GIT) and tuberculin skin test (TST) measurements among household contacts
of tuberculosis (TB) patients stratified by baseline TST and QFT-GIT status, Zacatecas cohort, Mexico, 2010-2012
Measure/baseline status
Change in latent TB status
Change from baseline to endpoint n (%)
Conventionala BZb
Change in QFT-GIT
TST ≥ 5 mm Remained positive/negative 38 (76) 42 (84)
Conversion 6 (12) 4 (8)
Reversion 6 (12) 4 (8)
TST < 5 mm Remained positive/negative 33 (91.7) 33 (91.7)
Conversion 3(8.3) 3 (8.3)
Reversion -
-All contacts Remained positive/negative 71 (82.5) 75 (87.2)
Conversion 9 (10.5) 7 (8.1)
Reversion 6 (7) 4 (4.7)
Change in TST
QFT ≥ 0.35 IU/mL Remained positive/negative 29 (85.3) 30 (88.2)
Conversion 5 (14.7) 4 (11.8)
Reversion -
-QFT < 0.35 IU/mL Remained positive/negative 29 (55.8) 41 (78.8)
Conversion 15 (28.8) 3 (5.8)
Reversion 8 (15.4) 8 (15.4)
All contacts Remained positive/negative 58 (67.4) 71 (82.6)
Conversion 20 (23.3) 7 (8.1)
Reversion 8 (9.3) 8 (9.3)
2011, Dorman et al. 2014). However, with the available data, it is difficult to ascertain whether our findings re-late to delayed immunologic responses, on-going house-hold or community TB exposure, technical/analytical errors, inherent non-specific variations of the tests or other unknown reasons.
Serial studies on QFT and TST performance on household contacts are limited; however, the largest and longest studies on serial QFT-GIT (Slater et al. 2013) or QFT-GIT vs. TST (Dorman et al. 2014) performed in health care workers reached essentially equivalent con-clusions. There was no association between reported TB exposure and conversion and more than 90% of TST converters who were retested and 75% of IGRA convert-ers were negative on testing six months later without treatment. Those studies also assessed whether any vari-ables would facilitate differentiation between stable and transient conversions at the time of the result. Variables
related to TB exposure and IGRA quantitative values were evaluated, although none were helpful at the indi-vidual patient level.
The results of the present study should be considered in context with the relatively small sample of individuals studied and the 30% of contacts lost in the follow-up, which might have led to low statistical power and selec-tion bias, respectively. Another limitaselec-tion is the timing of the second testing, as re-exposure could have occurred during this period. Although the 18 months used between the first and second testing remain within the two-year post-infection period deemed relevant for short-term re-activations, from the clinical viewpoint, earlier conver-sions would have been more relevant because they are a strong risk factor for active TB progression.
The rapid expansion of IGRAs in recent years has increasingly revealed limitations and doubts, especially with regards to medical interpretation. For LTBI
diag-TABLE III
Differences in the proportions of conversion and reversion based on QuantiFERON-TB Gold In-Tube assay (QFT-GIT) and tuberculin skin test (TST) measurements using borderline zone cut-offsa according to selected characteristics
of the household contacts of tuberculosis patients, Zacatecas cohort, Mexico, 2010-2012
Selected characteristics
Change from baseline to endpoint n (%)
QFT-GIT TST
Conversion Reversion Conversion Reversion
Sex
Male 5 (71.4) 2 (50) 2 (28.6)
-Female 2 (28.6) 2 (50) 5 (71.4) 8 (100)
Age group (years)
< 30 3 (42.9) 2 (50) 2 (28.6) 1 (12.5)
30-39 3 (42.9) 1 (25) 3 (42.9) 1 (12.5)
≥ 40 1 (14.3) 1 (25) 2 (28.6) 6 (62.5)
BMI (kg/m2)
Overweight (> 25) 4 (57.1) 1 (25) 2 (28.6) 5 (62.5)
Normal (≤ 25) 3 (42.9) 3 (75) 5 (71.4) 3 (37.5)
Exposure reported by index caseb
1-500 h in 3 months 3 (42.9) - 4 (57.1) 3 (37.5)
> 500 h in 3 months 1 (14.3) 1 (25) 1 (14.3) 3 (37.5)
Undetermined 3 (42.9) 3 (75) 2 (28.6) 2 (25)
Exposure reported by contactsc
Close or very close 6 (85.7) 3 (75) 4 (57.1) 8 (100)
Irregular or occasional 1 (14.3) 1 (25) 3 (42.9)
-BCG scar
Yes 5 (71.4) 3 (75) 7 (100) 6 (75)
No 2 (28.6) 1 (25) - 2 (25)
a: QFT-GIT (IU/mL) conversion from < 0.35 to > 0.70, reversion from ≥ 0.35 to < 0.20, TST (mm) induration conversion from < 5 to > 10, reversion from ≥ 5 to < 4; b: computed from a questionnaire applied to the index case when symptomatic and untreated (contagious period); c: calculated from a questionnaire applied to the contacts after the index case was treated (non-contagious
period: very close, 5-7 days/week with ≥ 30 h/week, close, 5-7 days/week with 21-30 h/week, irregular, 1-4 days/week with 6-20
nosis, these features include the clinical implications of reversion results and the meaning of the magnitude on IGRA’s responses (Abubakar et al. 2013). Possible rea-sons for the short and long-term variabilities with
IG-RAs include factors that relate to the subject and those
that relate to the laboratory. One possible explanation for the high proportions of IGRA conversions is that the
quantitatively small changes occurring around a fixed
cut-off point could result in qualitative changes from negative to positive (Diel et al. 2010, Ringshausen et al. 2010, 2012, Costa et al. 2011, Rafiza & Rampal 2012). Some authors have suggested that the addition of a “BZ”
for the QFT-GIT could help prevent misclassification of
these individuals (Whitworth et al. 2012). The reasons for the intra and inter-laboratory variabilities include possible differences in laboratory procedures, such as variations in processing, time to incubation and incuba-tion time (Doberne et al. 2011, Whitworth et al. 2012).
As mentioned previously, discordance on QFT-GIT serial testing is a concern that has no consensus
expla-nation and can be significantly higher in patients with a
low mitogen response (Woo et al. 2014). Otherwise, dis-cordance between LTBI tests might have resulted from intermittent antigen secretion from Mycobacterium tu-berculosis, as suggested previously (Hill et al. 2007a, Park et al. 2012). However, we must consider that IGRAs are highly dynamic tests and T cell responses tend to
fluctuate according to the variable status of TB infection (Pai et al. 2006). QFT-GIT reversions might reflect the
clearance of TB infection or biologic variability, particu-larly when the results of the baseline TST are discordant. Evidence demonstrates that children with discordant test results display a mixed biomarkers profile, with activa-tion of both pro and anti-inflammatory markers com-pared with children with concordant results for TST and QFT-GIT (Dhanasekaran et al. 2014); therefore, the TST and/or QFT-GIT positivity reflect different, but over-lapping aspects of host immunity. Further longitudinal studies of serial T cell responses and active TB progres-sion are required to clarify the variable IGRA results.
The substantial incidence of TB disease within five years after exposure and particularly within the first year, emphasises the importance of serial screen-ing for TB in contacts that do not receive prophylactic treatment for LTBI (Fox et al. 2013). However, our data in high-risk groups of Mexicans suggest that the QFT-GIT offers little advantage over the TST for assessing LTBI prevalence (Serrano-Escobedo et al. 2013) and for the follow-up of close contacts. It remains important to inform contacts about their on-going risk of developing TB, even after the index case has been treated and to improve referral strategies if symptoms appear (Fox et al. 2013) while better testing tools are developed.
At present, the Mexican Official Norm states that TB chemoprophylaxis should be given as follows: (i) for six months to contacts < 5 years with or without BCG vac-cination, (ii) for six months to those aged five-14 years with no BCG in whom TB has been ruled out, (iii) to
contacts aged ≥ 15 years who are human immunodefi -ciency virus-positive or have another immunosuppres-sive event during the initial 12 months after having ruled
out pulmonary or extra-pulmonary TB and (iv) 10 mg/kg of isoniazid up to 300 mg/day should be given orally un-der strict supervision. Although the results of this study have limited value in Mexico because there is no official endorsement for the provision of preventive treatment for adult healthy LTBI individuals, these results could be of relevance in other settings where prophylaxis is in use.
Despite the small sample size, which might have af-fected the precision of the estimates and the 30% of
sub-jects lost to follow-up, which might have led to selection
bias, we believe that the relatively large reversion rates, the poor internal logic across methods and definitions and the lack of statistically significant factors associated with the incidence of conversions and reversions make the results of serial testing difficult to interpret. To date, neither test appears to be adequate and/or accurate for diagnosing LTBI. The inconsistency and apparent ran-domness of the results are perplexing and add to the limitations in the effectiveness of these methods and to the definitions of follow-up individuals in close contact with TB patients.
ACKNOWLEDGEMENTS
To the medical staff and laboratory personnel Yannin de la Torre Mercado, Marco Antonio Ríos Ceballos and Yolanda García de Lira.
REFERENCES
Abubakar I, Griffiths C, Ormerod P 2012. Diagnosis of active and la-tent tuberculosis: summary of NICE guidance. BMJ 345: e6828.
Abubakar I, Stagg HR, Whitworth H, Lalvani A 2013. How should I interpret an interferon gamma release assay result for tuberculo-sis infection? Thorax 68: 298-301.
Baker CA, Thomas W, Stauffer WM, Peterson PK, Tsukayama DT 2009. Serial testing of refugees for latent tuberculosis using the QuantiFERON Gold In-Tube: effects of an antecedent tuberculin skin test. Am J Trop Med Hyg 80: 628-633.
Costa JT, Silva R, Sá R, Cardoso MJ, Nienhaus A 2011. Serial testing with the interferon-gamma release assay in Portuguese health-care workers. Int Arch Occup Environ Health 84: 461-469.
Dhanasekaran S, Jenum S, Stavrum R, Ritz C, Kenneth J, Vaz M, Do-herty TM, Grewal HM 2014. Concordant or discordant results by the tuberculin skin test and the QuantiFERON-TB test in children reflect immune biomarker profiles. Genes Immun 15: 265-274.
Diel R, Loddenkemper R, Nienhaus A 2010. Evidence-based com-parison of commercial interferon-gamma release assays for de-tecting active TB: a meta-analysis. Chest 137: 952-968.
Doberne D, Gaur RL, Banaei N 2011. Pre-analytical delay reduces sensitivity of QuantiFERON-TB Gold In-Tube assay for detection of latent tuberculosis infection. J Clin Microbiol 49: 3061-3064.
Dorman SE, Belknap R, Graviss EA, Reves R, Schluger N, Weinfurt-er P, Wang Y, Cronin W, Hirsch-MovWeinfurt-erman Y, TeetWeinfurt-er LD, ParkWeinfurt-er M, Garrett DO, Daley CL 2014. Interferon-gamma release assays and tuberculin skin testing for diagnosis of latent tuberculosis infection in healthcare workers in the United States. Am J Respir Crit Care Med 189: 77-87.
Ewer K, Millington KA, Deeks JJ, Alvarez L, Bryant G, Lalvani A 2006. Dynamic antigen-specific T-cell responses after point-source exposure to Mycobacterium tuberculosis. Am J Respir
Fox GJ, Barry SE, Britton WJ, Marks GB 2013. Contact investiga-tion for tuberculosis: a systematic review and meta-analysis. Eur Respir J 41: 140-156.
Franken WP, Koster BF, Bossink AW, Thijsen SF, Bouwman JJ, van
Dissel JT, Arend SM 2007. Follow-up study of tuberculosis-ex-posed supermarket customers with negative tuberculin skin test results in association with positive gamma interferon release as-say results. Clin Vaccine Immunol 14: 1239-1241.
Friedman LN, Nash ER, Bryant J, Henry S, Shi J, D’Amato J, Khaled GH, Russi MB, O’Connor PG, Edberg SC, Pisani MA, Cain HC, Tanoue L, Weissman DN 2006. High rate of negative results of tuberculin and QuantiFERON tests among individuals with a his-tory of positive skin test results. Infect Control Hosp Epidemiol
27: 436-441.
Hill PC, Brookes RH, Fox A, Jackson-Sillah D, Jeffries DJ, Lugos MD, Donkor SA, Adetifa IM, de Jong BC, Aiken AM, Adegbola RA, McAdam KP 2007a. Longitudinal assessment of an ELISPOT test for Mycobacterium tuberculosis infection. PLoS Med 4: e192.
Hill PC, Jeffries DJ, Brookes RH, Fox A, Jackson-Sillah D, Lugos MD, Donkor SA, de Jong BC, Corrah T, Adegbola RA, McAdam KP 2007b. Using ELISPOT to expose false positive skin test con-version in tuberculosis contacts. PLoS ONE 2: e183.
Lee SS, Liu YC, Huang TS, Chen YS, Tsai HC, Wann SR, Lin HH 2008. Comparison of the interferon-gamma release assay and the tuber-culin skin test for contact investigation of tuberculosis in BCG-vaccinated health care workers. Scand J Infect Dis 40: 373-380.
Leyten EM, Prins C, Bossink AW, Thijsen S, Ottenhoff TH, van Dis -sel JT, Arend SM 2007. Effect of tuberculin skin testing on a My-cobacterium tuberculosis-specific interferon-gamma assay. Eur Respir J 29: 1212-1216.
Mazurek GH, Jereb J, Lobue P, Iademarco MF, Metchock B, Vernon A 2005. Guidelines for using the QuantiFERON-TB Gold test for detecting Mycobacterium tuberculosis infection, United States.
MMWR Recomm Rep 54: 49-55.
Mazurek GH, Jereb J, Vernon A, LoBue P, Goldberg S, Castro K 2010. Updated guidelines for using interferon gamma release assays to detect Mycobacterium tuberculosis infection - United States, 2010. MMWR Recomm Rep 59: 1-25.
Menzies D 1999. Interpretation of repeated tuberculin tests. Boosting, conversion and reversion. Am J Respir Crit Care Med 159: 15-21.
Moon HW, Hur M 2013. Interferon-gamma release assays for the di-agnosis of latent tuberculosis infection: an updated review. Ann Clin Lab Sci 43: 221-229.
Pai M, Dheda K, Cunningham J, Scano F, O’Brien R 2007. T-cell as-says for the diagnosis of latent tuberculosis infection: moving the research agenda forward. Lancet Infect Dis 7: 428-438.
Pai M, Joshi R, Dogra S, Mendiratta DK, Narang P, Kalantri S, Reingold AL, Colford Jr JM, Riley LW, Menzies D 2006. Serial testing of health care workers for tuberculosis using interferon-gamma assay. Am J Respir Crit Care Med 174: 349-355.
Pai M, Joshi R, Dogra S, Zwerling AA, Gajalakshmi D, Goswami
K, Reddy MV, Kalantri A, Hill PC, Menzies D, Hopewell PC
2009. T-cell assay conversions and reversions among household contacts of tuberculosis patients in rural India. Int J Tuberc Lung Dis 13: 84-92.
Pai M, O’Brien R 2007. Serial testing for tuberculosis: can we make sense of T cell assay conversions and reversions? PLoS Med 4: e208.
Park JS, Lee JS, Kim MY, Lee CH, Yoon HI, Lee SM, Yoo CG, Kim YW, Han SK, Yim JJ 2012. Monthly follow-ups of interferon-gamma release assays among health-care workers in contact with patients with TB. Chest 142: 1461-1468.
Rafiza S, Rampal KG 2012. Serial testing of Malaysian health care workers with QuantiFERON(R)-TB Gold In-Tube. Int J Tuberc Lung Dis 16: 163-168.
Ringshausen FC, Nienhaus A, Schablon A, Schlosser S, Schultze-Werninghaus G, Rohde G 2010. Predictors of persistently posi-tive Mycobacterium-tuberculosis-specific interferon-gamma responses in the serial testing of health care workers. BMC Infect Dis 10: 220.
Ringshausen FC, Schablon A, Nienhaus A 2012. Interferon-gamma release assays for the tuberculosis serial testing of health care workers: a systematic review. J Occup Med Toxicol 7: 6.
Ritz N, Yau C, Connell TG, Tebruegge M, Leslie D, Curtis N 2011. Absence of interferon-gamma release assay conversion following tuberculin skin testing. Int J Tuberc Lung Dis 15: 767-769.
Sauzullo I, Massetti AP, Mengoni F, Rossi R, Lichtner M, Ajassa C,
Vullo V, Mastroianni CM 2011. Influence of previous tubercu-lin skin test on serial IFN-gamma release assays. Tuberculosis (Edinb) 91: 322-326.
Serrano-Escobedo CJ, Enciso-Moreno JA, Monarrez-Espino J 2013. Performance of tuberculin skin test compared to QFT-IT to detect latent TB among high-risk contacts in Mexico. Arch Med Res 44: 242-248.
Shah M, Kasambira TS, Adrian PV, Madhi SA, Martinson NA, Dor-man SE 2011. Longitudinal analysis of QuantiFERON-TB Gold In-Tube in children with adult household tuberculosis contact in South Africa: a prospective cohort study. PLoS ONE 6: e26787.
Slater ML, Welland G, Pai M, Parsonnet J, Banaei N 2013. Challeng-es with QuantiFERON-TB Gold assay for large-scale, routine screening of US healthcare workers. Am J Respir Crit Care Med 188: 1005-1010.
Trajman A, Steffen RE, Menzies D 2013. Interferon-gamma release
assays versus tuberculin skin testing for the diagnosis of latent tuberculosis infection: an overview of the evidence. Pulm Med 2013: 601737.
Whitworth WC, Hamilton LR, Goodwin DJ, Barrera C, West KB, Racster L, Daniels LJ, Chuke SO, Campbell BH, Bohanon J, Jaffar AT, Drane W, Maserang D, Mazurek GH 2012.
Within-subject interlaboratory variability of QuantiFERON-TB Gold
In-Tube tests. PLoS ONE 7: e43790.