Polistine social wasps are important components of Neo-tropical ecosystems due to their ubiquity and diversity, as well as by the complex interactions with other organisms. They are mainly predators of other insects, especially Lepi-doptera caterpillars, but also collect various natural materi-als including wood fibers and nectar (Gobbi et al. 1984; O’Donnell 1995; Raveret-Richter 2000; Richards 1971, 1978). Some studies have also shown them to be important as flower visitors and potential pollinators of plant species (Granja e Barros 1998; Heithaus 1979; Hermes & Köhler 2006; Sühs et al. 2009). Social wasps are among the better studied groups of insects in Brazil. However, until recently, most survey work has been conducted as qualitative museum
inventories, without special concern for the controlling of benchmark aspects as collecting effort or area explored. The work of Adolpho Ducke (1904, 1905, 1907) represents a land-mark pioneering initiative of a resident scientist in the Ama-zon region in surveying one of world’s richest wasp faunas. The wasp fauna of the Brazilian Amazon is currently known to comprise 20 genera and about 200 species, representing nearly two-thirds of the total Brazilian wasp fauna (Carpen-ter & Marques 2001; Silveira 2002, Silveira et al. 2008).
Several authors have recently published wasp inventories based on protocols amenable to replication in different areas so that more comparable information is expected to result from these studies (Corbara et al. 2009; Elpino-Campos et
rain forest in Caxiuanã, Pará, Brazil (Hymenoptera, Vespidae, Polistinae)
Orlando Tobias Silveira1, Suzanna de Sousa Silva1, Jorge Luis Gavina Pereira1 & Ingrid da Silva Tavares2
1Museu Paraense Emílio Goeldi, Coordenação de Zoologia, Av. Perimetral 1901, 66077–830 Belém-PA, Brazil. orlando@museu-goeldi.br 2Coordenação de Botânica.
ABSTRACT. Local-scale spatial variation in diversity of social wasps in an Amazonian rain forest in Caxiuanã, Pará, Brazil (Hy-menoptera, Vespidae, Polistinae). Polistine wasps are important in Neotropical ecosystems due to their ubiquity and diversity. Inventories have not adequately considered spatial attributes of collected specimens. Spatial data on biodiversity are important for study and mitigation of anthropogenic impacts over natural ecosystems and for protecting species. We described and analyzed local-scale spatial patterns of collecting records of wasp species, as well as spatial variation of diversity descriptors in a 2500-hectare area of an Amazon forest in Brazil. Rare species comprised the largest fraction of the fauna. Close range spatial effects were detected for most of the more common species, with clustering of presence-data at short distances. Larger spatial lag effects could also be identified in some species, constituting probably cases of exogenous autocorrelation and candidates for explanations based on environmental factors. In a few cases, significant or near significant correlations were found between five species (of Agelaia, Angiopolybia, and Mischocyttarus) and three studied environmental variables: distance to nearest stream, terrain altitude, and the type of forest canopy. However, association between these factors and biodiversity variables were generally low. When used as predictors of polistine richness in a linear multiple regression, only the coefficient for the forest canopy variable resulted signifi-cant. Some level of prediction of wasp diversity variables can be attained based on environmental variables, especially vegetation structure. Large-scale landscape and regional studies should be scheduled to address this issue.
KEYWORDS. Neotropical wasps; polistine faunas; spatial analysis; biodiversity; forest habitats.
RESUMO.Variação na diversidade de vespas sociais em escala local numa floresta pluvial amazônica em Caxiuanã, Pará, Brasil (Hymenoptera, Vespidae, Polistinae). Vespas sociais são importantes nos ecossistemas neotropicais pela abundância e diversidade. A maioria dos inventários recentes não têm dedicado atenção aos atributos espaciais dos espécimes coletados. Dados espaciais são importantes para estudar e mitigar impactos sobre ecossistemas naturais e proteger espécies. Este artigo descreve e analisa em escala local padrões espaciais de registros de coleta, investigando também a variação espacial de descritores de diversidade numa área de 2.500 hectares de floresta amazônica no Brasil. Espécies raras constituíram a maior parte da fauna. Efeitos espaciais de curta distância foram detectados para a maioria das espécies mais comuns, com agregação de registros em distâncias até ca. 800 metros. Hiatos espaciais maiores foram identificados para algumas espécies, constituindo provavelmente autocorrelação exógena e candidatos a explicação por fatores ambientais. Nalguns casos, foram encontradas correlações significativas (ou quase) entre cinco espécies (de Agelaia, Angiopolybia e Mischocyttarus) e três variáveis ambientais estudadas: distância ao riacho mais próximo, altitude topográfica e tipo de copa da floresta. A associação desses fatores com variáveis de biodiversidade foi geralmente baixa. Quando utilizados como preditores de riqueza de Polistinae numa regressão linear múltipla, apenas o coeficiente para tipo de dossel florestal resultou significativo. Alguma predição mostra-se possível sobre variáveis de biodiversidade com base no conheci-mento de condições ambientais, especialmente estrutura da vegetação. Estudos devem ser agendados para tratar do assunto em escalas espaciais mais amplas.
al. 2007; Gomes & Noll 2009; Kumar et al. 2009; Morato et al. 2008; Santos et al. 2007a; Santos et al. 2007b; Santos et al. 2009a; Santos et al. 2009b; Silva & Silveira 2009; Silva-Pereira & Santos 2006; Silveira 2002; Tanaka Jr. & Noll 2011; Togni 2009). The collecting methods usually employed ac-tive searches for colonies and individuals, Malaise traps, au-tomatic traps with some attractive material, or a combina-tion of baits with active netting of attracted individuals. Besides being able to compare sites, another advantage of using protocols based on replicate samples has been the pos-sibility of estimating upper limits for local species richness (Cowell & Coddington 1994). With few exceptions, however, these studies have not dedicated attention to the spatial at-tributes of the collected specimens or the spatial dimension of the data. Most studies have been carried out at landscape scales, sometimes involving comparisons between habitats in adjacent patches or along transects – while more explicit spatial designs and methods have generally been under-utilized.
Spatial data on biodiversity are important components of the information needed to study and mitigate anthropogenic impacts on natural ecosystems and protect species (Williams et al. 2002). Many basic questions of conservation planning depend on information about biodiversity distribution: where certain species occur or are more abundant, where there are more species or endemic taxa, where certain taxa are more vulnerable to extinction, and how intrinsic population and environmental factors interact in time and space to affect spe-cies distributions (Boakes et al. 2010; Diniz-Filho et al. 2009; Elith & Leathwick 2009; Fritz et al. 2009; Guisan & Thuiller 2005). Modern techniques for mapping biodiversity or for modeling species distributions have been developed through advances in the past few decades in remote data acquisition, computational technologies, and analytical methods that can elucidate spatial relationships of biological processes and pat-terns at various scales (Fortin & Dale 2005; Philips et al. 2006; Rangel et al. 2006; Rosenberg & Anderson 2011; Storch & Gaston 2004). Of particular importance are meth-ods for studying different kinds of spatial autocorrelations in species distributions and identifying possible associations with environmental and/or geographic variables (Diniz-Filho et al. 2003; Fortin et al. 2002; Legendre 1993).
The present paper describes and analyzes local-scale spa-tial patterns in the collecting records of social wasps, as well as the spatial variation in diversity descriptors in a 2500 hect-are hect-area of Amazon rain forest in Brazil.
MATERIAL AND METHODS
The study was supported by PPBio (Program of Research on Biodiversity), an inter-institutional scientific program for the study of Amazonian biodiversity sponsored by the Bra-zilian government. A major goal of the program is creation of a research network to assess biological diversity at differ-ent scales, and understanding the processes that influence species distribution in the Amazon rainforest. This is
pur-sued by adoption of a unified spatial design and structured inventory protocols (see below).
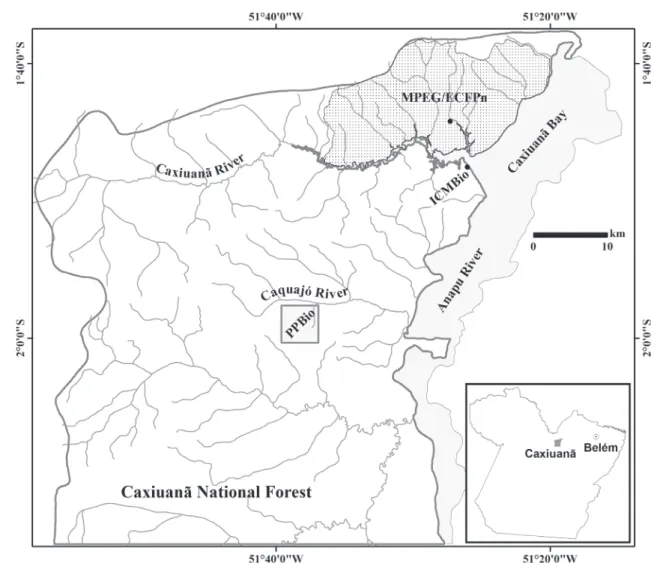
Study area. The Caxiuanã PPBio plot is a 25 km2 forest area located in the “Floresta Nacional de Caxiuanã” (FLONA Caxiuanã; Fig. 1), a large conservation reserve with 300.000 hectare distant 400 km from Belém, Pará state, Brazil (Silva & Silveira 2009). The climate is Köppen’s tropical humid type (Ami) (Costa & Morais 2002; see also figure 5). The studied site is covered mainly by undisturbed high “terra firme” forest (Fig. 2). However, variably sized clearings ex-ist resulting from the falling of large branches and trees (Fig. 3 B), often with subsequent proliferation of vines. The forest is seasonally flooded at some places by the overflow of small forest streams (Fig. 3 C).
Field collecting procedures. Three expeditions were
made to the study area along the year 2006: March-April (16 days; rainy season), July-August (18 days; beginning of dry season) and October-November (10 days; peak of dry sea-son), adding to a total of 44 days of fieldwork. Samples were collected in a square plot of 5x5 km, traversed by a system of two perpendicular sets of six 5-km trails intercrossing at in-tervals of one kilometer in grid-like fashion, resulting in a total of sixty 1-km trail segments which were treated as sam-pling units (Fig. 4). Each 1-km trail section in the plot was marked every 100 m, thus allowing the recording of the ap-proximate point in the trail system where wasp individuals or colonies were found. All sixty trail segments were sur-veyed for wasps by three to four collectors who explored the vegetation up to five meters on each side of the trail (and to a similar height above it, by visual inspection of the lower tree branches). The entire PPBio plot was explored in a pro-gressive manner, with 12 trail samples being surveyed dur-ing the first expedition (the northeastern sector of the 5x5 km plot) 28 trail sections during the second expedition (mainly the northwestern sector), and 20 trail sections dur-ing the third expedition (southern sector) (Fig. 4).
During the first expedition (training phase), the collec-tors spent up to four or five hours on each trail section; trail sections were covered in about two hours during the other two expeditions. Malaise traps (Townes model) were placed at 26 points (for 10-day periods), with 22 of them being lo-cated at trail intersections separated by 1000 m (Fig. 4). Four traps were set up at internal points along two trails in the southern sector of the plot. Three of these were relatively close (200 m) to previously sampled intersections, while the fourth was near an unsampled intersection. Ten traps were set in the northern sector of the plot during the first expedi-tion (rainy season); 10 and 6 traps were set in the western and southern sectors of the plot, respectively, during the sec-ond and third expeditions (at the beginning and peak of the dry season).
Altitudinal data. Topographic data were made available
Drainage. The drainage data of the PPBio plot were col-lected from “TOPODATA – Geomorphometric Database of Brazil”, available at <http://www.dsr.inpe.br/topodata/>, based on data generated by the Shuttle Radar Topography Mission (SRTM). The SRTM data, originally with 90 m reso-lution, were interpolated to produce information on terrain altitude with a 30 m resolution. Based on field observations, the 35 m quota was defined as the upper limit of altitudes indicating the occurrence of streams. Polygons of areas be-low the 35 m quota were superimposed onto horizontal cur-vature data from TOPODATA and the lines digitalized fol-lowing the lowest values – which then theoretically represented courses of water flow (Fig. 4). The least distance between the center of a sampling trail and the nearest stream was found with the ArcGIS tool “Near” (ESRI 2004). Values indicating the proximity of samples to forest streams repre-sent the environmental variable NEARHYDR.
Land Cover. A land cover classification was produced for part of the area of the FLONA Caxiuanã, including the PPBio plot, based on Landsat satellite imagery and using a
supervised approach by regions (Fig. 2). The study area is dominated by Upland Forest – Heterogeneous Canopy (67.6%) that, together with the Homogeneous Canopy type (8.3%), occupies the highest areas (~46 m). Areas with Slope Forests (8.0%) and Secondary Regrowth (1.6%) occupy in-termediate topographic altitudes (~42 m). Water-associated vegetation (12.0%) occupies the lower topographic levels (~39 m). In the PPBio plot itself, where the collecting activi-ties were undertaken, Upland Forest – Heterogeneous Canopy (61.7%) and Homogeneous Canopy (26.2%) predominated. In addition to differences in spectral responses, there were also differences in terrain elevation and slope. The environ-mental variable HETCAN% describes the proportional area (of a 1000 x 200 m2 rectangle centered along the trail) of each sampling trail with the spectral properties of a hetero-geneous canopy.
Phytosociological studies are in progress in the area and are expected to confirm the satellite data classifications. Pre-liminary field observations revealed that the PPBio plot has a forest canopy approximately 25 to 30 meters tall, with
emergent individuals with heights varying from 35 to 45 meters, such as Eschweilera sp., Manilkara huberi (Ducke) A.Chev., Couratari guianensis Aubl., Swartzia polyphylla D.C., Hymenolobiumpetraeum Ducke. The understory is generally open with some palm trees, principally Astrocaryum gynacanthum Mart. and Bactris sp. The most abundant vines are Doliocarpusdentatus (Aubl.) Standl., Bauhinia guianen-sis Aubl., and Derris sp. Phytophysiognomies resembling open areas (secondary regrowth with abundant vines) cover rela-tively large areas, with great abundances of vines, especially in the southern sector of the plot. Recruitment of resident spe-cies appears to be intense, and these plants form an intermedi-ate stratum from 15 to 25 meters tall.
Spatial distributions of wasp records. Metric coordinates
of the collecting locations of individual wasps and colonies within the grid system are expressed as either UTM coordi-nates (for input in the ARCGis program (ESRI 2004) and map preparation), or as Cartesian coordinates (in other programs).
Data analysis. The distributions of species records were
treated either as primary maps for visual inspection, or grouped by sample in the various analyses performed and thus organized as the biodiversity variables: ABUND: num-bers of polistine records per sample; RICHNESS: total polistine species per sample; RAgAn: number of species of the epiponine clade (Agelaia+Angiopolybia); RMischo: num-ber of species of the genus Mischocyttarus; RPolybia
Fig. 3. Photographs showing different aspects of forest vegetation in the studied area in the FLONA Caxiuanã. A- undisturbed high forest; B- open forest with natural clearings; C- vegetation around a small seasonal forest stream (igarapé), with a fallen tree serving as bridge for collectors; D- detail of tree branch with nest of Angiopolybia pallens.
ber of species of the genus Polybia. Two subsets of 25 sam-pling trails in the PPBio plot with maximum richness (63 species; excluding two species captured only in Malaise traps; Silva & Silveira 2009) were considered in the analyses as richness shortcuts. These sample subsets were iteratively iden-tified using computer software (DIVA-GIS; Hijmans et al. 2005) as containing the largest numbers of species in as few samples as possible, and eventually the total number of spe-cies found in the studied area.
Sample rarity scores. Rarity analysis as described by
Lobo et al (2008) was used to calculate a synthetic rarity
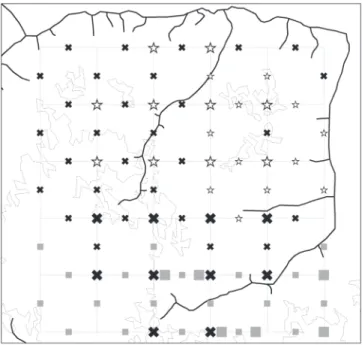
Fig. 4. Scheme of the grid system at the 5x5 km PPBio plot with indication of drainage and major spectral types of forest canopy; different symbols in-dicate the epoch of the year a given 1000m trail was sampled in 2006 (first expedition: March-April, rainy season; second expedition: July-August, be-ginning of dry season; third expedition: October-November, dry season). All 60 trails were actively searched for wasps; larger symbols refer to 26 Malaise traps, most installed at intersections of the grid. Expedion: 1 µ 2 3.
Fig. 5. Monthly precipitation (mm) in Caxiuanã for the years 2005, 2006 and 2007 (data from the LBA Project; provided by W.J.S Souza).
B
D A
score (RI) for each sample in the PPBio plot. This variable is a linear combination of three rarity indexes: Rarity value (R; the sum, by sample, of the reciprocals of the absolute fre-quencies of each of the constituent species); Mean Rarity (RM; R divided by the number of species in a given sample); Numbers of rare species in a given sample (RS). The syn-thetic scores for each of the sixty samples were calculated using principal component analysis of the correlation matrix of the three rarity indexes cited above, and are expressed as the variable RARITY.
Join Count Analysis. Spatial patterns for binary data
(pres-ence/absence) in redefined sampling units were assessed by join count statistics (Fortin & Dale 2005). Join counts can be computed for different classes of distances between pairs of points; i.e. two points are considered “connected” and included in the test if the distance separating them falls within the lim-its of a specified distance class. Join count analyses (only 1x1 matches) were made with the program PASSAGE (Pattern Analysis, Spatial Statistics and Geographic Exegesis; Rosenberg & Anderson 2011; see also Durães et al. 2005 for another study of insect ecology using this program) to investi-gate the occurrence of spatial autocorrelations in intraspecific data grouped as presence/absence in 100 m trail segments.
The distances between these smaller trail segments (as measured from their centers) were used as the criterion to include pairs of samples into each of five distance classes. This finer-scale grouping of the recorded data (100 m; within the resolution limits of the spatial measurements made in the plot) permits the detection of autocorrelations at short dis-tances that may be related to colony territorial effects or mi-gratory processes.
Autocorrelation Analysis. Spatial autocorrelation is a
measure of the lack of randomness of a variable due to spa-tial structuring (Fortin et al. 2002; Rosenberg & Anderson 2011). Moran’s I coefficient computes the degree of correla-tion between the values of a variable as a funccorrela-tion of spatial lags. Plotting Moran’s I against distance classes results in a spatial correlogram. In the present study, spatial correlograms were used to investigate spatial structuring among biodiversi-ty variables and environmental factors (considering the origi-nal 1-km samples), with Moran’s coefficients being computed for five distance classes using the program SAM (Spatial Analysis in Macroecology; Rangel et al. 2006; see also Sabu et al. 2008 for another study of insect ecology using this pro-gram). The centers of the trails were considered reference points for measuring the distances between samples (i.e. data obtained from linear trail segments were treated as referring to points).
Association between biodiversity variables and envi-ronmental factors. In these analyses, samples were always
1 km trail segments. Intraspecific variables describing spe-cies occurrences refer simply to their presence/absence in samples, and the calculated correlations in these cases are point biserial coefficients (computed only for species re-corded in at least three samples). In relations involving con-tinuous and count variables, computed correlations are
Pearson’s product-moment coefficients and significance tests used Dutilleul’s correction for spatial autocorrelation as implemented by the program SAM (Rangel et al. 2006). Data obtained in Malaise traps were also included in some analy-ses as a type of true point-sample information.
Linear multiple regression analyses were performed using environmental factors as predictor variables and the general abundances of polistines (ABUND) and the numbers of spe-cies (RICHNESS) as response variables; Principal compo-nent analysis was used to reduce the dimensions of the cor-relation matrices.
RESULTS
Intraspecific patterns. Species names cited here can be
found in their complete form in Appendix 1. A taxonomic list and other information concerning the wasp fauna col-lected in the Caxiuanã PPBio plot can be encountered in Silva & Silveira (2009); voucher specimens were deposited in the Museu Goeldi, Belém (MPEG). Sixty-five species of social wasps were encountered in the PPBio plot, raising to one hundred the number of known polistines in the region around the FLONA Caxiuanã. The spatial distributions of wasp records collected by active searches and Malaise traps are presented in Figures 6-8, including species with different levels of abundance, ranging from very abundant species such as Agelaiafulvofasciata (Fig. 6A) and Angiopolybiapallens (Fig. 6B) to uncommon species such as Polybiaplatycephala (Fig. 8F).
Uncommon and rare species comprised far greater pro-portions of the wasp fauna, with forty species (62%) being recorded in only one to three places in the entire 5x5 km plot. The two collecting methods agreed fairly well with re-gards to the distribution patterns of the most common spe-cies of the genera Agelaia and Angiopolybia, but disagreed markedly with respect to species of Mischocyttarus and Polybia, the two most speciose genera of local Amazonian faunas. While reasonable numbers of Mischocyttarus spe-cies were found with certain regularity along the trails, most were absent from Malaise traps. Some species of Polybia, such as P. liliacea (Fig. 8A) and P. emaciata (Fig. 8D), dem-onstrated inverse tendencies, being rarely found or even ab-sent during active searches but better repreab-sented in Malaise captures. Figures 8G and H present general summaries of these two genera from active searches – yielding two differ-ent and rather surprising data sets given the fact that Polybia colonies are generally of much larger sizes.
Some degree of clustering of the records obtained by ac-tive search in trails is immediately apparent in many cases, especially among species with intermediate numbers of records. Table I displaying the results of join count analysis shows significant evidence of positive short-distance autocorrelation (in the first distance class up to 791 meters) for most of the more abundant species.
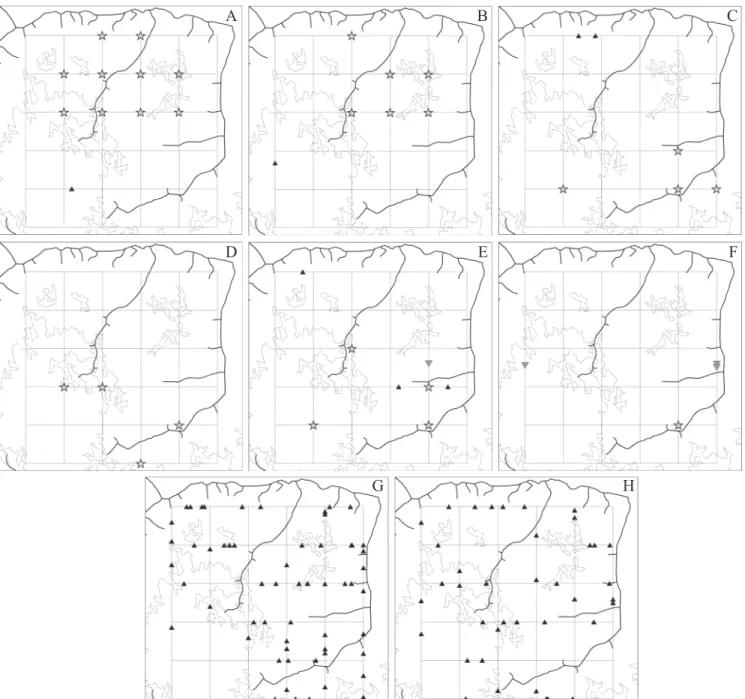
respec-Fig. 6. Distribution of wasp occurrences in the PPBio plot, with indication of drainage and spectral types of canopy; A- A. fulvofasciata, B. An. pallens, C-A. pallipes, D- C-A. angulata, E- An. paraensis, F- C-A. centralis, G- C-A. testacea, H- C-A. myrmecophila; colonies are larger inverted grey triangles; stars are captures in Malaise traps. Figure 11. Biplot with two first axes of principal component analysis (above; PC1, horizontal; PC2, vertical) performed on correlation matrix of five environmental/biodiversity variables (NEARHYDR, ALTITUD, HETCAN%, RICHNESS, ABUND). Graph at bottom-right for analysis (pc1’, pc2’) substituting partial richnesses of clades (Agelaia+Angiopolybia), Mischocyttarus, and Polybia (RAgAn; RMischo; RPolybia); 60 samples represented according to their scores; correlations between variables and principal axes as directions indicated by lines; eigenvalues and loadings in associated table; filled squares are samples on southwestern quadrant of the plot; open squares on northwestern quadrant; crosses on eastern side; open circles are samples along the central meridian crossing the plot.
tively suggest a clinal pattern, as in Agelaiafulvofasciata (Fig. 6A), Angiopolybiapallens (Fig. 6B), Angiopolybiaparaensis (Fig. 6E) and Agelaiacentralis (Fig. 6F). In other cases, sig-nificant positive effects detected at both near and far dis-tances appear to be in agreement with the visual aspects of some distributions, with several small clusters spread over the plot as in Agelaiaangulata (Fig. 6D), Agelaiatestacea (Fig. 6G), Agelaiaangulicollis (Fig. 7C) and Mischocyttarus carbonarius (Fig. 7D).
Two additional impressions emerge from the inspection of intraspecific data in figures 6-8. The first one is that there were generally more wasp records on the eastern side of the plot. The second refers to eventual associations of small clus-ters of records with forest streams, which seem more evident in species like Agelaiaangulata, Agelaitestacea and Agelaia angulicollis (Figs. 6 D, G; 7C). The eastern side of the plot has a prevalence of vegetation with spectral properties sug-gesting a slightly higher and more heterogeneous canopy,
A B C
D E F
while the western side corresponds to a watershed region where the forest canopy is more homogeneous. Correlation analyses of intraspecific data with environmental variables, however, resulted in significant or near significant coeffi-cients for only five species (Table II and Appendix 1). Agelaia angulata, Angiopolybiapallens, and Mischocyttarusduckei showed significant or near significant negative correlation with the variable expressing the distance to the nearest forest stream (NEARHYDR). Some of these species showed simi-lar results in respect to the variable expressing mean topo-graphic altitude (ALTITUD), in this case being also included the species Agelaiacentralis. Agelaiaangulicollis
demon-strated a similar negative relationship with distance to the nearest stream, but only if information from Malaise traps was added to the dataset (see Fig. 7C). Only three species (Angiopolybia pallens, Agelaia centralis and Agelaia cajennensis) presented significant or near significant corre-lation with the variable expressing canopy spectral proper-ties (HETCAN%). The addition of Malaise data, however, altered the correlation probabilities for some of these spe-cies.
Interspecific patterns. The spatial distributions of
spe-cies richness and general abundance of polistines along the sampling trails in the PPBio plot are presented in Figures 9A
Fig. 7. Distribution of wasp occurrences in the PPBio plot, with indication of drainage and spectral types of canopy; A- L. dorsata, B. M. lecointei, C- A. angullicollis, D- M. carbonarius, E- P. dimidiata, F- P. cattillifex, G- M. sylvestris, H- M. oecothrix; colonies are larger inverted grey triangles; stars are captures in Malaise traps.
A B C
D E F
Table I. Results of Join Count analysis (1x1 matches) of occurrence data (active search only) of thirteen wasp species amongst the most frequent in the PPBio plot, with records resumed as presence/absence in 100 m trail segments. Column headings show the upper limits of distance classes in meters. Symbols + and – indicate respectively significant positive and negative departures (at 0.05 level) from the expected join count for a given distance class.
Species Distance classes
791 1077 1300 1570 1851 2036 2193 2393 2609 2847 3027 3185 3395 3640 3904 4100 4362 4719 5120 7001
A. fulvofasciata + + + + – – –
A. pallens + + – – – –
A. pallipes – – +
A. angulata + – – + – +
A. paraensis + + + + + – – – –
A. centralis + + + – –
A. testacea + – – + +
A. myrmecophila +
A. angullicollis + +
M. carbonarius + + +
A. cajennensis + +
M. nr. mallaris + +
P. gorytoides +
and C. The visual aspects point to larger numbers in the east-ern sector of the plot in both cases; the Malaise data appear to indicate much the same type of distribution in this respect (Fig. 9B). The fact that richness and abundance data are not randomly distributed over the plot was also confirmed by autocorrelation analyses. In the correlograms of figures 10A and B, both variables show clear signs of spatial structuring, with rather low but significant Moran’s coefficients for most of the distance classes.. The pattern of positive autocorrelation within near distances classes and negative autocorrelation at far distances is consistent with the clinal aspect (east-west) observed in figures 9A and C. A similar correlogram (but
with a much stronger signal) resulted for the variable mea-suring the spectral properties of forest canopy (Fig. 10C). The correlograms for the variables describing distance to the nearest stream and mean topographic altitude were similar to each other (Figs. 10D and E), with alternating low posi-tive and negaposi-tive coefficients that probably reflect the distri-bution of hydrographic elements in the plot (larger streams are rather regularly separated by distances of about 3000m). The results of the correlation analyses of the biodiversity variables and environmental factors are summarized in Table II (Pearson coefficients). The interpretations of the probabil-ity tests may have been affected by the lack of normal distri-Table II. correlations of environmental factors with variables representing diversity aspects of polistine wasps, and with presence/absence descriptors for five species, along 1–km sampling trails in the PPBio plot (active search only). Symbols * and # indicate respectively significance and near significance (at 0.05 level); Dutilleul’s correction for spatial autocorrelation was used, except with the intraspecific variables and “diversity shortcuts”.
NEARHYDR ALTITUD HETCAN% RICHNESS ABUND RARITY
NEARHYDR – – – – – –0.03
ALTITUD 0.78* – – – – 0.07
HETCAN% –0.50* –0.50* – – – 0.09
RICHNESS –0.28# –0.23 0.42# – – 0.52*
ABUND –0.17 –0.20 0.33 0.72* – 0.19
RAgAn –0.35* –0.34* 0.38# 0.02
RMischo –0.06 –0.06 0.36* 0.63*
RPolybia 0.001 0.07 –0.02 0.45*
An. pallens –0.31* –0.30* 0.24# – – –
A. angulata –0.26* –0.30* 0.02 – – –
A. centralis –0.17 –0.33* 0.36* – – –
A. cajennensis 0.01 –0.08 0.24# – – –
M. duckei –0.25# –0.06 0.16 – – –
Shortcut1 –0.08 0.07 –0.01 0.37* 0.22# 0.75* Shortcut2 –0.02 0.08 0.03 0.37* 0.22# 0.74* NEARHYDR: least distance between the center of a sampling trail and the nearest stream; ALTITUD: mean topographic altitude along a sampling trail; HETCAN%: area proportion (of a 1000 x 200 m2 rectangle centered along a trail segment) with spectral properties indicating heterogeneous canopy;
Fig. 8. Distribution of wasp occurrences in the PPBio plot, with indication of drainage and spectral types of canopy; A- P. liliacea, B. P. striata, C- P. singularis, D- P.emaciata, E- P. gorytoides, F- P. platycephala; colonies are larger inverted grey triangles; stars are captures in Malaise traps; G and H – total records (active search only) of Mischocyttarus and Polybia species respectively.
butions. Only the variable for mean topographic altitude passed the Shapiro-Wilk normality test, while the richness variables for polistines (RICHNESS) and for the Agelaia-Angiopolybia clade (RAgAn) showed near normality. The remaining vari-ables showed right skewed distributions in most cases. How-ever, Spearman coefficients resulted quite similar in values and in significance tests. The richness of polistines showed generally rather low correlations with the environmental fac-tors (but slightly higher with respect to the canopy spectral properties variable HETCAN%), and often with losses of sta-tistical significance after using Dutilleul’s correction for spa-tial autocorrelation. The general abundance of wasp records
(ABUND) gave similar results, but with the correlation coef-ficients being even lower. As would be expected, richness and general abundance were highly correlated with each other. When species richness was split and investigated from the per-spectives of the three major clades (Agelaia+Angiopolybia, Mischoyttarus, and Polybia; comprising together about 80% of the species found in the plot), the results were remarkably different. Only the Agelaia-Angiopolybia clade (RAgAn) dem-onstrated a pattern of correlations similar to that found for total polistine richness, with even a slightly higher signal with respect to the variables related to streams and terrain eleva-tion. On the other hand, Mischocyttarus richness (RMischo)
A B C
D E F
Fig. 9. Spatial distribution of biodiversity variables for the social wasp fauna in the PPBio plot, with indication of drainage and major spectral types of forest canopy. A- species richness in 60 sampling trails; B- richness in 26 Malaise traps; C- numbers of wasp records in 60 sampling trails; D- samples’ synthetic rarity scores.
Fig. 10. Spatial correlograms with Moran’s autocorrelation coefficients (I) for five distance classes, indicating spatial structuring of variation in biodiversity variables and environmental factors in the PPBio plot; A- ABUND: number of wasp records; B- RICHNESS: number of polistine species; C- HETCAN%: area proportion (of a 1000 x 200 m2 rectangle centered along a trail segment) with spectral properties indicating heterogeneous canopy; D- NEARHYDR:
least distance between the centre of a sampling trail and the nearest stream; E- ALTITUD: mean topographic altitude; F- RARITY: sample’s score of rarity; coefficients marked with a “x” are significant at 0.05 level.
C
B
D
A B C
D E F
showed near zero correlations with these variables, although it had a firm significant correlation with the forest canopy variable. Quite remarkably, the richness of the genus Polybia (RPolybia) showed no evidence of correlations with any of the environmental factors, with all coefficients having near zero values.
The relationships between biodiversity variables and envi-ronmental factors can also be visualized in Figure 11, which presents plots of principal component analyses performed on the correlation matrices of the variables examined. The sub-space encompassed by the first two axes includes approximately 80% of the total variation, so that the angles between the lines representing the variables reasonably indicate their bivariate relations. The relational positions between the samples and the variables in the biplot show notable agreement with their actual physical-spatial relationships. Of particular interest is the graphical representation of the decomposition of polistine RICHNESS into the three variables for the less inclusive clades Mischocyttarus, Agelaia-Angiopolybia, and Polybia. In agree-ment with the bivariate correlations, the variable RMischo is nearly orthogonal to NEARHYDR and ALTITUD while show-ing some relationship to HETCAN%. In contrast, RPolybia is almost orthogonal to HETCAN%, although some level of as-sociation with the other two environmental variables is appar-ent in this subspace (all bivariate correlations involving RPolybia are near zero). The relationships with RAgAn are in good agreement with bivariate correlations.
The distribution of the variable expressing the synthetic rarity score of the sample (RARITY) is presented in Figure 9D. A distinct pattern cannot immediately be perceived and, in fact, no evidence of spatial effects could be detected by autocorrelation analysis (Fig. 10F). The correlogram for this variable has low non-significant Moran’s coefficients for all of the distance classes. The rarity variable showed moderately significant correlations only with the richness variables (ex-cept for the Agelaia-Angiopolybia clade, which had a near-zero correlation coefficient). Remarkably, rarity scores showed high point biserial correlations (around 0.75) with the two 25-sample richness shortcuts found by Silva & Silveira (2009) for the wasp fauna of the Caxiuanã PPBio plot.
Mean numbers of species and records per sample are pre-sented in table III. Differences are larger and significant when the first expedition is compared to the other collecting peri-ods, but only for samples obtained by active search. No sig-nificant differences were observed between the three peri-ods in the means of Malaise samples. Data collected previously with the same methods in nearby locations at the “Estação Científica Ferreira Penna” (ECFPn; see Fig. 1), as published by Silveira (2002), showed no significant seasonal differences in the mean numbers of of polistine species and individuals collected either along forest trails or in Malaise traps (Table IV). Differences in mean richness and abundance along trails of the first expedition relative to the other two expeditions in the PPBio plot were further investigated by linear multiple regression (Table V). These analyses tested the effects of two additional variables, one referring to the
Table III. Means and standard deviations of wasp diversity variables for each collecting period and season during the year 2006 in the PPBio plot in the FLONA Caxiuanã; MLRICHNESS and MLABUND are respectively the number of species and individuals in Malaise traps; other variables as in table II; symbol * refers to significant differences between means across periods (rainy period: March-April; transition period: July-August; dry period: October-November).
Period rainy transition dry All periods Active Search (n = 12) (n = 29) (n = 19) (n = 60) Richness * 6.8 (1.80) 4.8 (2.38) 5.3 (2.16) 5.3 (2.31)
RAgAn 4.2 (1.53) 3.0 (1.55) 3.4 (1.68) 3.4 (1.62) RMischo 1.2 (0.72) 1.0 (1.20) 0.7 (0.75) 0.9 (0.99) RPolybia 1.1 (0.90) 0.5 (0.63) 0.6 (0.90) 0.6 (0.80) remaining spp 0.4 (0.69) 0.2 (0.49) 0.6 (0.61) 0.4 (0.58) Abund * 16.4 (8.07) 8.0 (5.58) 8.3 (5.11) 9.8 (6.79) Malaise (n = 10) (n = 10) (n = 6) (n = 26)
MLRICHNESS 3.6 (1.78) 5.2 (4.32) 5.0 (2.37) 4.5 (3.09) MLABUND 8.6 (5.12) 9.4 (6.10) 11 (5.22) 9.5 (5.40)
Table IV. Means and standard deviations of wasp diversity variables for different seasons in the ECFPn, in the FLONA Caxiuanã, during the years 1998 and1999; MLRICHNESS and MLABUND are the species richness and number of individuals in Malaise traps; other variables as in table II; differences between means across periods are non-significant (rainy period: March/1998 and April-May/1999; transition period: June-July/1998; dry period: November/1998) (see also Silveira 2002).
Period rainy transition dry All periods Active Search (n = 8) (n = 9) (n = 6) (n = 23) Richness 4.6 (2.55) 3.3 (2.50) 5.3 (1.75) 4.3 (2.40) Malaise (n = 20) (n = 10) (n = 10) (n = 40) MLRICHNESS 4.3 (3.77) 5.7 (4.92) 4.2 (2.25) 4.6 (3.75) MLABUND 2.0 (1.30) 2.7 (1.64) 2.3 (1.42) 2.25 (1.41)
Table V. Statistical results of linear multiple regression analyses using respectively the general abundance of polistines (number of records; ABUND) and the number of species along trail samples (RICHNESS) as the response variables; as predictor variables, HETCAN% refers to differences in spectral properties of forest canopy in the PPBio plot, and EFFORT refers to the approximate difference in hours spent by collectors per sample between different expeditions.
Variable Standardized Coefficient Std. Error t P Value ABUND
Constant 0 2.677 -1.021 0.311 HETCAN% 0.235 0.029 2.058 0.044 EFFORT 0.44 1.921 3.855 <0.001 RICHNESS
Constant 0 0.956 1.945 0.057 HETCAN% 0.352 0.01 2.931 0.005 EFFORT 0.242 0.686 2.014 0.049
(doubled) time dedicated by collectors per sample in the first expedition (and not the quantity of rainfall) was responsible for the mean number of wasp records being about twice as large during this period, with a corresponding slightly larger richness. The kind of forest canopy (HETCAN%) is the other variable that significantly accounts for variation in wasp di-versity between expeditions, and across the PPBio plot. Re-siduals of these regressions showed low non-significant Moran’s autocorrelation coefficients for all distance classes.
DISCUSSION
Kind and limitation of the spatial data. Populations of
Neotropical polistine social wasps occupy the space by way of three kinds of socially integrated agents and their con-structs. Colonies are formed by highly mobile flying adult individuals (1) that perform a series of tasks in their home range to sustain and care for immature colony mates that are practically immobile in stationary nests that serve as homes/ nurseries (2). Additionally, in the tribe Epiponini, at times of colony division or in response to predators or other kinds of disturbance, a mobile colonial group or swarm (3) can travel a variable distance across the area until a new nesting site is found (Jeanne 1991). In independent founding Polistini and
Mischocyttarini, new colonies are founded by solitary fe-males or by (comparatively) very small groups formed mostly of sisters (Reeve 1991; Gadagkar 1991).
While individual foraging wasps are commonly seen while in flight, epiponine swarms are comparatively infrequent, and the wasp nests themselves are usually cryptic and difficult to find, especially in the rain forest interior, so that foraging indi-viduals are more easily recorded by wasp collectors (see fig-ures 6–8). Maps showing colonies would be an ideal type of representation of a species’ occupation of an area at small scales (informing the spatial variation in colony abundances). On the other hand, the occurrence of a foraging wasp individual is an indisputable indication of the presence of a nearby mother-colony, and maps of individual records may be considered partial instantaneous representations of a species’ distribution in a given locality. However, because of the spatially clumped structure of social groups, these maps would only provide a distorted picture of the spatial variations of species abundance. Variation in the number of detected individuals along a transect will be greatly affected by the pattern of proximities of colo-nies to each location on the transect line, more specifically by the distance to the nearest colony or cluster of colonies. Large numbers of individuals detected at a given point may simply indicate closer proximity to one or quite a few
nies. For points separated by small distances, this results in spatial autocorrelation caused by colonial territoriality (as in figures 6A, B, D, E, etc.; see also table I).
The above situation seems to be even less certain in the case of epiponine species that have very large colonies with many foraging individuals utilizing the space around the nest (see Zucchi et al. 1995 about extremely large colonies of Agelaia vicina (de Saussure, 1854) in southeastern Brazil). While this situation might not be a complicating factor in respect to the question of “which species are locally more abundant?” (or which species cause larger ecological im-pacts), it could often lead to false impressions in regard to the question “where is a given species more abundant?”. Another problem with mapping foraging individuals is that the different location records will not be simultaneous, and if the temporal lag becomes more accentuated in virtue of the normal logistic limitations encountered during field ex-peditions (especially in large areas like the Caxiuanã PPBio plot) it may result in the distributional data being scattered over time (if sampling progress is spatially unordered) and more susceptible to the effects of colony migration/extinc-tion, or being clustered (if sampling is spatially ordered) and thus susceptible to complicating seasonal effects (and to the effects of colony migration/extinction) (e.g. Fig. 4).
Rarity. An outstanding feature of the wasp fauna present
in the Caxiuanã PPBio plot is the local rarity of most species. Histograms of either species frequency or abundance showed quite abrupt transitions from the most abundant to uncommon and rare species (see Silva & Silveira 2009). Silveira (2002) surveyed a larger area (ECFPn) some 30 km north of the PPBio plot finding similar results with respect to the number of rare species. Skewed rank-abundance distributions are the norm in biological communities (Magurran & Henderson 2003), but is the extensive rarity in these forest wasp faunas a reasonable approximation of their real abundance profiles, or an artifact of inefficient collecting methods?
The method of active searches along trails used in this survey can be characterized as a line-census method (Ohgushi et al. 1998; Silveira 2002), in which searching activity is undertaken during a single pass through the environment at relatively low speed (under daylight conditions), even though the target objects are of limited visibility, especially if they sit at great heights above the ground. This method is not ex-pected to be highly efficient in surveying wasp species that nest or forage in the forest canopy, or that make highly cryp-tic nests, or that are nocturnal. Malaise traps, on the other hand, are passive capture devices typically set to operate at ground level at a single point for relatively long periods of time. If stationarity can to some extent be compensated for its prolonged operation time, capture efficiency would be expected to be dependent to a large extent on the target spe-cies’ behavior. For example, in figures 6–8, data from Mal-aise traps are in most cases concurrent with results of active search, but for some species they can otherwise significantly change one’s ideas on distribution/abundance, as for Agelaia angulicollis (Fig. 7C), and principally Polybialiliacea, P.
striata, P. singularis, P. emaciata, and P. gorytoides (respec-tively Figs. 8A, B, C, D, E). Extended trapping time and/or baiting could possibly compensate for the low detectability of some taxa, but the available results are not yet conclusive as to the cost/benefit aspects of these methods. While taking into account the great difference in size of regional faunas, it is interesting to note that the numbers of species (per sample) collected along several months along baited transects of vari-able lengths (sugar solution, Gomes & Noll 2009; Tanaka Jr. & Noll 2011;fruit juice, processed fish meat, Togni 2009) in semideciduous forests and “Mata Atlântica” (considering only core transects representing the typical habitats) in southeast-ern Brazil were not very different from the sample richness values obtained in this study, or from those presented by Silveira (2002).Baiting for social polistines is probably ef-fective at small ranges (actually increasing the continuous or discontinuous permanency of an individual at a given point). It is not yet known if the kinds of wasp baits currently used are sufficiently attractive to bring in individuals from more distantly located colonies, or even bringing them down from the forest canopy. Baits are expected to reduce problems re-lated to estimating abundance variation between sampling points for a single species, i.e. helping to respond to the ques-tion “where is a given species more abundant”. However, its utility in studies of the spatial distribution of species occur-rences will be dependent on implementation costs that would allow its regular application over the entire study area.
Techniques designed to account for low detectability in wildlife surveys depend on sampling repetitions to estimate the parameters to be used in models calculating unbiased species occupancy values (Gillera-Arroita et al. 2010; Royle et al. 2005). Because of the relatively large area covered by the present inventory (and its primary objectives) only very limited efforts were spent on repeated sampling. Two trail sections were chosen for an additional round of active search and complementary Malaise trap efforts. However, the ob-jective there was not to assess the detectability of particular species, but the related one of knowing about additional spe-cies that could be discovered. No extra spespe-cies were added to the ones found in the first programmed pass of the col-lecting team on these trails. Additionally, the generally greater times (ca. 4 hours) dedicated to sampling during the first expedition resulted in only a modest average increase (of two species) as compared to the other expeditions (Table III), and this was not independent on the effects of an environmental variable related to forest canopy (Table V). Given the low levels of the required information, it is difficult to gain a precise idea of how many wasp species will go unnoticed along a 1-km trail section in a typical undisturbed Amazon forest using the survey methods employed in this study.
rarity seems to be a real condition for many species of the Caxiuanã wasp fauna, these species are also generally known to have relatively wide distributions in the Amazon basin (Richards 1978), except for the unidentified and possibly new species, about which little information is available (mostly of Mischocyttarus). On the other hand, many of these species are probably dependent on relatively undisturbed forest habitats, presenting a situation of great concern that involves a combi-nation of wide geographical ranges with small or rarified lo-cal populations, and dependence on a yet widespread but highly threatened forest habitat.
Collecting record distributions and possible causal fac-tors. The spatial patterning of intraspecific distributions could
only be properly investigated in the cases of relatively com-mon and abundant species for which reasonable amounts of data had been collected. Close-range spatial effects were de-tected for most of these species, with presence data being clus-tered at distances below ca. 800 meters (Table I). These are most probably cases of endogenous autocorrelation related to colony home ranges and/or short range migratory processes. Larger spatial lag effects could also be identified in the distri-butions of certain species, constituting probably cases of ex-ogenous autocorrelation, and candidates for explanations based on environmental factors. In some species, the autocorrelated patterns suggest clinal variation of the causal factors, while the patterns of other species suggest the role of factors with clustered distributions. Autocorrelation analyses of the stud-ied environmental variables indicated that forest canopy (HETCAN%) conforms to a clinal variation pattern, while distance to forest streams (NEARHYDR) and mean ground altitude (ALTITUD) conform to clustered factors (Fig. 10).
In just a few cases, significant or near significant correla-tions were found among only five species and environmental variables (Table II). In spite of the general low magnitude of correlations involving species presence/absence descriptors, however, when viewed by groups some coherence is apparent in sign and values of the coefficients (Appendix 1). This can be seen for species of the Agelaia-Angiopolybia clade with respect to all three environmental variables, as well as for spe-cies of Mischocyttarus with respect to the variable of canopy type (HETCAN%). Too few Polybia species had enough data to compute correlations. Such weak but coherent patterns are apparently reflected in the correlations between two of the clades richness variables (RMischo, RAgAn) and environmen-tal variables (Table III). Interpretation is not for instance that Mischocyttarus species did not correlate in general to the vari-ables related to forest streams (NEARHYDR) or mean terrain altitude (ALTITUD), but that as for this group, the species tendencies were too different or incongruous. Species of the Agelaia-Angiopolybia clade, in contrast, showed generally more similar correlations with these variables. However, both of the clades mentioned above demonstrated concordant pat-terns of correlations between species richness and the forest canopy variable (HETCAN%). On the other hand, no level of richness prediction could be determined based on correlations with any of the studied environmental variables for Polybia.
Environmental variables were highly intercorrelated as was expected, and certainly subsume information on the resources/ habitat conditions required in different contexts by theses in-sects, as free water availability, wind and shading conditions at nesting sites, and possibly other aspects related to vegeta-tion structure. However, the observed ranges of these factors in the Caxiuanã plot are comparatively narrow, and the vari-able describing spectral properties of forest canopy (HETCAN%) can only be taken as a proxy for yet poorly un-derstood aspects of that vegetation. Furthermore, the observed levels of association of such factors with the biodiversity vari-ables must be considered low. When used as predictors of polistine richness in a linear multiple regression, only the co-efficient for variable HETCAN% resulted significant at a 0.05 probability level, and the associated coefficient of determina-tion (R2) was only about 17%, indicating a poor fit. Addition-ally, the different responses of the richness variables of the three less inclusive clades (Agelaia+Angiopolybia; Mischo-cyttarus; Polybia) in regard to association with the environ-mental variables serve as a call for caution about generaliza-tions made for large and heterogeneous taxa, and to emphasize the importance of considering peculiarities of the faunal com-position in a given region.
Apparent association between some species frequencies and the margins of large water bodies has been observed by Silveira (2002) in Caxiuanã, typically for species such as Mischocyttarus injucundus (cited as juruanus; see Silveira 2006), Apoica pallida, Polybia rejecta, Protopolybia emortualis and Chatergus metanotalis. However, such environments should be better considered as edge habitats, and most of these species were indeed absent from the PPBio plot (except for P. rejecta, which had a very low frequency). The observed weak association between collecting records of some species and their spatial proximity to small streams in a core high forest habitat (as in most of the PPBio plot) certainly represents a distinct phenomenon that will require additional investigation.
CONCLUSIONS
ant species were recently discussed by Corbara et al. (2009). However, if it becomes well established that species like Angiopolybia pallens or Agelaiacentralis are sensible to rather subtle habitat alterations, it will have important impli-cations for conservation planning and could be used as an indicator of the health/stress levels of forest habitats.
The results of the present work also demonstrated that modest levels of predictability of interspecific variables (such as sample’s species richness) can be based on one’s knowl-edge of environmental variables, especially vegetation struc-ture. This will be important to wasp conservation, and stud-ies at larger landscape and regional scales should be undertaken. The benefits of studying spatial phenomena at different geographical scales were noted by Storch & Gaston (2004) when they pointed out the influence of large-scale constraints on small-scale patterns and processes and the importance of dissecting macroecological phenomena in or-der to unor-derstand how these large-scale regularities emerge and how they are connected to one another.
In a direction opposite to that of the results for sample richness, another notable finding of this study refers to the poor capacity of predicting sample rarity scores from envi-ronmental variables. Because these quantities are related to compositional complementarity between samples, a practi-cal but undesirable consequence is that wasp inventories can-not benefit from earlier environmental information beyond the possibility of anticipating some variations in species rich-ness among different sites. Matters of scale must be consid-ered here, however, as well as taxonomic specificities. In a study of dung beetles covering the entire territory of France, Lobo et al. (2008) found that they relationships of rarity with species richness (or with environmental factors) varied among different taxa. Species turnover between samples across the PPBio plot were considerable, as judged by a mean richness of only 5.4 species per sample and a total richness of 65 spe-cies for the entire PPBio plot; i.e. the samples capture only a very small proportion of the locally occurring species (Koleff et al. 2003). Species turnover is probably several times smaller at a regional scale if one roughly considers the Amazon’s regional pool of ca. 250 species and a mean richness for lo-cal faunas of ca. 100 species (see Silveira 2002). As already pointed out above in regards to the lack of spatial patterns in rarity scores, such high local species turnover seem to be random relative to the spatial and environmental factors stud-ied. However, as noted earlier, the relatively low mean num-bers of species per sample may be a result of sampling bi-ases and the low detectability of rare species.
ACKNOWLEDGMENTS
We are grateful to Alexandre Felizola Diniz Filho and Edilberto Giannotti for reading and commenting upon an ear-lier version of the manuscript. We also thank “Programa de Pós-Graduação em Zoologia (MPEG/UFPA)” and the Brazi-lian “Conselho Nacional de Desenvolvimento Científico e Tecnológico” (CNPq) for a grant conceded to S. S. Silva
(132617/2005-6). Support given by the Moore Foundation is also greatly recognized (BECA Program – B/2005/02/BMP/ 16). The study was supported in many ways by the Brazilian government “Programa de Pesquisa em Biodiversidade da Amazônia” (PPBio).
REFERENCES
Boakes, E. H.; P. J. K. McGowan; R. A. Fuller; D. Chang-qing; N. E. Clark; K. O’Connor & G. M. Mace. 2010. Distorted views of biodiversity: spatial and temporal bias in species occurrence data. PLoS Biology 8: e1000385.
Carpenter, J. M. & O. M. Marques. 2001. Contribuição ao estudo dos vespí-deos do Brasil (Insecta, Hymenoptera, Vespoidea, Vespidae). Cruz das Almas, Universidade Federal da Bahia. Publicações digitais. Vol. 2. Corbara, B.; J. M. Carpenter; R. Céréghino; M. Leponce; M. Gibernau & A. Dejean. 2009. Diversity and nest site selection of social wasps along Guianese forest edges: assessing the influence of arboreal ants.
Comptes rendus Biologies 332: 470–479.
Colwell, R. K. & J. A. Coddington. 1994. Estimating terrestrial biodiversity through extrapolation. Philosophical Transactions of the Royal Society (Series B) 345: 101–118.
Costa, J. de P. R. da & J. C. de Morais. 2002. Médias mensais de variáveis meteorológicas (1996-1999), p. 225-232. In: P. L. B. Lisboa (org).
Caxiuanã: Populações tradicionais, meio físico e diversidade bio-lógica. Belém, Museu Paraense Emílio Goeldi, 734 p.
Diniz-Filho, J. A. F.; L. M. Bini & B. A. Hawkins. 2003. Spatial autocorre-lation and red herrings in geographical ecology. Global Ecology & Biogeography 12: 53–64.
Diniz-Filho, J. A. F.; L. C. Terribile; G. de Oliveira & T. F. L. V. B. Rangel. 2009. Padrões e processos ecológicos e evolutivos em escala regional.
Megadiversidade 5: 5–16.
Ducke, A. 1904. Sobre as Vespidas sociaes do Pará. Boletim do Museu Paraense Emílio Goeldi de História Natural e Etnografia 4: 317–374. Ducke, A. 1905. Nouvelles contributions à la connaissance des Vespides
sociales de l’Amérique du Sud. Revue Entomologique 24: 5–24. Ducke, A. 1907. Novas contribuições para o conhecimento das Vespas
(Vespidae sociales) da Região Neotropical. Boletim do Museu Para-ense Emílio Goeldi 5: 152–199.
Durães, R.; P. W. Martins & F. Z. Vaz-de-Mellos. 2005. Dung beetle (Coleoptera: Scarabaeidae) assemblages across a natural forest-cerrado ecotone in Minas Gerais, Brazil. Neotropical Entomology34: 721–731. Elith, J. & J. R. Leathwick. 2009. Species distribution models: ecological explanation and prediction across space and time. Annual Review of Ecology, Evolution, and Systematics 40: 677–697.
Elpino-Campos, Á.; K. Del-Claro & F. Prezoto. 2007. Diversity of social wasps (Hymenoptera: Vespidae) in Cerrado fragments of Uberlândia, Minas Gerais State, Brazil. Neotropical Entomology 36: 685–692. ESRI. 2004. ArcGIS 9. What is ArcGIS? Redlands, 119 p.
Fortin, M. -J. & M. R. T. Dale. 2005. Spatial Analysis: a guide for ecologists. Cambridge, Cambridge University Press, 365 p. Fortin, M. -J.; M. R. T. Dale & J. ver Hoef. 2002. Spatial analysis in ecology,
p. 2051–2058. In: A. El-Shaarawi & W.W. Piegorsch (eds.).
Encyclopedia of Environmetrics, vol. 4, Chichester, Wiley. Fritz, S. A.; O. R. P. Bininda-Emonds & A. Purvis. 2009 Geographical
variation in predictors of mammalian extinction risk: big is bad, but only in the tropics. Ecology Letters 12: 538–549.
Gadagkar, R. 1991. Belonogaster, Mischocyttarus, Parapolybia, and independent founding Ropalidia, p. 149–190. In: K. G. Ross & R. W. Matthews (eds). The social biology of wasps. Ithaca, Cornell University Press, xvii+678 p.
Guillera-Arroita, G.; M. S. Ridout & B. J. T. Morgan. 2010. Design of occupancy studies with imperfect detection. Methods in Ecology & Evolution 1: 131–139.
(Olivier, 1791) (Hym., Vespidae). Anais da Sociedade Entomológica do Brasil 13: 63–69.
Gomes, B. & F. B. Noll. 2009. Diversity of social wasps (Hymenoptera, Vespidae, Polistinae) in three fragments of semideciduous seasonal forest in the northwest of São Paulo State, Brazil. Revista Brasileira de Entomologia 53: 428–431
Granja e Barros, M. 1998. Sistemas reprodutivos e polinização em espéci-es simpátricas de Erythroxylum P. Br. (Erythroxylaceae) do Brasil.
Revista Brasileira de Botânica 21: 159–166.
Guisan, A. & W. Thuiller. 2005. Predicting species distribution: offering more than simple habitat models. Ecology Letters 8: 993–1009. Hartley, S. & W. E. Kunin. 2003. The scale-dependency of rarity, extinction
risk and conservation priority. Conservation Biology 17: 1559–1570 Heithaus, E.R. 1979a. Community structure of Neotropical flower visiting
bees and wasps: Diversity and phenology. Ecology 60: 190–202. Hermes, M. G. & A. Köhler. 2006. The flower-visiting social wasps
(Hymenoptera, Vespidae, Polistinae) in two areas of Rio Grande do Sul state, southern Brazil. Revista Brasileira de Entomologia 50: 268–274 Hijmans, R. J.; L. Guarino; A. Jarvis; R. O’Brien; P. Mathur; C. Bussink; M. Cruz; I. Barrantes & E. Rojas. 2005. DIVA-GIS version 5.2. http:/ /www.diva-gis.org/docs/DIVA-GIS5_manual.pdf.
Holt, R. D. 1996. Rarity and evolution: some theoretical considerations, p.[intervalo do capítulo]. In: W. E. Kunin, & K. J. Gaston (eds.). The Biology of Rarity: causes and consequences of rare-common differences. London, Chapman & Hall, 300 p.
Jeanne, R. L. 1991. The swarm-founding Polistinae, p. 191–231. In: K. G. Ross & R. W. Matthews (eds). The social biology of wasps. Ithaca, Cornell University Press, xvii+678 p.
Koleff, P.; K. J. Gaston & J. J. Lennon. 2003. Measuring beta diversity for presence–absence data. Journal of Animal Ecology 72: 367–382. Kumar, A.; J. T. Longino; R. K. Colwell & S. O’Donnell. 2009. Elevational
patterns of diversity and abundance of eusocial paper wasps (Vespidae) in Costa Rica. Biotropica 41: 338–346.
Kunin, W. E. & K. J. Gaston. 1993. The Biology of Rarity: Patterns, Causes and Consequences. Trends in Ecology and Evolution 8: 298–301. Legendre, P. 1993. Spatial Autocorrelation: Trouble or New paradigm?
Ecology 74: 1659–1673.
Lobo, J. M.; P. Jay-Robert & J. P. Lumaret. 2008. The relationship between forecasted rarity and species richness values for Scarabaeidae and Aphodiinae species in France (Coleoptera, Scarabaeoidea). Insect Ecology and Conservation: 299–317.
Magurran, A. E. & P. A. Henderson. 2003. Explaining the excess of rare species in natural species abundance distributions. Nature 422: 714–716. Morato, E. F.; S. T. Amarante & O. T. Silveira. 2008. Avaliação ecológica
rápida da fauna de vespas (Hymenoptera: Aculeata) do Parque Nacio-nal da Serra do Divisor, Acre, Brasil. Acta Amazonica 38: 789–798. O’Donnell, S. 1995. Necrophagy by Neotropical Swarm-Founding Wasps
(Hymenoptera: Vespidae, Epiponini). Biotropica 27: 133–136. Ohgushi, R.-i; S. Yamane & S. F. Sakagami. 1988. Ecological distribution
and habitat-linked density of colonies of Stenogastrine wasps in tropi-cal S. E. Asia. Zoological Science 5: 869–874.
Phillips, S. J.; R. P. Anderson & R. E. Schapire. 2006. Maximum entropy modeling of species geographic distributions. Ecological Modelling 190: 231–259. Rabinowitz, D.; S. Cairns & T. Dillon. 1986. Seven forms of rarity and
their frequency in the flora of the British Isles, p. 182–204. In: M. E. Soulé (ed) Conservation Biology: The Science of Scarcity and Diversity. Sunderland, Sinauer Associates, 584 p.
Rangel, T. F. L. V. B; J. A. F. Diniz-Filho & L. M. Bini. 2006. Towards an integrated computational tool for spatial analysis in macroecology and biogeography. Global Ecology & Biogeography 15: 321–327. Raveret Richter, M. 2000. Social wasp (Hymenoptera: Vespidae) foraging
behavior. Annual Review of Entomology 45: 121–150.
Reeve, H. K. 1991. Polistes, p. 99–148. In: K. G. Ross & R. W. Mathews (eds.).
The social biology of wasps. Ithaca, Cornell University Press, xvii+678 p. Richards, O. W. 1971. The biology of the social wasps (Hymenoptera:
Vespidae). Biological Review 46: 483–528.
Richards, O. W. 1978. The social wasps of the Americas: Excluding the Vespinae. London, British Museum, 580 p.
Rosenberg, M. S. & C. D. Anderson. 2011. PASSaGE: Pattern Analysis, Spatial Statistics and Geographic Exegesis. Version 2. Methods in Ecology & Evolution 2: 229–232.
Royle, J. A.; J. D. Nichols & M. Kéry. 2005. Modelling occurrence and abundance of species when detection is imperfect. Oikos 110: 353–359. Sabu, T. K.; P. J. Vineesh & K.V. Vinod. 2008. Diversity of forest litter-inhabiting ants along elevations in the Wayanad region of the Western Ghats. Journal of Insect Science8: 1–14.
Santos. G. M. M.; J. D. da Cruz; C. C. Bichara Filho; O. M. Marques & C. M. L. Aguiar. 2007a. Utilização de frutos de cactos (Cactaceae) como recurso alimentar por vespas sociais (Hymenoptera, Vespidae, Polistinae) em uma área de caatinga (Ipirá, Bahia, Brasil). Revista Brasileira de Zoologia 24: 1052–1056.
Santos. G. M. de M.; C. C. Bichara Filho; J. J. Resende; J. D. da Cruz & O. M. Marques. 2007b. Diversity and Community Structure of Social Wasps (Hymenoptera: Vespidae) in Three Ecosystems in Itaparica Island, Bahia State, Brazil. Neotropical Entomology 36: 180–185. Santos, G. M. de M.; P. C. Bispo & C. M. L. Aguiar. 2009a. Fluctuations in
Richness and Abundance of Social Wasps During the Dry and Wet Seasons in Three Phyto-Physiognomies at the Tropical Dry Forest of Brazil. Environmental Entomology 38: 1613–1617.
Santos. G. M. de M.; J. D. da Cruz; O. M. Marques & N. Gobbi. 2009b. Diversidade de Vespas Sociais (Hymenoptera: Vespidae) em Áreas de Cerrado na Bahia. Neotropical Entomology 38: 317–320.
Silva, S. de S. & O. T. Silveira. 2009. Vespas sociais (Hymenoptera, Vespidae, Polistinae) de floresta pluvial Amazônica de terra firme em Caxiuanã, Melgaço, Pará. Iheringia Série Zoologia 99: 317–323. Silva-Pereira, V. da & G. M. de Santos. 2006. Diversity in bee (Hymenoptera,
Apoidea) and social wasps (Hymenoptera, Vespidae) comumnity in “Cam-pos Rupestres”, Bahia, Brazil. Neotropical Entomology 35: 165–174. Silveira, O. T. 2002. Surveying Neotropical social wasps. An evaluation of methods
in the “Ferreira Penna” Research station (ECFPn), in Caxiuanã, PA, Brazil (Hym., Vespidae, Polistinae). Papéis Avulsos de Zoologia 42: 299–323. Silveira, O. T. 2006. Revision of the subgenus Kappa de Saussure of
Mischocyttarus de Saussure (Hym.; Vespidae, Polistinae, Mischocyttarini).
Zootaxa1321: 3–108.
Silveira, O. T.; S. V. da Costa Neto & O. F. M. da Silveira. 2008. Social wasps of two wetland ecosystems in brazilian Amazonia (Hymenoptera, Vespidae, Polistinae). Acta Amazonica 38: 333–344.
Storch, D. & K. J. Gaston. 2004. Untangling ecological complexity on different scales of space and time. Basic and Applied Ecology 5: 389–400. Sühs, R. B.; A. Somavilla; A. Köhler & J. Putzke. 2009. Vespídeos
(Hymenoptera, Vespidae) vetores de pólen de Schinus terebinthifolius Raddi (Anacardiaceae), Santa Cruz do Sul, RS, Brasil. Revista Brasi-leira de Biociências 7: 138–143.
Tanaka Junior, G. M. & F. B. Noll. 2011. Diversity of SocialWasps on Semideciduous Seasonal Forest Fragments with Different Surrounding Matrix in Brazil. Psyche: 1–8.
Togni, O. C. 2009. Diversidade de vespas sociais (Hymenoptera, Vespidae) na Mata Atlântica do litoral norte do estado de São Paulo. Dissertação de mestrado. Universidade Estadual Paulista Júlio de Mesquita Filho. 98 p. Williams, P. H.; C. R. Margules & D. W. Hilbert. 2002. Data requirements
and data sources for biodiversity priority area selection. Journal of Biosciences 27: 327–338.
Zucchi, R.; S. F. Sakagami; F. B. Noll; M. R. Mechi; S. Mateus; M. V. Baio & S. N. Shima. 1995. Agelaia vicina, a swarm-founding polistine with the largest colony size among wasps and bees (Hymenoptera: Vespidae).
Appendix 1. Wasp species mentioned in this article and correlations between species presence/absence variables and environmental factors in the Caxiuanã PPBio plot (computed only for species occurring in at least three samples); point biserial coefficients (above) and respective probabilities (below) are shown in each case.
Agelaia angulata (Fabricius 1804) -0.259 -0.303 0.023 Mischocyttarus duckei (Buysson 1908) -0.250 -0.055 0.162
0.044 0.018 0.858 0.052 0.673 0.212
Agelaia angulicollis (Spinola 1851) -0.091 -0.007 -0.022 Mischocyttarus lecointei (Ducke 1904) -0.089 -0.204 0.185
0.486 0.957 0.864 0.496 0.115 0.154 Agelaia cajennensis (Fabricius 1798) 0.011 -0.084 0.243 Mischocyttarus nr. mallaris 0.028 0.069 0.139
0.934 0.522 0.059 0.829 0.600 0.286
Agelaia centralis (Cameron 1907) -0.173 -0.328 0.358 Mischocyttarus nr. synoecus -0.086 -0.08 0.186
0.182 0.010 0.005 0.511 0.540 0.152 Agelaia fulvofasciata (Degeer 1773) -0.011 0.102 0.199 Mischocyttarus oecothrix Richards 1940 0.037 0.034 0.079
0.932 0.435 0.125 0.780 0.792 0.543
Agelaia myrmecophila (Ducke 1905) -0.036 0.048 0.086 Mischocyttarus sylvestris Richards 1945 0.132 0.019 0.053
0.783 0.715 0.512 0.310 0.883 0.686 Agelaia pallipes (Olivier 1791) -0.104 -0.107 0.053 Polybia (Alpha) sp. -0.132 -0.166 0.030
0.426 0.414 0.685 0.309 0.202 0.816
Agelaia testacea (Fabricius 1804) -0.117 0.003 0.188 Polybia cattillifex Moebius 1856 0.160 0.138 -0.048
0.369 0.979 0.148 0.218 0.290 0.714 Angiopolybia pallens (Lepeletier 1836) -0.311 -0.300 0.243 Polybia dimidiata (Olivier 1791) 0.198 0.053 -0.032
0.015 0.019 0.059 0.126 0.687 0.809
Angiopolybia paraensis (Spinola 1851) -0.169 -0.179 0.133 Polybia gorytoides Fox 1898 -0.212 -0.092 0.211
0.194 0.168 0.306 0.101 0.480 0.102 Apoica pallens (Fabricius 1804) 0.058 0.128 -0.045 Polybia platycephala Richards 1951 – – –
0.658 0.324 0.732 Polybia liliacea (Fabricius 1804) – – –
Leipomeles dorsata (Fabricius 1804) -0.040 0.019 0.178 Polybia emaciate Lucas 1879 – – –
0.760 0.885 0.171 Polybia striata (Fabricius 1787) – – –
Mischocyttarus carbonarius (de Saussure 1854) -0.106 -0.131 0.193 Polybia singularis Ducke 1909 – – –
0.417 0.315 0.137 Mischocyttarus adolphi Zikán 1935 – – – Mischocyttarus collarellus Richards 1940 0.164 0.092 -0.092
0.206 0.479 0.482