Vibrational spectroscopic characterization of the phosphate mineral ludlamite
(Fe,Mn,Mg)
3
(PO
4
)
2
4H
2
O – A mineral found in lithium bearing pegmatites
Ray L. Frost
a,⇑, Yunfei Xi
a, Ricardo Scholz
b, Fernanda M. Belotti
caSchool of Chemistry, Physics and Mechanical Engineering, Science and Engineering Faculty, Queensland University of Technology, GPO Box 2434, Brisbane Queensland 4001, Australia bGeology Department, School of Mines, Federal University of Ouro Preto, Campus Morro do Cruzeiro, Ouro Preto, MG 35400-00, Brazil
cFederal University of Itajubá, Campus Itabira, Itabira, MG 35903-087, Brazil
h i g h l i g h t s
"We have analyzed the phosphate mineral ludlamite by EMP-WDS. "The mineral is a ferrous phosphate
with some minor substitution of Mg and Mn.
"Spectroscopic analysis shows the mineral is predominantly a phosphate with some minor hydrogen phosphate units. "The position of the OH bands shows
that water is very strongly hydrogen bonded in the ludlamite structure.
g r a p h i c a l
a b s t r a c t
Raman spectrum of ludlamite in the phosphate stretching region.
a r t i c l e
i n f o
Article history:
Available online 16 November 2012
Keywords:
Raman Infrared
Molecular structure Ludlamite Pegmatite
a b s t r a c t
The objective of this work is to analyze ludlamite (Fe,Mn,Mg)3(PO4)24H2O from Boa Vista mine, Galiléia, Brazil and to assess the molecular structure of the mineral. The phosphate mineral ludlamite has been characterized by EMP-WDS, Raman and infrared spectroscopic measurements. The mineral is shown to be a ferrous phosphate with some minor substitution of Mg and Mn.
Raman bands at 917 and 950 cm1are assigned to the symmetric stretching mode of HOPO2 3 and PO34 units. Raman bands at 548, 564, 599 and 634 cm1are assigned to the
m4PO3
4 bending modes. Raman bands at 2605, 2730, 2896 and 3190 cm1and infrared bands at 2623, 2838, 3136 and 3185 cm1are attributed to water stretching vibrations. By using a Libowitzky empirical function, hydrogen bond dis-tances are calculated from the OH stretching wavenumbers. Strong hydrogen bonds in the structure of ludlamite are observed as determined by their hydrogen bond distances. The application of infrared and Raman spectroscopy to the study of ludlamite enables the molecular structure of the pegmatite min-eral ludlamite to be assessed.
Ó2012 Elsevier B.V. All rights reserved.
Introduction
The mineral ludlamite (Fe,Mn,Mg)3(PO4)24H2O is an hydrated
phosphate mineral found in complex pegmatites and was first identified at the classic Wheal Jane Mine in Cornwall, England. It is characterized by a bright green, usually apple-green color, a
vit-reous luster. The mineral is known from a number of other places worldwide[1–9]. The mineral is monoclinic with Point Group: 2/m and space group:P21/awitha= 10.541 Å,b= 4.646 Å,c= 9.324 Å,
b= 100.52° and Z= 2 [10]. The mineral is a common secondary alteration product of earlier phosphates, formed under reducing conditions.
There have been many studies of the magnetic properties of ludlamite[13–17]. Abrahams found the mineral remained mono-clinic even at very low temperatures[13]. Using neutron activation
1386-1425/$ - see front matterÓ2012 Elsevier B.V. All rights reserved.
http://dx.doi.org/10.1016/j.saa.2012.11.023
⇑ Corresponding author. Tel.: +61 7 3138 2407; fax: +61 7 3138 1804.
E-mail address:[email protected](R.L. Frost).
Contents lists available atSciVerse ScienceDirect
Spectrochimica Acta Part A: Molecular and
Biomolecular Spectroscopy
studies, Abrahams found that the phosphate unit was almost per-fectly symmetric [13]. Forsyth et al. [14] refined the magnetic properties of ludlamite. Meijer et al.[18]performed static suscep-tibility measurements on 2 single crystals of the mineral ludlamite Fe3(PO4)24H2O. Mossbauer studies were undertaken by Paster
et al.[15] and the hyperfine structure determined. Pizarro et al.
[16]studied the doping of ludlamite with Co2+.
Raman spectroscopy has proven most useful for the study of secondary minerals. To the best of the authors’ knowledge, there have been very few vibrational spectroscopic studies of ludlamite
[19]and no Raman studies of this mineral have been forthcoming. Some ludlamite related studies of iron containing phosphate min-erals such as vivianite and the so-called metavivianite have been undertaken by the authors[20–23]. The objective of this paper is to report the Raman and infrared spectra of ludlamite and relate the spectra to the molecular chemistry and the crystal chemistry of this phosphate mineral. The paper follows the systematic re-search on Raman and infrared spectroscopy of secondary minerals containing oxy-anions formed in the oxidation zone.
In this work, samples of a pure ludlamite from the Boa Vista pegmatite, located in the municipality of Galiléia, Minas Gerais, Brazil were analyzed. Studies include chemistry via EMP in the WDS mode, and spectroscopic characterization of the structure with infrared and Raman spectroscopy. We have relate the spectra to the structure and chemistry of the mineral.
Geological setting, occurrence and general appearance
The Boa Vista mine, located in the municipality of Galiléia, Min-as Gerais, Brazil is an important source of rare phosphates [11]. Nowadays, the pegmatite is mined for industrial feldspar and with minor importance of gemstones and samples for the collectors market. The pegmatite is heterogeneous with well developed min-eralogical and textural zoning. It has asymmetric lens shape with the longer axis trending to NW-SE and body dip about 65°to NE.
The maximum extension is of about 80 m and 10 m thickness. The pegmatite is hosted by quartz–mica schist of the São Tomé Formation with tourmalinization in the contact. Hydrothermal and metasomatic processes were responsible for a deep albitiza-tion of the pegmatite body [1]. The primary mineral association is represented by quartz, muscovite, microcline, schorl, dravite, beryl, graftonite and triphylite. The secondary association is mainly composed by albite, Li-rich micas, Sn, Nb, W and Ta oxides, sul-fides, siderite and a complex association of phosphates formed in the result of alteration of triphylite[1,2,11,12].
Secondary phosphates, namely heterosite, wolfeite, arrojadite, beryllonite, alluaudite, amblygonite, hydroxylherderite, vivianite, ludlamite, rockbridgeite, phosphosiderite and tavorite are common minerals in miarolitic cavities and in massive blocks formed after the aggregates of primary triphylite up to 1.0 m length[11]. Ludla-mite single crystals up to 4.0 mm along thecaxis and with pris-matic shape occur in association with siderite, metavivianite, albite and muscovite. Single crystals of ludlamite were extracted from a massive block in association with metavivianite and siderite.
Experimental
Samples and preparation
Light green ludlamite crystal from granitic pegmatite from Boa Vista mine, Galiléia, Minas Gerais, Brazil was obtained from the collection of the Geology Department of the Federal University of Ouro Preto, Minas Gerais, Brazil, with sample code SAA-091 and SAA-092. The samples are from Boa Vista claim, a lithium bearing
pegmatite located in Conselheiro Pena, Minas Gerais. The crystals were hand selected from a sample in association with metavivia-nite and siderite. The ludlamite crystals were analyzed by X-ray diffraction and Scanning electron microscopy (SEM).
Electron microprobe analysis (EMP)
EMP was performed on a ludlamite single crystal. The chemical analysis was undertaken using a Jeol JXA8900R with four WDS spectrometers at the Physics Department of the Federal University of Minas Gerais, Belo Horizonte. For each selected element the fol-lowing standards were applied: Fe (magnetite), Mn (rodhonite), Mg (MgO), Ca (Ca2P2O7), Al (Al2O3) and P (Ca2P2O7). Samples of
lud-lamite embedded in an epoxy resin were coated with a thin layer of evaporated carbon. The EMP was performed at 15 kV of accelerat-ing voltage and beam current of 10 nA.
Raman microprobe spectroscopy
Crystals of ludlamite were placed on a polished metal surface on the stage of an Olympus BHSM microscope, which is equipped with 10, 20, and 50 objectives. The microscope is part of a Renishaw 1000 Raman microscope system, which also includes a monochromator, a filter system and a CCD detector (1024 pixels). The Raman spectra were excited by a Spectra-Physics model 127 He–Ne laser producing highly polarized light at 633 nm and col-lected at a nominal resolution of 2 cm1 and a precision of
±1 cm1in the range between 200 and 4000 cm1. Repeated
acqui-sitions on the crystals using the highest magnification (50) were accumulated to improve the signal to noise ratio of the spectra. Raman Spectra were calibrated using the 520.5 cm1 line of a
silicon wafer. The Raman spectrum of at least 10 crystals was collected to ensure the consistency of the spectra. Different orien-tations were collected. The Raman spectra were measured at room temperature (298 K).
Infrared spectroscopy
Infrared spectra of the same crystals used for Raman spectros-copy were obtained using a Nicolet Nexus 870 FTIR spectrometer with a smart endurance single bounce diamond ATR cell. Spectra over the 4000–525 cm1range were obtained by the co-addition
of 128 scans with a resolution of 4 cm1and a mirror velocity of
0.6329 cm/s. Spectra were co-added to improve the signal to noise ratio. Infrared spectra were measured at 298 K.
Spectral manipulation such as baseline correction/adjustment and smoothing were performed using the Spectracalc software package GRAMS (Galactic Industries Corporation, NH, USA). Band component analysis was undertaken using the Jandel ‘Peakfit’ soft-ware package that enabled the type of fitting function to be se-lected and allows specific parameters to be fixed or varied accordingly. Band fitting was done using a Lorentzian–Gaussian cross-product function with the minimum number of component bands used for the fitting process. The Gaussian–Lorentzian ratio was maintained at values greater than 0.7 and fitting was under-taken until reproducible results were obtained with squared corre-lations ofr2greater than 0.995.
Results and discussion
Chemical characterization
and the chemical formula was calculated on the basis of 12 oxygen atoms (O, OH, H2O) in the structure. The chemical composition
indicates a partial substitution of Fe+cations by Mg2+and Mn2+.
Traces of Ca and Al also were found. Chemical formula is thus (Fe2.35Mn0.25Mg0.22)P2.82(PO4)2.084.0(H2O).
Raman and infrared spectroscopy
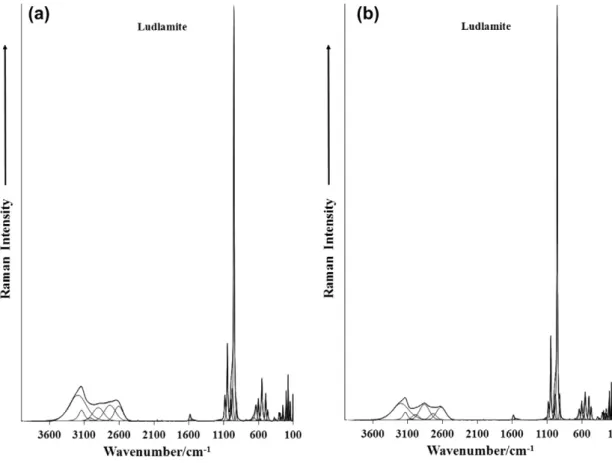
The Raman spectra of the two ludlamite mineral samples la-beled as SAA-091 and SAA-092 over the complete wavenumber range is shown inFig. 1a and b. These spectra display the relative intensities of the Raman bands and their position. It is obvious that the two spectra inFig. 1a and b are almost identical. It is noted that there are large parts of the spectra where no intensity is observed. Thus, the spectra are subdivided into section based upon the type of vibration being studied. The infrared spectra of the two ludla-mite samples are displayed inFig. 2a and b. These spectra display the position and relative intensities of the infrared bands. As with the Raman spectra there are large sections of the spectra where no intensity is observed. Thus, the spectra are subdivided into sections depending upon the type of vibration being studied.
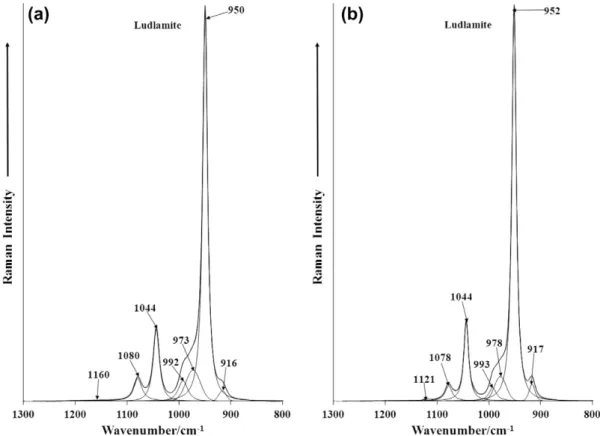
The Raman spectra of ludlamite in the 800–1300 cm1spectral
range are illustrated inFig. 3a and b. An intense Raman band at around 950 cm1is assigned to the
m
1PO34 symmetric stretching
mode. A shoulder band observed at 917 cm1 is assigned to
HOPO2
3 symmetric stretching mode. Two low intensity Raman
bands are found at around 973 and 992 cm1(Fig. 3a) and 978
and 993 cm1 (Fig. 3b). These bands are assigned to
ðHOÞ2PO22
symmetric stretching mode. Choi et al.[24]published spectra of NaH2PO4; however these authors did not tabulate or mark the
po-sition of the peaks. Therefore, it is very difficult to make any com-parison of the peak positions of ludlamite and that of published data by Choi et al. Casciani and Condrate[25]reported bands as-signed to these vibrational modes for Ca(H2PO4)2 at 876 and
901 cm1. The Raman bands at 1044, 1080 and 1160 cm1
(Fig. 3a) and 1044, 1078 and 1121 cm1(Fig. 3b) are assigned to
the phosphate and hydrogen phosphate antisymmetric stretching modes. In the work undertaken on the magnetic properties of lud-lamite, it is always stated that the phosphate anion retains its sym-metry[10,15,18]. However, in terms of vibrational spectroscopy peaks which are attributed to hydrogen phosphate and dihydrogen phosphate units are observed, thus supporting the concept of loss of symmetry of the phosphate units. It is proposed that the protons from water are very labile and can interact with the phosphate units to for hydrogen phosphate ions. On the picosecond time scale of vibrational spectroscopy, as compared with measurements made with magnetic susceptibility measurements, the proton oscillates between water and the phosphate units, which results in the formation of the hydrogen phosphate units.
The infrared spectra of the two ludlamite samples are reported inFig. 4a and b. The infrared spectra are very similar. An intense infrared band is observed at 988 cm1 and is assigned to the
m
1
PO3
4 symmetric stretching mode. The intense band at 1039 cm1
with a shoulder at 1098 cm1is assigned to the
m
3PO34
antisym-metric stretching mode. Two other intense infrared bands are ob-served at 912 and 939 cm1and are attributed to the stretching
vibrations of theðHOÞ2PO22units.
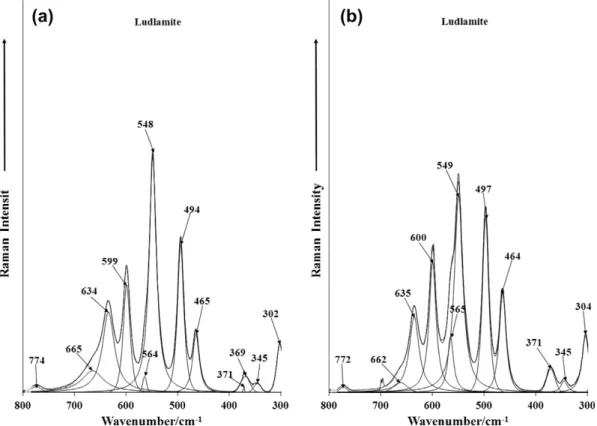
The Raman spectra of ludlamite in the 300–800 cm1spectral
region are shown inFig. 5a and b. This spectral region is where the phosphate bending modes are observed. Raman bands are ob-served at 548, 564, 599 and 634 cm1(Fig. 5a) and 549, 565, 600,
and 635 cm1(Fig. 5b). Ardealite Ca
2(HPO4)(SO4)4H2O is a mineral
which also contains the hydrogen phosphate anion. Intense Raman bands are found at 505 and 528 cm1for ardealite and are assigned
to the
m
4ðHPO4Þ2bending modes. It is probable that the bendingmodes of OPO and HOPO bending modes occur at the same energy, thus two distinct bands are not observed. The mineral newberyite Mg(PO3OH)3H2O also contains a hydrogen phosphate anion. The
Raman spectrum of this mineral has been reported[26]. An intense band was observed for this mineral at 498 cm1. Rajendran and
Keefe [27] reported Raman bands at 521 and 586 cm1and
as-signed these bands to (HAO)P@O absorption bands. This
assign-ment is in contrast to the assignassign-ment of bands by Ross as reported in Farmer’s treatise on the infrared spectra of minerals
[28].
The Raman spectrum of ludlamite in the 100–300 cm1spectral
range is reported inFig. 6a and b. There is a close resemblance be-tween the spectra in this far wavenumber range bebe-tween the two samples. For sample SAA-091, intense Raman bands are observed at 103, 172 and 199 cm1and for sample SAA-092, Raman bands
are found at 104, 145, 174 and 202 cm1. Raman bands of lower
intensity are observed at 244, 249, 266 and 286 cm1 for
SAA-091 and 243, 251, 261, 271 and 287 cm1 for mineral SAA-092.
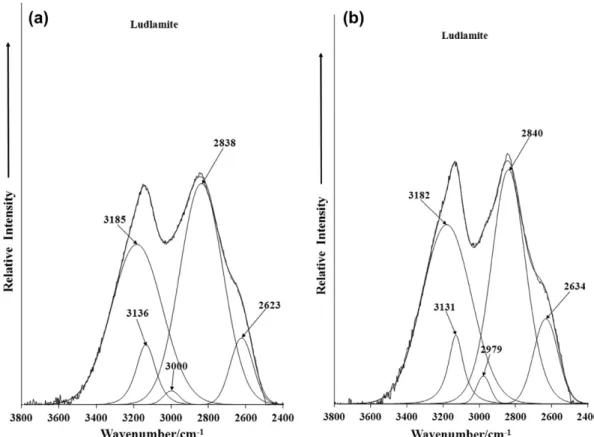
These bands are described as external vibrations or lattice modes. The Raman spectrum of ludlamite in the OH stretching region over the 2400 to 3800 cm1 spectral range are displayed in Fig. 7a and b. The spectra consist of a series of overlapping bands which may be resolved into component bands. Bands are observed at 2605, 2730, 2896 and 3190 cm1for sample SAA-091 and at
2621, 2735, 2859 and 3196 cm1 for mineral sample SAA-092.
The position of the bands shows that water is involved in very strong bonding to the metal cations. The infrared spectrum of lud-lamite in the OH stretching region over the 2400–3800 cm1
spec-tral range are displayed inFig. 8a and b. As for the Raman spectra, the spectral profiles may be resolved into component bands. Infra-red bands are observed at 2623, 2838, 3136 and 3185 cm1
(sam-ple SAA-091) and at 2634, 2840, 2979, 3131 and 3182 cm1
(sample SAA-092). These bands are assigned to the OH stretching vibrations of water.
Studies have shown a strong correlation between OH stretching frequencies and both O O bond distances and H O hydrogen bond distances[29–32]. Libowitzky[33]showed that a regression function can be employed relating the hydroxyl stretching wave-numbers with regression coefficients better than 0.96 using infra-red spectroscopy [33]. The function is described as:
m
1¼ ð3592304Þ 109dðOAOÞ
0:1321 cm1. Thus OH -- -O hydrogen bond
Table 1
Chemical composition of ludlamite from Boa Vista pegmatite (mean of 3 electron microprobe analyses). H2O calculated by stoichiometry.
Constituent wt.% Range (wt.%) Number of atoms Probe standard/crystal
FeO 42.07 40.78–42.82 2.35 Magnetite/TAP
MnO 4.37 3.62–5.48 0.25 Rodhonite/LIF
P2O5 36.82 36.41–37.20 2.08 Ca2P2O7/PETJ
MgO 2.15 1.96–2.43 0.22 MgO/TAP
CaO 0.01 0.01–0.02 0.00 Ca2P2O7/PETJ
Al2O3 0.07 0.04–0.12 0.00 Al2O3/TAP
H2O 17.98 Calculated by stoichiometry 4.00
distances may be calculated using the Libowitzky empirical func-tion. Hydrogen bond distances may be obtained by using the OH stretching wavenumbers as given inFig. 7a and b.
By using the position of the Raman OH stretching wavenum-bers, estimates of the hydrogen bond distances can be made. Here hydrogen bond distances are calculated as 2.582 (2605 cm1),
Fig. 1.Raman spectrum of ludlamite (samples SAA-091 and SAA-092) in the 100–4000 cm1spectral range.
2.600 Å (2730 cm1), 2.628 Å (2896 cm1), 2.652 Å (3013 cm1),
2.684 Å (3137 cm1), 2.799 Å (3190 cm1). It is observed that the
hydrogen bond distances calculated from the Raman spectra are
in a similar range as calculated from the infrared spectrum. The large hydrogen bond distances which are present in ludlamite can also be seen in other mixed anion minerals such as peisleyite
Fig. 3.Raman spectrum of ludlamite (samples SAA-091 and SAA-092) in the 800–1400 cm1spectral range.
and perhamite [34,35] where the distances ranging between 3.052(5) and 2.683(6) Å. Two types of OH units can be identified in the structure of ludlamite. The hydrogen bond distances
previously established can be used to predict the hydroxyl stretching wavenumbers. The spectrum of ludlamite may be di-vided into two groups of OH stretching wavenumbers; namely
Fig. 5.Raman spectrum of ludlamite (samples SAA-091 and SAA-092) in the 300–800 cm1spectral range.
2600–3000 cm1and 3000–3200 cm1. This distinction suggests
that the strength of the hydrogen bonds as measured by the hydro-gen bond distances can also be divided into two groups according to the H-bond distances. An arbitrary cut-off point may be 2.649 Å based upon the wavenumber 3000 cm1. Thus, the bands listed
above occurring above 3000 cm1 may be described as weak
hydrogen bonds and the series of bands <3000 cm1as relatively
strong hydrogen bonds. The number and variation of water hydrogen bond distances are important for the stability off the mineral.
Fig. 7.Raman spectrum of ludlamite (samples SAA-091 and SAA-092) in the 2800–3800 cm1spectral range.
Conclusions
The phosphate mineral ludlamite has been characterized by EMP, Raman and infrared spectroscopic measurements. Raman spectroscopy identified an intense sharp band at 950 cm1
attrib-uted to the
m
1PO34 symmetric stretching mode. A low intensityshoulder band at 917 cm1 is assigned to HOPO2
3 symmetric
stretching mode. It is suggested that this hydrogen phosphate re-sults for the rapid exchange of the proton from water resulting in the formation of hydrogen phosphate. Raman bands at 548, 564, 599 and 634 cm1are assigned to the
m
4PO34bending modes.
Ra-man bands in the OH stretching region are assigned to water stretching vibrations. The position of these bands provides evi-dence for strong bonding of the water to the metal cations. Further, the position of the water stretching modes indicates strong hydro-gen bonding between the phosphate and water units. The values of the calculated hydrogen bond distances shows the hydrogen bond distances are very short indicating very strong hydrogen bonds be-tween water and the phosphate units.
Acknowledgements
The financial and infra-structure support of the Discipline of Nanotechnology and Molecular Science, Science and Engineering Faculty of the Queensland University of Technology, is gratefully acknowledged. The Australian Research Council (ARC) is thanked for funding the instrumentation. R. Scholz offers thanks to FAP-EMIG – Fundação de Amparo à Pesquisa do estado de Minas Gerais, (Grant No. CRA – APQ-03998-10).
References
[1] J.P. Cassedanne, J.O. Cassedanne, Anais. Acad. Brasil. Ciencias 50 (1978) 89–93. [2] J.P. Cassedanne, J.O. Cassedanne, Can. Miner. 20 (1982) 87–89.
[3] F. Field, Philos. Mag. iii (1798–1977) 52–57. [4] M. Mader, Mineral 14 (1976) 52–61.
[5] P.B. Moore, Am. Mineral. 49 (1964) 1119–1122.
[6] A.M.R. Neiva, M.M.V.G. Silva, I.M.H.R. Antunes, J.M.F. Ramos, J. Czech Geol. Soc. 46 (2001) 35–43.
[7] J.K. Novak, E. Pivec, M. Stemprok, J. Czech Geol. Soc. 41 (1996) 201–207. [8] M. Orliac, R. Pulou, F. Tollon, C.R. 94 (1971) 125–130.
[9] M. Stone, M.C. George, Proc. Ussher Soc. 5 (1983) 428–431. [10] S.C. Abrahams, J.L. Bernstein, J. Chem. Phys. 44 (1966) 2223–2229. [11] J. Cassedanne, Anais. Acad. Brasil. Ciencias 51 (1979) 311–326.
[12] M.L.S.C. Chaves, R. Scholz, D. Atencio, J. Karfunkel, Geociências 24 (2005) 14– 161.
[13] S.C. Abrahams, J. Chem. Phys. 44 (1966) 2230–2237.
[14] J.B. Forsyth, C. Wilkinson, S. Paster, J. Phys. 2 (1990) 8381–8390.
[15] S. Paster, C. Wilkinson, J.B. Forsyth, C.E. Johnson, Q.A. Pankhurst, M.F. Thomas, Hyperfine Interact. 54 (1990) 651–653.
[16] J.L. Pizarro, L. Lezama, G. Villeneuve, M.I. Arriortua, T. Rojo, J. Phys. (1988). C8-2063/C2068-2064.
[17] T.W.J. van Agt, N.J. Poulis, Physica 30 (1964) 588–596.
[18] H.C. Meijer, J.J. Giesen, J. Van den Handel, Physica 38 (1968) 227–232. [19] S.V. Gevork’yan, A.S. Povarennykh, Konst. Svoistva Miner. 7 (1973) 92–99. [20] R.L. Frost, M. Weier, Neues Jahrb. Fuer Mineral. (2004) 445–463.
[21] R.L. Frost, M. Weier, W.G. Lyon, Neues Jahrb. Fuer Mineral. (2004) 228–240. [22] R.L. Frost, M.L. Weier, W. Martens, J.T. Kloprogge, Z. Ding, Thermochim. Acta
401 (2003) 121–130.
[23] R.L. Frost, W. Martens, P.A. Williams, J.T. Kloprogge, Mineral. Mag. 66 (2002) 1063–1073.
[24] B.K. Choi, M.N. Lee, J.J. Kim, J. Raman Spectrosc. 20 (1989) 11–15.
[25] F.S. Casciani, R.A. Condrate, Sr., in: Proc. Inter. Cong. Phosphorus Comp., 2nd, 1980, pp. 175–190.
[26] R.L. Frost, M.L. Weier, W.N. Martens, D.A. Henry, S.J. Mills, Spectrochim. Acta 62A (2005) 181–188.
[27] K. Rajendran, C.D. Keefe, Cryst. Res. Technol. 45 (2010) 939–945.
[28] V.C. Farmer, Mineralogical Society Monograph 4: The Infrared Spectra of Minerals, The Mineralogical Society, London, 1974.
[29] J. Emsley, Chem. Soc. Rev. 9 (1980) 91–124. [30] H. Lutz, Struct. Bond. 82 (1995) 85–103. [31] W. Mikenda, J. Mol. Struct. 147 (1986) 1–15. [32] A. Novak, Struct. Bond. 18 (1974) 177–216. [33] E. Libowitsky, Monat. Chem. 130 (1999) 1047–1049.
[34] R.L. Frost, S.J. Mills, M.L. Weier, Spectrochim. Acta 61A (2004) 177–184. [35] R.L. Frost, M.L. Weier, S.J. Mills, Spectrochim. Acta 67A (2007) 604–610.